Parallel atomic force microscopy with optical interferometric detection
T. Sulchek,a)R. J. Grow, G. G. Yaralioglu, S. C. Minne, and C. F. Quate E. L. Ginzton Laboratory, Stanford University, California 94305-4085
S. R. Manalis
Media Lab, Massachusetts Institute of Technology, Cambridge, Massachusetts 02139 A. Kiraz, A. Aydine, and A. Atalar
Bilkent University, Ankara, 06533, Turkey
共Received 16 October 2000; accepted for publication 5 January 2001兲
We have developed an atomic force microscope that uses interferometry for parallel readout of a cantilever array. Each cantilever contains a phase sensitive diffraction grating consisting of a reference and movable set of interdigitated fingers. As a force is applied to the tip, the movable set is displaced and the intensity of the diffracted orders is altered. The order intensity from each cantilever is measured with a custom array of silicon photodiodes with integrated complementary metal–oxide–semiconductor amplifiers. We present images from five cantilevers acquired in the constant height mode that reveal surface features 2 nm in height. The interdigital method for cantilever array readout is scalable, provides angstrom resolution, and is potentially simpler to implement than other methods. © 2001 American Institute of Physics. 关DOI: 10.1063/1.1352697兴
At the heart of the atomic force microscope is the canti-lever and a sensor that measures its displacement. Deflection sensors have included the optical lever,1 interferometer,2 fi-ber optic interferometer,3,4 piezoresistor,5 capacitive sensing,6 and interdigital detection.7,8 Each has relative strengths and weaknesses in terms of sensitivity, alignment requirements, compatibility with integrated actuators, and ability to scale up into arrays that operate in parallel.
The interdigital cantilever contains an integrated diffrac-tion grating consisting of a reference and movable set of interdigitated fingers. The cantilever is illuminated with a laser diode and the intensity of a diffracted order is measured with a silicon photodiode. As a force is applied to the tip, the movable set is displaced and the intensity of the diffracted order changes. By measuring the intensity of the reflected orders, cantilever displacement can be determined with sub-angstrom accuracy. The interdigital cantilever achieves the resolution of the fiber optic interferometer while eliminating the stringent alignment required for the fiber position.7
The scan range for mechanical actuators used by the scanning probe microscope is typically limited to 200 m. To increase the scanning area, cantilever arrays with inde-pendent, piezoresistive sensors have been developed by many groups.9–12Vettiger and co-workers13have used large arrays of cantilevers to push the limits of high-density data storage.
The piezoresistive sensor is popular for parallel opera-tion because external alignment is unnecessary and the out-put is linear over a large range. However, for common can-tilever designs, the piezoresistive sensor is Johnson noise limited14 and thus cannot provide the vertical resolution of optical techniques. Especially for independently actuated ar-rays of cantilevers, resistor thermal noise, coupling between the actuator and sensor, and other noise sources can limit
vertical resolution to 5 nm in high-speed operation共a 20 kHz bandwidth兲.12 In addition, piezoresistive sensors require an electrical contact for each cantilever, limiting cantilever ar-ray density. Capacitive sensors have also been developed for arrays, though coupling between the actuators and sensors, as well as the parasitic capacitances, limits resolution.15
High resolution can be achieved through the use of op-tical methods to monitor deflection of cantilever arrays. Lang and co-workers16 used the optical lever to measure a canti-lever array for a chemical nose. An array of multiplexed laser diodes and a linear graded photodiode were used to measure the deflection of one cantilever at a time. However, multiplexing limits the detection and electronics bandwidth per cantilever making it unsuitable for high density arrays with integrated actuators operating under closed loop.
This letter demonstrates that the interdigital detection method is suitable for scalable parallel operation. The pri-mary advantage of this system is an order of magnitude im-provement in sensitivity over other types of sensor arrays.
The cantilever array was fabricated using the process described in Ref. 7. Cantilevers are 220–400m long, 2m thick, and spaced on a 200 m pitch. The photodetectors used in this experiment, shown in Fig. 1, were fabricated using 0.8m very large scale integrated technology.17These photodetectors consist of eight photodiodes, each with a tran-simpedance amplifier. Each photodiode has an active area of 100 m⫻100m and are aligned along the diagonal of the chip. The n-well active area is surrounded by a square ring of metal with n-substrate contacts, constituting the cathode of the diode. The p-well layer exists throughout the chip. An-other square ring of metal, riveted to the p substrate through substrate contacts, encloses the first and acts as the anode of the diode. The resulting current is converted to a voltage through an inverting amplifier. The complementary metal– oxide–semiconductor operational amplifiers utilized a cas-cade amplifier to provide high gain. This chip was fabricated within an area of 1.5 mm⫻1.5 mm and mounted on a chip
a兲Electronic mail: [email protected]
APPLIED PHYSICS LETTERS VOLUME 78, NUMBER 12 19 MARCH 2001
1787
carrier. The output of each amplifier is sent to a personal computer expansion board via a 16 pin coax ribbon wire. This expansion board contains the control system which con-sists of integrated electronics and personal computer control for automated operation.12
A single laser diode共10 mW, 635 nm兲 was used as the illumination source. Cylindrical optics focus the beam to a line, illuminating the interdigitated fingers of each cantilever. The diffracted orders from a given cantilever are formed in a line oriented along the cantilever length 共vertical axis兲. The photodetectors are aligned as a unit to the desired order, as shown in Fig. 2共a兲. Since the longitudinal finger support of the cantilevers is illuminated, light reflecting specularly from these parts interferes with the 0th order. By measuring the intensity of the ⫹1 or ⫹2 orders rather than the 0th order, optical coupling from the unwanted specular reflections can be minimized. The deflection of the cantilevers is measured by positioning a photodetector array with a horizontal pitch equal to the cantilever spacing. An aperture is used to re-move unwanted orders. Since the deflection is determined
only by intensity, the vertical assignment is not crucial as long as the diffracted orders are incident on the detector and the active area of the detector is larger than the order size. This provides an advantage over beam bounce detection, where the laser spot must be focused precisely onto the me-dian of a split photodetector.
A schematic of the microscope used to measure the dif-fracted order intensity from interdigital arrays is shown in Fig. 2共b兲. An imaging lens is used to project the diffracted orders from a plane located a few millimeters above the can-tilever to the photodetector plane. The lens has a focal length of 1.2 cm which creates a 1:1 image at twice this length.
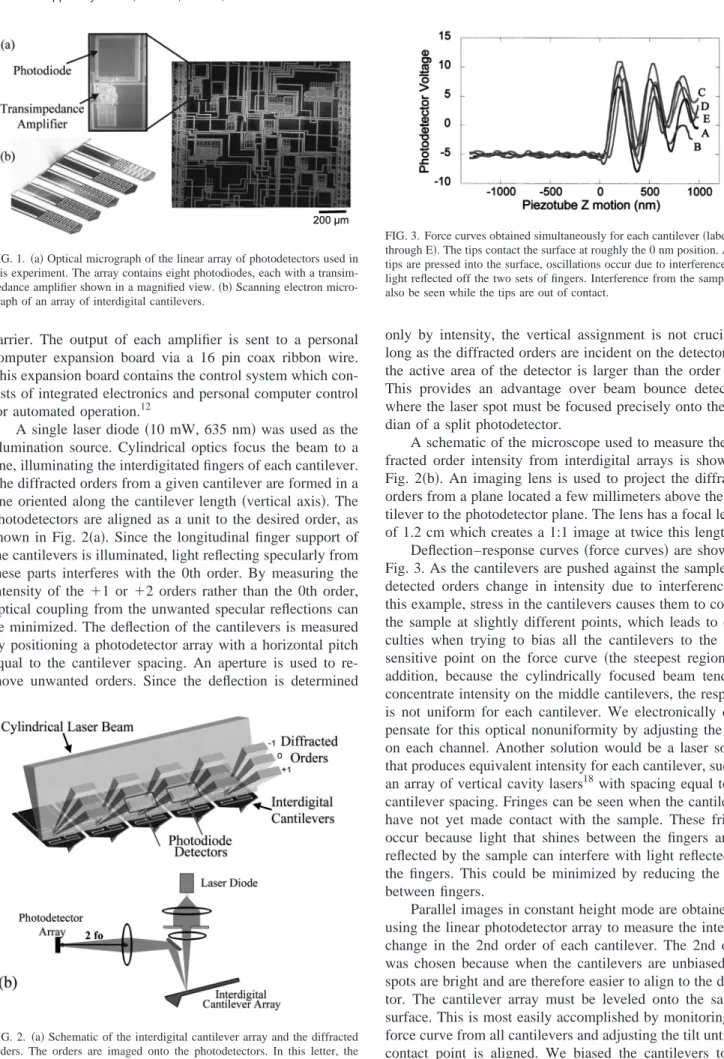
Deflection–response curves共force curves兲 are shown in Fig. 3. As the cantilevers are pushed against the sample, the detected orders change in intensity due to interference. In this example, stress in the cantilevers causes them to contact the sample at slightly different points, which leads to diffi-culties when trying to bias all the cantilevers to the most sensitive point on the force curve 共the steepest region兲. In addition, because the cylindrically focused beam tends to concentrate intensity on the middle cantilevers, the response is not uniform for each cantilever. We electronically com-pensate for this optical nonuniformity by adjusting the gain on each channel. Another solution would be a laser source that produces equivalent intensity for each cantilever, such as an array of vertical cavity lasers18 with spacing equal to the cantilever spacing. Fringes can be seen when the cantilevers have not yet made contact with the sample. These fringes occur because light that shines between the fingers and is reflected by the sample can interfere with light reflected off the fingers. This could be minimized by reducing the gaps between fingers.
Parallel images in constant height mode are obtained by using the linear photodetector array to measure the intensity change in the 2nd order of each cantilever. The 2nd order was chosen because when the cantilevers are unbiased, the spots are bright and are therefore easier to align to the detec-tor. The cantilever array must be leveled onto the sample surface. This is most easily accomplished by monitoring the force curve from all cantilevers and adjusting the tilt until the contact point is aligned. We biased the cantilevers to the sensitive regime by engaging the array into the sample sur-face with the piezotube. Alternatively, biasing could be ob-tained with independent actuators. Next, the illumination is FIG. 1.共a兲 Optical micrograph of the linear array of photodetectors used in
this experiment. The array contains eight photodiodes, each with a transim-pedance amplifier shown in a magnified view.共b兲 Scanning electron micro-graph of an array of interdigital cantilevers.
FIG. 2. 共a兲 Schematic of the interdigital cantilever array and the diffracted orders. The orders are imaged onto the photodetectors. In this letter, the second orders were used共not shown兲. 共b兲 Schematic of the microscope. A collimated laser beam is focused with cylindrical optics onto the cantilever array. The reflected orders are projected onto the photodetector array with an imaging lens.
FIG. 3. Force curves obtained simultaneously for each cantilever共labeled A through E兲. The tips contact the surface at roughly the 0 nm position. As the tips are pressed into the surface, oscillations occur due to interference from light reflected off the two sets of fingers. Interference from the sample can also be seen while the tips are out of contact.
adjusted so that only the interdigitated fingers nearest to the cantilever base are illuminated. This increases the period of the force curves shown in Fig. 3 which maximizes the verti-cal deflection range where the detector output is linear. The output of each photodetector is recorded while the piezotube scans the sample in a raster pattern.
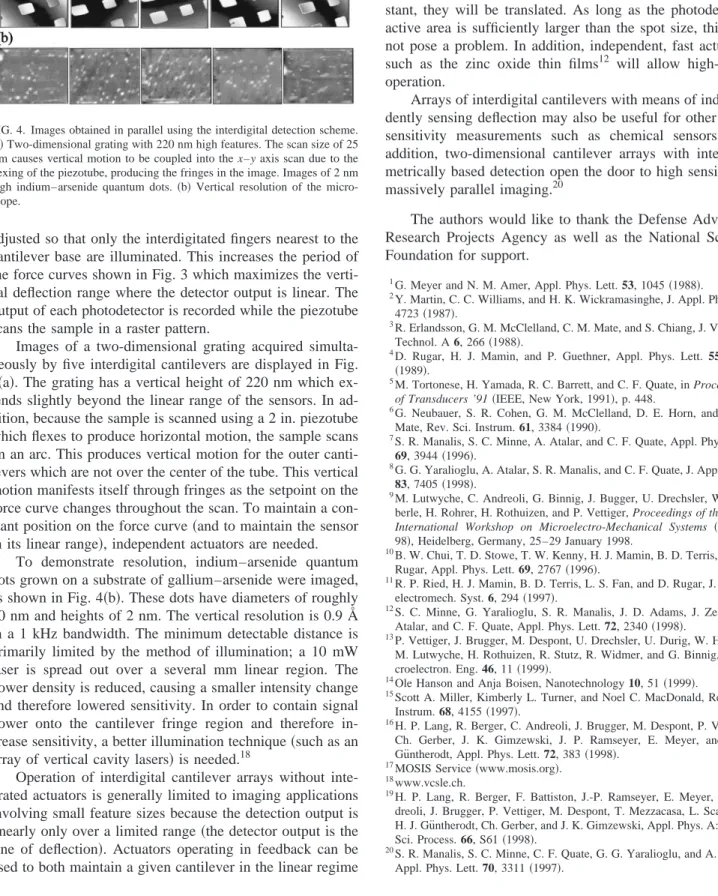
Images of a two-dimensional grating acquired simulta-neously by five interdigital cantilevers are displayed in Fig. 4共a兲. The grating has a vertical height of 220 nm which ex-tends slightly beyond the linear range of the sensors. In ad-dition, because the sample is scanned using a 2 in. piezotube which flexes to produce horizontal motion, the sample scans on an arc. This produces vertical motion for the outer canti-levers which are not over the center of the tube. This vertical motion manifests itself through fringes as the setpoint on the force curve changes throughout the scan. To maintain a con-stant position on the force curve共and to maintain the sensor in its linear range兲, independent actuators are needed.
To demonstrate resolution, indium–arsenide quantum dots grown on a substrate of gallium–arsenide were imaged, as shown in Fig. 4共b兲. These dots have diameters of roughly 20 nm and heights of 2 nm. The vertical resolution is 0.9 Å in a 1 kHz bandwidth. The minimum detectable distance is primarily limited by the method of illumination; a 10 mW laser is spread out over a several mm linear region. The power density is reduced, causing a smaller intensity change and therefore lowered sensitivity. In order to contain signal power onto the cantilever fringe region and therefore in-crease sensitivity, a better illumination technique共such as an array of vertical cavity lasers兲 is needed.18
Operation of interdigital cantilever arrays without inte-grated actuators is generally limited to imaging applications involving small feature sizes because the detection output is linearly only over a limited range共the detector output is the sine of deflection兲. Actuators operating in feedback can be used to both maintain a given cantilever in the linear regime
as well as maintain a constant tip/sample force. The actuator would simultaneously move both sets of fingers so that, al-though the intensity of the diffracted orders will remain con-stant, they will be translated. As long as the photodetector active area is sufficiently larger than the spot size, this will not pose a problem. In addition, independent, fast actuators such as the zinc oxide thin films12 will allow high-speed operation.
Arrays of interdigital cantilevers with means of indepen-dently sensing deflection may also be useful for other high-sensitivity measurements such as chemical sensors.19 In addition, two-dimensional cantilever arrays with interfero-metrically based detection open the door to high sensitivity, massively parallel imaging.20
The authors would like to thank the Defense Advanced Research Projects Agency as well as the National Science Foundation for support.
1G. Meyer and N. M. Amer, Appl. Phys. Lett. 53, 1045共1988兲. 2
Y. Martin, C. C. Williams, and H. K. Wickramasinghe, J. Appl. Phys. 61, 4723共1987兲.
3R. Erlandsson, G. M. McClelland, C. M. Mate, and S. Chiang, J. Vac. Sci. Technol. A 6, 266共1988兲.
4D. Rugar, H. J. Mamin, and P. Guethner, Appl. Phys. Lett. 55, 2588
共1989兲.
5M. Tortonese, H. Yamada, R. C. Barrett, and C. F. Quate, in Proceedings of Transducers ’91共IEEE, New York, 1991兲, p. 448.
6G. Neubauer, S. R. Cohen, G. M. McClelland, D. E. Horn, and C. M. Mate, Rev. Sci. Instrum. 61, 3384共1990兲.
7
S. R. Manalis, S. C. Minne, A. Atalar, and C. F. Quate, Appl. Phys. Lett.
69, 3944共1996兲.
8G. G. Yaralioglu, A. Atalar, S. R. Manalis, and C. F. Quate, J. Appl. Phys.
83, 7405共1998兲.
9
M. Lutwyche, C. Andreoli, G. Binnig, J. Bugger, U. Drechsler, W. Hae-berle, H. Rohrer, H. Rothuizen, and P. Vettiger, Proceedings of the IEEE International Workshop on Microelectro-Mechanical Systems 共MEMS 98兲, Heidelberg, Germany, 25–29 January 1998.
10B. W. Chui, T. D. Stowe, T. W. Kenny, H. J. Mamin, B. D. Terris, and D. Rugar, Appl. Phys. Lett. 69, 2767共1996兲.
11R. P. Ried, H. J. Mamin, B. D. Terris, L. S. Fan, and D. Rugar, J. Micro-electromech. Syst. 6, 294共1997兲.
12S. C. Minne, G. Yaralioglu, S. R. Manalis, J. D. Adams, J. Zesch, A. Atalar, and C. F. Quate, Appl. Phys. Lett. 72, 2340共1998兲.
13P. Vettiger, J. Brugger, M. Despont, U. Drechsler, U. Durig, W. Haberle, M. Lutwyche, H. Rothuizen, R. Stutz, R. Widmer, and G. Binnig, J. Mi-croelectron. Eng. 46, 11共1999兲.
14Ole Hanson and Anja Boisen, Nanotechnology 10, 51共1999兲. 15
Scott A. Miller, Kimberly L. Turner, and Noel C. MacDonald, Rev. Sci. Instrum. 68, 4155共1997兲.
16H. P. Lang, R. Berger, C. Andreoli, J. Brugger, M. Despont, P. Vettiger, Ch. Gerber, J. K. Gimzewski, J. P. Ramseyer, E. Meyer, and H.-J. Gu¨ntherodt, Appl. Phys. Lett. 72, 383共1998兲.
17
MOSIS Service共www.mosis.org兲. 18www.vcsle.ch.
19H. P. Lang, R. Berger, F. Battiston, J.-P. Ramseyer, E. Meyer, C. An-dreoli, J. Brugger, P. Vettiger, M. Despont, T. Mezzacasa, L. Scandella, H. J. Gu¨ntherodt, Ch. Gerber, and J. K. Gimzewski, Appl. Phys. A: Mater. Sci. Process. 66, S61共1998兲.
20S. R. Manalis, S. C. Minne, C. F. Quate, G. G. Yaralioglu, and A. Atalar, Appl. Phys. Lett. 70, 3311共1997兲.
FIG. 4. Images obtained in parallel using the interdigital detection scheme.
共a兲 Two-dimensional grating with 220 nm high features. The scan size of 25 m causes vertical motion to be coupled into the x–y axis scan due to the flexing of the piezotube, producing the fringes in the image. Images of 2 nm high indium–arsenide quantum dots.共b兲 Vertical resolution of the micro-scope.
1789