Economics Letters 39 (1992) 213-216 North-Holland
213
Behavior of systematic risk in a regionally
integrated model for stock prices
Haluk Akdogan
Bilkent Unicersity, Ankara, Turkey
Institute for International Education, Copenhagen, Denmark
Received 21 January 1992 Accepted 24 March 1992
Regional (EC) capital market integration is examined by monitoring the behavior of systematic risk vis-a-vis a single index time series return generating model. Evidence supports that the EC markets for securities have gradually become more integrated and that the capital controls are important sources of segmentation.
1. Introduction
This paper uses the proportion of systematic risk as.estimated by a time series return generating process in a single index European Community (EC) composite model to test for equity market integration in Europe. The role of capital controls on segmentation of international equity markets is also examined.
No clear cut answer to the question of segmentation versus integration in international capital markets has been provided in the literature. Most have failed to accept the hypothesis that the securities are priced in an international model as opposed to a local one. Among those who deal with but cannot furnish an answer to the issue of capital markets integration are Errunza and Losq (198.51, Jorion and Schwartz (19861, Obstfeld (19861, Solnik (1974, 19771, Stehle (19771, Stulz (1981a, b), Wheatley (1988). Market imperfections create segmentation in capital markets. Two major types are recognized as the potential sources of segmentation. The first one is what is known as direct barriers against the country of origin of investment. The second one is the inability of a class of investors to trade in a foreign market.
2. Model
Given the multivariate probability distribution of the rate of return to market portfolio and the international (EC composite) portfolio, the stochastic return generating process is that
ri,f -
rf = ff; +
Pi(ret -
rf) +
Ei,, ,(1)
Correspondence to: Haluk Akdogan, Bilkent University, Department of Economics, 06533 Bilkent, Ankara, Turkey.
214 H. Akdogun / Systematic risk in an integrated model for stock prices Table 1
Market values of European equities at the end of 1980 in billions of U.S. dollars.
Countries included $ billions % Europe index % EC index
Belgium 10.0 0.022 0.025 Denmark 4.0 0.009 0.010 France 53.0 0.116 0.135 Germany 71.0 0.155 0.180 Netherlands 25.0 0.055 0.064 Italy 25.0 0.055 0.064 Spain 16.3 0.036 0.041 United Kingdom 190.0 0.415 0.481 EC total 394:3 0.863 1.000
Source: Financial Analysts Journal, several issues, and author’s own calculations
where r, is the U.S. dollar rate of return on market portfolio, rf is the risk-free rate of return expressed in the common currency. ’ ret stands for the nominal rate of return to the EC market portfolio.
ai = E( ret -rf> -PzE(ri-rf),
P, = cov( ri -
If,ret - rf//var( ret - rf > ,
where i is the index for the member state’s market portfolio, p is the sensitivity coefficient of the ith market to the composite market, ei is the national market specific residual. 2
The EC market portfolio is taken as a weighted average of national market returns. The weights are the shares of local markets in total EC market capitalization. The weighted average is calculated as follows:
r ec,t =
C
wiri,rwhere i = U.K., Germany, France, Netherlands, Belgium, Denmark, Italy, Spain, and w,‘s are the proportions of the member states’ equity market capitalization in total EC market capitalization. The proportions of the markets in sample are as follows: The U.K. 0.481, Germany 0.18, France 0.135, Netherlands, 0.064, Belgium 0.025, Denmark 0.01, Italy 0.064, and Spain 0.041 (see table 1).
The total risk is estimated by E((r, - rfj2 = P2E((r,, - r,12) = E(E*).
ui2 = p ‘cr,‘, + u,”
)where ui2, p2u~~, and ae2 are unsystematic risk, respectively.
3. Methodology and the data
(5)
the measures of the ith portfolio’s total risk, systematic risk, and
We partition the data and estimate the systematic risk for eight EC member states for each subperiod. We do not perform cross sectional risk premium estimates. Important legislation dates
’ One-month Treasury Bill rate in the U.K. is taken as risk-free rate.
’ Returns are calculated as (P, - P,_ ,)/P,_ 1 where P’s are IFC share prices (market portfolios). Dividends are excluded; thus, IFC share prices are taken as proxy for actual return.
H. Akdogan / Systematic risk in an integrated model for stock prices 215
Table 2
Cut-off years for data partitioning.
Year 1981 1983 19x5 10x7 1089 Remark
By this year capital controls were lifted over the British and German equity markets. The first comprehensive EC Directive to schedule the removals of all restrictions on capital. Cockfield’s ‘White Paper’
The Single European Act
Abolishment of most major capital restrictions in the EC markets in sample
for institutional integration in the Common Market are selected as data cut-off years. Some of these dates actually amount to true regime switches. Table 2 exhibits the selected cutoff years.
The data source is the International Financial Statistics published by the IMF which provides monthly share price indices of world stock exchanges. We exclude the stock markets of Ireland, Portugal, and Greece for which the data were not available. The data for Luxembourg were incomplete before 1980. Therefore, equity markets of these four EC member states are excluded from the sample. The risk-free rate is the one-month T-Bill rate in the U.K. The data were made available by the Morgan Bank of New York.
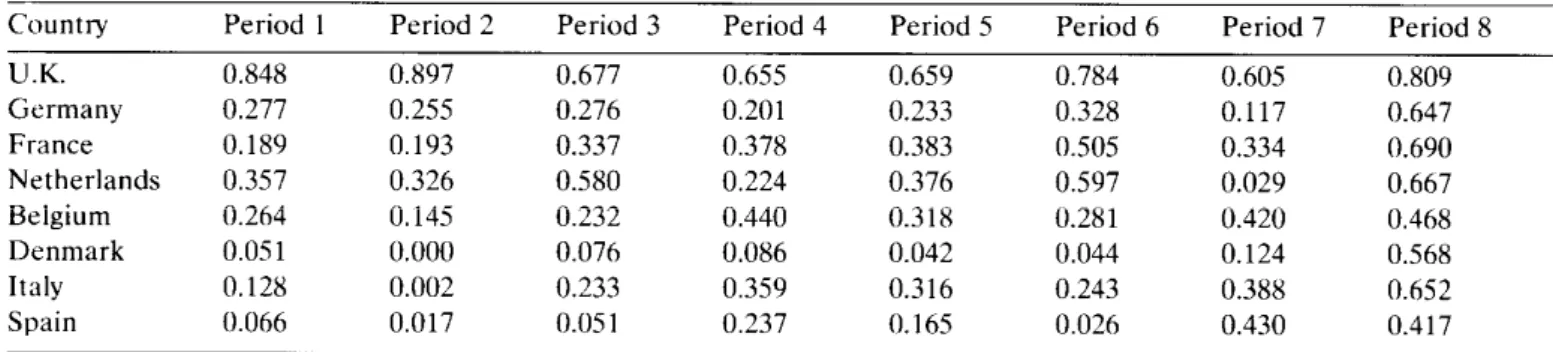
Table 3 reports the share of systematic risk of portfolio returns explained by the single EC composite market factor. The difference in percentage between the proportion of a given market’s systematic risk and the market’s share in total EC capitalization is a relevant measure of equity market integration in that any systematic risk proportion that exceeds market capitalization of a member state should imply integration.
Table 3 displays that for the most recent period, all market portfolios in the sample exhibit high proportions of systematic risk as explained by the single index EC composite model. The table also shows that the member states’ proportions of systematic risk in total risk are larger than their shares in total EC market capitalization. All markets seem to be integrated. What seems to be true as well is that each market’s proportion of systematic risk in total risk to its market capitalization share has increased over time in the entire decade of 1980s.
Table 3
Proportion of systematic risk of portfolio returns explained by single market factor. “,’
Country Period 1 Period 2 Period 3 Period 4 Period 5 Period 6 Period 7 Period 8
U.K. 0.848 0.897 0.677 0.655 0.659 0.784 0.605 0.809 Germany 0.277 0.255 0.276 0.201 0.233 0.328 0.117 0.647 France 0.189 0.193 0.337 0.378 0.383 0.505 0.334 0.690 Netherlands 0.357 0.326 0.580 0.224 0.376 0.597 0.029 0.667 Belgium 0.264 0.145 0.232 0.440 0.318 0.281 0.420 0.468 Denmark 0.051 0.000 0.076 0.086 0.042 0.044 0.124 0.568 Italy 0.128 0.002 0.233 0.359 0.316 0.243 0.388 0.652 Spain 0.066 0.017 0.05 1 0.237 0.165 0.026 0.430 0.417
“ Single market factor is the EC composite market return. Proportions reported are the share of systematic risk in total portfolio risk (i.e. p*a._$/a,‘). Proportions are rounded.
’ Period 1: 1972/l-1986/9; Period 2: 1978/7-1981/3; Period 3: 1981/4-1983/12; Period 4: 1984/l-1986/9; Period 5: 1981/4-1986/9; Period 6: 1983/4-1984/12; Period 7: 1985/l-1986/9; Period 8: 1989/10-1990/12.
216 H. Akdogan / Systematic risk in an integrated model for stock prices
4. Conclusion
The behavior of portfolio return systematic risk as explained by the single index model relative to market capitalization share supports an integrated market in the EC. Table 3 displays that the proportion of systematic risk in total risk exceeds the percentage of market capitalization in eight member states. Further, the proportion of portfolio systematic risk in total risk relative to the proportion of market capitalization has consistently increased. Even those members with marginal market capitalization shares have high systematic risk elements as explained by the integrated model.
References
Errunza, V. and E. Losq, 1985, International asset pricing under mild segmentation: Theory and test, Journal of Finance 40, March, 105-124.
Financial Analysts Journal, Several issues.
International financial statistics, supplement on price statistics (IMF Publications, Washington, DC).
Jorion, P. and E. Schwartz, 1986, Integration vs. segmentation in the Canadian stock market, Journal of Finance 41, May, 603-613.
Obstfeld, M., 1986, How integrated are world capital markets? Some new tests, Working paper no. 2075 (National Bureau of Economic Research, Cambrigde, MA) Nov.
Solnik, B., 1974, The international pricing of risk: An empirical investigation of the world capital market structure, Journal of Finance 29, May, 48-54.
Solnik, B., 1977, Testing international asset pricing: Some pessimistic views, Journal of Finance 32, 503-511.
Stehle, R., 1977, An empirical test of the alternative hypotheses of national and international pricing of risky assets, Journal of Finance 32, May, 493-502.
Stulz, R., 1981a, A model of international asset pricing, Journal of Financial Economics 9, Dec., 383-406. Stulz, R., 1981b, On the effects of barriers to international investment, Journal of Finance 36, Sept., 923-934. Wheatley, S., 1988, Some tests of international equity integration, Journal of Financial Economics 21, 177-212. World Financial Markets, Several issues (Morgan Guaranty Trust Company, New York).