Contents lists available atScienceDirect
International Journal of Psychophysiology
journal homepage:www.elsevier.com/locate/ijpsychoAge related di
fferences in the recognition of facial expression: Evidence from
EEG event-related brain oscillations
Tuba Aktürk
a,b, Ümmühan
İşoğlu-Alkaç
c, Lütfü Hano
ğlu
d,f, Bahar Güntekin
e,f,⁎aProgram of Electroneurophysiology, Vocational School, Istanbul Medipol University, Istanbul, Turkey
bProgram of Neuroscience Ph.D., Graduate School of Health Sciences, Istanbul Medipol University, Istanbul, Turkey cDepartment of Physiology, Faculty of Medicine, Istanbul University, Istanbul, Turkey
dDepartment of Neurology, School of Medicine, Istanbul Medipol University, Istanbul, Turkey eDepartment of Biophysics, School of Medicine, Istanbul Medipol University, Istanbul, Turkey
fNeuroimaging and Neuromodulation Lab, Clinical Electrophysiology, REMER, Istanbul Medipol University, Istanbul, Turkey
A R T I C L E I N F O Keywords: Aging Facial expression EEG Event-related oscillation Delta Theta A B S T R A C T
Facial Expression (FE) recognition is a major marker of emotional ability. Behavioral studies show that FE recognition ability decreases with aging. Studying how event-related brain oscillations change with normal aging is important to better understand the underlying mechanisms of emotional processes. The aim of this study is to investigate changes in FE recognition due to normal aging using the EEG-Brain Oscillations approach.
Fifteen young andfifteen elderly healthy subjects were included in the study. 15 photographs were used with 5 different FEs (angry, happy, neutral, sad, fearful). After each EEG recording session, subjects were asked to identify the FEs that were presented. Event-related delta, theta and, alpha phase-locking and frequency-band responses were analyzed.
In the FE recognition part of the study, young subjects obtained better scores than the elderly subjects. There was a significant result regarding the locationXgroup comparison in the delta response; the young group had a higher delta response than the elderly group over the occipital area. There were significant locationXgroup differences in the theta and alpha phase locking values; the elderly group had higher theta and alpha phase locking values than the young group in the frontal area. Group differences were significant in the theta response and theta phase locking; the elderly individuals' theta response and phase locking values were higher compared to those of the young individuals.
In elderly individuals, FE recognition impairment has been observed. It has been shown that the impairment may be characterized by decreased occipital delta responses and phase locking. This can be interpreted to mean that elderly individuals may have developed different brain dynamics as a compensating mechanism since they are not as efficient as young individuals in performing these functions.
1. Introduction
Facial expressions (FE) are one of the ways in which we commu-nicate that gives us faster and more accurate information about the people with whom we interact. The ability to recognize emotions from FE is a very important social skill that allows us to recognize emotional states based on non-verbal signs (Scherer and Scherer, 2011). This makes FE recognition indispensable for social interaction. Neu-ropsychological tests show that this ability is affected negatively by pathologies such as autism spectrum disorders (Dawson et al., 2005; Monteiro et al., 2017;Ghanouni and Zwicker, 2018), Alzheimer's dis-ease (Lavenu et al., 1999;Hargrave et al., 2002;McLellan et al., 2008;
Carvalho et al., 2014), schizophrenia, (Gaebel and Wölwer, 1992; Edwards et al., 2002;Lee et al., 2010) etc. The ability of FE recognition also changes with brain development and declines with aging (Ruffman et al., 2008). These results are explained by researchers in terms of a Theory of Mind (ToM) that emphasizes the ability of understanding others' emotions and mental states; in light of this, it can be said that FE recognition is a fundamental marker of emotional abilities.
Ekman and Friesen (1971) suggest that six basic emotions' FEs (anger, happiness, fear, surprise, disgust, and sadness) can be easily recognized in all cultures. These six basic FEs are universal and people from different cultures give quite consistent answers when these FEs are evaluated. Darwin's theory of emotions supports the idea that at least
https://doi.org/10.1016/j.ijpsycho.2019.11.013
Received 11 June 2019; Received in revised form 4 November 2019; Accepted 27 November 2019
⁎Corresponding author at: Department of Biophysics, International School of Medicine, Istanbul Medipol University, Istanbul, Turkey. E-mail address:[email protected](B. Güntekin).
International Journal of Psychophysiology 147 (2020) 244–256
Available online 17 December 2019
0167-8760/ © 2019 Elsevier B.V. All rights reserved.
some of the emotional expressions can be perceived by all individuals, irrespective of their culture or geographical location (Darwin and Prodger, 1998;Hess and Thibault, 2009;Absher and Cloutier, 2016).
There are several important areas in the human brain that are im-portant for the recognition of faces and FEs. The fusiform face area (FFA) is the area that is most known in this context (Kanwisher et al., 1997). Many studies about FFA show that this region is activated when human faces are shown. Furthermore, it is found that when images such as objects, scenes and animal pictures are shown, FFA is not activated as much as when human faces are displayed; which supports the conclu-sion that FFA is a brain region specialized for facial recognition (McCarthy et al., 1997; Kanwisher et al., 1997, 1999; Grill-Spector et al., 2004). Although FFA is known to be an important area for facial recognition, it is also known that FFA is not the only area that is im-portant. The occipital face area (OFA), localized in the inferior occipital gyrus, is also sensitive to faces, although the specific role of OFAs for facial recognition is not yet well understood (Rotshtein et al., 2005; Steeves et al., 2006;Pitcher et al., 2007;Hemond et al., 2007;Pitcher et al., 2011). Another face processing area is known as the superior temporal sulcus (STS). Initial studies examining STS have been carried out on primates and single-cell recording studies. These studies suggest that there are “face-sensitive neurons” in STS. These studies have shown that STS is sensitive to FEs and eye movements, rather than identity cues (Desimone, 1991;Heywood and Cowey, 1992). In addi-tion, it has been shown that this area is important not only for the interpretation of the expression, face, and eye movements but also in social perception and theory of mind in general (Allison et al., 2000; Hein and Knight, 2008). Although three areas of FE processing are mentioned above, there is actually a large neural network related to FE processing. The amygdala is located in the area that takes projections from many regions of the brain. This makes the amygdala intensively linked to the area in which the information is integrated (Adolphs et al., 1994;Adolphs, 2002, 2003). It is discussed that OFA, FFA, amygdala, and STS together comprise an intensively interconnected network that determines human perception. Since the amygdala is tightly and re-ciprocally linked to STS and OFA, which are directly connected to each other, these three structures are ideal for the transfer and integration of social information (Kanwisher et al., 1997; Kanwisher et al., 1999; Haxby et al., 2000, 2002). These brain regions and their connections are structurally abnormal in the autistic population, and this also shows their critical role in the impairment of social perceptions (Salmond et al., 2003). The normal brain seems to have the functional archi-tecture that is necessary to collect visual information from FEs, in-tegrate them, assess their social significance, and act accordingly (Albohn and Adams, 2016).
Mental functions attributed to the prefrontal brain area, like memory performance and problem-solving ability decline with age. Age-related decline in mental abilities is highly variable. While the cognitive decline is fast in some elderly people, some others are capable of maintaining their cognitive skills throughout life (Sanes and Jessell, 2013). The latter is addressed as “super-agers” in the literature, meaning that they have no cognitive decline with increasing age. The mechanism underlying this diversity in mental decline that comes with aging is not yet known.
There are several theories about the mechanisms of cognitive de-cline in aging. These theories are based on four main results found in the literature and are as follows: over-activation, de-differentiation, frontal compensation and abnormality in switching from the default mode network (DMN) (Ziaei and Fischer, 2016). Elderly people elicit higher activation than younger people in some brain regions during cognitive tasks, and this phenomenon is called“over-activation”. It is thought that over-activation might reflect the compensatory mechan-isms that are used by successful older adults who have relatively higher cognitive abilities and might be using different neural networks com-pared to younger adults (Cabeza et al., 2002;Bergerbest et al., 2009; Grady, 2012).“De-differentiation” refers to a decrease in the regional
specialization or the specificity in a certain region (Li et al., 2001). It is a commonfinding that over-activation occurs at the prefrontal area in elderly people during cognitive and emotional tasks and this is called “frontal compensation”. Aging is associated with decreased cortical thickness, white matter integrity, dopaminergic activity and functional contribution in the posterior areas such as the hippocampus and occi-pital regions, whereas there are compensatory increases in the frontal functional contribution which are associated with better behavioral performance in elderly adults (Goh and Park, 2009). EEG research also shows an increase of alpha and theta responses in the frontal area with aging (Başar et al., 1997;Yordanova et al., 1998;Kolev et al., 2002; Başar, 2012).Başar et al. (1997)emphasizes that spontaneous alpha activity, alpha response amplitude and alpha phase locking values are higher over frontal regions in elderly people compared to younger people. Yordanova et al. (1998)also report results similar to Basar's research, interpreting that differentiations that accompany aging could serve to maintain brain functionality. Additionally, short distance intra-hemispheric coherence is higher in elderly people than in young people engaged in cognitive tasks, according toMaurits et al. (2006). Taken all together, these EEGfindings show that event-related EEG analyses are sensitive to age-related cognitive changes. The activation of more anterior regions, such as the prefrontal cortex, is accompanied by de-activation of the posterior regions, such as the ventral visual cortex and the medial temporal lobe. This pattern, which is thought to reflect the compensatory mechanisms of increasing age, is also called the pos-terior-anterior shift in aging (PASA) (Davis et al., 2008).
There are a number of theories about the aging brain that have been established from thefindings mentioned above. One of these theories is the“inhibitory deficit hypothesis”. This hypothesis suggests that defi-ciency of inhibition control is the underlying reason for many aging-related losses. Some researches show that specific deficiencies in in-hibition control can cause impaired working memory in elderly people (Hasher and Zacks, 1988; Von Hippel and Dunlop, 2005). Another theory called the“Compensation Related Utilization of Neural Circuits Hypothesis (CRUNCH)” suggests that when task demand is low, elderly people show more activation (especially in frontal and bilateral brain areas) whereas young people show more focal activation in task-related brain areas. Elderly people reach the limits of their resources with in-creasing task demand. Therefore, they could exhibit cognitive decline even if they show more activation when compared to young people. For this reason, neural compensation is thought to be more effective when task difficulties are low (Reuter-Lorenz and Lustig, 2005;Reuter-Lorenz and Park, 2010). One of the most well-known theories is the “Scaf-folding Theory of Aging and Cognition (STAC model)”. The STAC model suggests that, despite changes in the brain with aging, all systems re-main functional and attempt to establish alternative neural circuits. Despite structural and functional changes, alternative neuronal circuits (Scaffold) help to maintain cognitive functioning at higher levels, al-though this mechanism may still work less effectively (Park and Reuter-Lorenz, 2009). These theories should not be evaluated separately and can be considered together to obtain a holistic approach.
Like cognitive abilities, emotional abilities also change with aging. This alteration is not independent from the general changes in the brain that come with the aging mentioned above. In the aging process, there is a deficiency in the recognition of negative emotions such as sadness, anger, and fear (Sullivan and Ruffman, 2004; Ruffman et al., 2008, 2009). This deficiency might be closely related to the neurobiological changes that occur with aging. Many studies support a preference for positive matters (compared to negative ones) in cognitive processing in the elderly. This is known as the “positive effect (PE)” (Reed and Carstensen, 2012). When compared to younger people, elderly adults can remember positive information better than negative information and pay more attention to positives than negatives. Despite the in-creasing number of studies supporting PE, the underlying mechanisms of this effect remain uncertain. This tendency towards positive emo-tions might have a useful role in healthy aging (Ziaei and Fischer,
2016). There are some theories in the literature that explain the un-derlying mechanism of the positive effect. Socioemotional Selectivity Theory (SST) is the most dominant theory of emotional and social aging. SST assumes that as people become older and their time begins to be perceived as limited, their motivational orientation begins to change. The perception of limited time affects their motivational pre-ferences and prioritization of emotional goals. This situation alters the priority of one's life and goals become more human-oriented rather than future-oriented since people think that they have limited time left (Carstensen, 2006;Charles and Carstensen, 2010). As a result of moti-vational changes that come with aging, positive emotions receive priority, and older adults reorganize their resources to reach positive feelings and reduce negative ones. According to this assumption, longitudinal studies provide evidence that the level of well-being in-creases with aging (Carstensen et al., 2011). According to social neu-roscience, people's social behaviors are executed biologically. The Aging-brain model (ABM), derived from social neuroscience, describes the link between emotional processing and changes in age-related brain functions (Cacioppo et al., 2011). For a long time, cognitive aging and emotional aging were considered to be two separate structures, but the ABM ensures a considerable link between these two approaches.Mather et al.'s (2004) study is interpreted byZiaei and Fischer (2016) from both SST and ABM perspectives. In this study, researchers showed the positive, neutral and negative photographs to both young and elderly groups during functional magnetic resonance imaging (fMRI). The re-sults of the study show that elderly people elicit increased activation of the amygdala in response to positive stimuli (compared to the nega-tives) while there is no significant difference in amygdala activation in young individuals. The ABM has interpreted these results as the re-duction of amygdala activity in negative items due to low arousal. Several studies show that changes in the function of the amygdala have an effect on the perception of the level of arousal of the emotion. In addition, a reduced level of alteration in negative emotions may be associated with increased well-being in older adults. For this reason, both the SST and the ABM predict that amygdala activation might be smaller for negative stimuli than positive stimuli in elderly adults (Carstensen et al., 2003;Berntson et al., 2007).Ziaei and Fischer (2016) suggest that these changes in amygdala responses can partially explain the age-related PE. Another model for reconciling the emotional and social aspects of aging is the selective optimization with compensation (SSC) model. This model suggests that with aging, people become aware of what they have lost in adulthood and what they have earned. They choose goals that are important or can be achieved realistically because of the expectedly declining resources that come with aging. Hence, less important targets might be sacrificed at the expense of achieving more important goals. In each case, the selection, optimiza-tion, and individualization of the compensation are in question (Marsiske et al., 1995;Charles and Carstensen, 2010;Ziaei and Fischer, 2016). Great numbers of models and hypotheses have been offered to explain the underlying mechanisms of the aging-related changes in the emotional process, such as the above-mentioned SST, ABM and SSC models.
It is widely known that delta, theta and alpha frequencies are im-portant for emotional processes. Studies show that brain oscillations in different frequency bands reflect emotional processing (Mitchell et al., 2008;Moita et al., 2003;Paré, 2003;Paré and Collins, 2000;Sainsbury and Montoya, 1984;Seidenbecher et al., 2003; Aftanas et al., 2001, 2004;Başar et al., 2006, 2008;Güntekin and Basar, 2007;Kamarajan et al., 2008; Knyazev and Slobodskoj-Plusnin, 2007; Knyazev et al., 2008, 2009;Krause et al., 2000;Nishitani, 2003). However, these are distributed over the scalp in different frequency bands. It is also known that these three frequency bands are sensitive to FEs (Başar et al., 2006; Güntekin and Basar, 2007;Knyazev, 2007;Knyazev et al., 2009;Ertl et al., 2013;Güntekin and Başar, 2014;Herman, 2017). Delta oscilla-tion has an important role in the motivaoscilla-tional part of emooscilla-tional pro-cesses. Moreover, occipital delta response is associated with the
perception of complex visual stimuli (Güntekin and Basar, 2007; Güntekin and Başar, 2014;Güntekin and Başar, 2016). Theta frequency has an important role in emotion regulation (Alper, 1999;Alper et al., 2006;Knyazev, 2007;Knyazev et al., 2009).Güntekin and Basar (2007) showed that posterior alpha and occipital theta activities/frequencies are important for the perception of FEs.Herman's (2017) study also showed that theta activity is related to the memory of facial emotion. Some studies suggest that alpha activity/frequency interacts with low-frequency bands for emotional processing (Robinson, 1999, 2000; Knyazev and Slobodskaya, 2003; Knyazev, 2007). Considering these results, it can be said that delta, theta, and alpha frequency bands are assigned to different parts of emotional processing.
Emotion could affect cognitive functions such as memory, attention, recognition of FE. It is known that changing emotional mechanisms with aging interact with cognitive components such as attention (Pessoa et al., 2002) and memory (Charles et al., 2003).
The purpose of this study is to investigate the effect of age on the process of FE perception through EEG event-related oscillatory re-sponses and to construct a related electrophysiological model in ac-cordance with the analyses.
Our general hypothesis is that the effect of aging on FE perception is reflected in event-related oscillations and elderly people will show an over-activation in anterior areas, and decreased response in the occi-pital area in comparison with young individuals. Within the scope of this general hypothesis, our specific hypotheses are as follows; (I) The healthy elderly group will have less delta response in occipital locations than the healthy young group, (II) The healthy elderly group will have higher theta and alpha responses in anterior locations than the healthy young group. Furthermore, we expect that the facial recognition per-formance of healthy elderly people will be lower than the healthy young group.
2. Materials and methods 2.1. Subject
Fifteen healthy young subjects (7 female and 8 male) and 15 healthy elderly subjects (6 female and 9 male) with no neurological or psy-chiatric diseases, and all right-handed were included in the study. The elderly subjects' ages ranged from 55 to 76, with an average age of 62. The young subjects' ages ranged from 20 to 29, with an average age of 24. The Beck Depression Inventory was used in the young subjects and the Geriatric Depression Scale was used in the elderly subjects, in order to eliminate subjects with depression. Mini Mental State Examination (MMSE) was used in the elderly group to exclude subjects with a mental impairment. The demographic information of the groups is presented in Table 1. The ethical committee of Istanbul Medipol University (No: 10840098-604.01.01-E.9552) approved the study. All subjects gave written informed consent in accordance with the Helsinki Declaration. Inclusion criteria for both groups were as follows: not being diag-nosed with any psychiatric or neurological disease, not using any psy-chiatric or neurological medication, a minimum of primary school education (at least 5 years), not being depressed according to the ap-plied depression scales, never having seen the photographs used as stimulants in the experimental setup. An additional criterion for the Table 1
The demographic information of groups.
Gender Age Education (year)
F M Avg. (SD) Avg. (SD)
Healthy young (N = 15) 7 8 24 ( ± 2.77) 17.93 ( ± 2.5) Healthy elderly (N = 15) 9 6 62.07 ( ± 6.01) 9.4 ( ± 4.27) F: female, M: male, Avg: average, SD: standard deviation.
healthy elderly group was scoring higher than 25 in the MMSE. An a priori power analysis was performed for sample size estimation using G*Power 3.1 (Faul et al., 2009). The effect size in this study was 0.22, considered to be a small effect usingCohen's (1988)criteria and alpha was 0.05. The result showed that a total sample of 30 subjects with two equal-sized groups of n = 15 was required to achieve a power of 0.85.
2.2. Experimental design and procedure
Fifteen photographs from the Ekman's (1976) Pictures of Facial Affect were selected and presented as the stimuli. These fifteen photo-graphs consisted of 5 different FEs (angry, happy, neutral, afraid, sad) with 3 different person's faces showing each expression. Accordingly, there werefive separate EEG recording sessions in the experiment for presenting each facial expression. Each FE was represented in one session during EEG recording (angry, happy, neutral, afraid, sad; re-spectively). Within each session, a total of 60 photographs with the same expression were presented; thus, the 3 different person's faces with the same expression, appear 20 times in a single session. The pictures were presented in black and white (17 × 17 cm) and displayed on a 19-inch computer monitor with a refresh rate of 60 Hz, at a dis-tance of 120 cm from the subjects. Stimulus duration was set to 1000 ms with intervals randomly varying between 3 and 7 s.
There are several procedures described in the literature about FE recognition assessment through which the FE recognition scores of the subjects were obtained (Bowers et al., 1993;Rosen et al., 2006; Klein-Koerkamp et al., 2012;Hot et al., 2013). The procedure used in this study for FE recognition scoring was“naming”, which, in the literature is generally considered as a measurement of subjects' free recall abil-ities. After each EEG recording session within which a single expression was presented, the subjects were asked to name the FE they were pre-sented with during that last session. As previously mentioned, 60 sti-muli (20 × 3 different faces) with the same FE were presented in each session. Consequently, in the recognition part subjects were asked to name the FE in these 3 different photos. There was no time limit during the naming process. Subjects received 2 points for correct naming for each face. If the subject was not able to name the FE on the photo by themselves, a forced choice, during which the experimenter read the names of the possible FEs out loud to the subject, was applied, and the subject was asked to pick one of them. If they could correctly name the FE after“forced choice”, they received 1 point. If they could not name the FE in either condition, they received 0 points. Thus, a subject could receive a maximum of 6 points (3 faces × 2 points) if all FEs presented during one session were correctly recognized at first. The same ex-perimental design and procedure were applied in our previous study (Güntekin et al., 2019).
2.3. EEG recording
EEG was recorded from Fp1, Fp2, F7, F3, Fz, F4, F8, Ft7, Fc3, Fcz, Fc4, Ft8, Cz, C3, C4, T7, T8, Tp7, Cp3, Cpz, Cp4, Tp8, P3, Pz, P4, P7, P8, O1, Oz and O2 locations with 30 Ag/AgCl electrodes mounted in an elastic cap (Easy-cap) according to the international 10–20 system. Additionally, two linked earlobe electrodes (A1 + A2) served as refer-ences. The EOG from the medial upper and lateral orbital rim of the right eye was also registered. For the reference electrodes and EOG recordings, Ag/AgCl electrodes were used. All electrode impedances were < 10 kΩ. The EEG was amplified by means of a Brain Amp MR plus 32-channel DC system machine with band limits of 0.01–250 Hz. The EEG was digitized online with a sampling rate of 500 Hz. The subjects sat in a dimly lit, isolated room during recordings.
2.4. EEG data analysis
In this study, two different analyses (frequency-band response
analysis and phase locking analysis) were used over event-related os-cillations (EROs). Fourteen (f3, f4, c3, c4, t7, t8, tp7, tp8, p3, p4, p7, p8, o1, o2) electrodes were used for the analysis since these electrodes represent all brain regions allowing for the observation of significant differences between groups and paradigms.
All analyses were calculated separately forfive different sessions wherefive different FEs were given. The EEG data were divided into epochs (2 s in length, 1 s before and 1 s after the stimulus) for analysis. Before the analysis process, artifacts that were present in the epochs were eliminated manually and offline. A special notch filter was used to clean the 50 Hz city network noise. Any baseline correction method was not applied to the oscillatory data since the analyses that we have used in this study have no need to apply baseline correction. (Herrmann et al., 2005;Hu et al., 2014;Gross, 2014).
2.4.1. Frequency-band response analysis
Each subject's preprocessed data (segmented and artifact-free) were averaged for each FE condition. Over each subject's averaged event-related potentials, digitalfilters were applied in the delta (0.5–3.5 Hz), theta (4–7 Hz) and alpha (8–13 Hz) frequency bands. Digital filters were run in the Brain-Vision Analyzer (BVA) program using Infinite Impulse Response (IIR) filters - zero phase shift Butterworth filters. For the Table 2 FE recognition scores. Healthy elderly (n = 15) Healthy young (n = 15) p Value Avg. (SD) Avg. (SD) Neutral 2.13 ( ± 1.96) 5.07 ( ± 1.63) 0.001* Fearful 4.27 ( ± 1.22) 5.33 ( ± 1.23) 0.016* Sad 4.67 ( ± 1.45) 5.73 ( ± 0.70) 0.029* Happy 5.27 ( ± 1.28) 5.93 ( ± 0.26) 0.202 Angry 5.07 ( ± 1.28) 5.13 ( ± 1.19) 0.870
Total FE recognition score 21.41/30 27.19/30
Avg. = average, SD = standard deviation. Asterisks (*) represents p < .05.
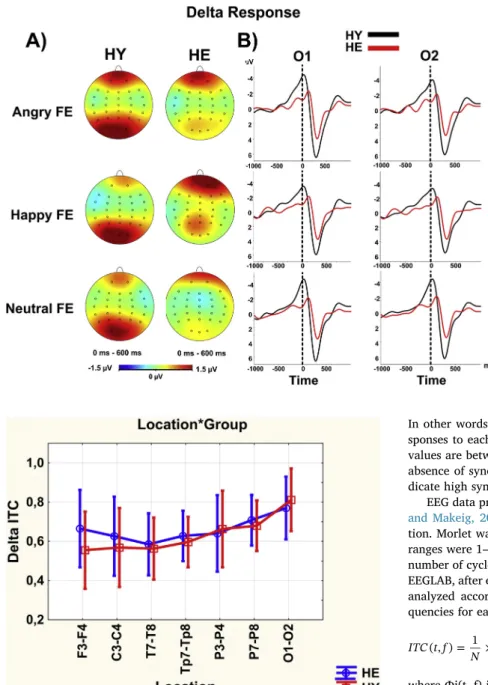
Fig. 1. The mean values of delta responses (peak-to-peak amplitude) at seven different locations for the healthy elderly (blue line) and healthy young (red line) group. F3-F4: frontal, C3-C4: central, T7-T8: temporal, Tp7-Tp8: temporo-parietal, P3-P4: parietal-1, P7-P8: parietal-2, O1-O2: occipital. HE: healthy el-derly, HY: healthy young. The vertical bars denote 0.95 confidence intervals. The locationXgroup interaction was significant (F(df =6, 168) = 3.855, p = 0.032,η_p^2 = 0.121). The healthy young group had higher delta response than the healthy elderly group in occipital locations (p < 0.001). (For inter-pretation of the references to color in thisfigure legend, the reader is referred to the web version of this article.)
analysis, the highest amplitude of the responses after the stimulus was determined and recorded for statistical analysis by measuring the peak to peak micro voltage (μV). The time window was between 0 and 600 ms for delta, 0–500 ms for theta, and 0–400 ms for alpha. These measurements were performed with the“Delta tool” in the Brain-Vision Analyzer program.
2.4.2. Event-related inter trial coherence (ITC) analysis (phase locking analysis)
The phase-locking analysis is a measure of the consistency of the instantaneous phase at each frequency and time point during the trials.
In other words, the phase-locking analysis measures how well the re-sponses to each trial are synchronized with each other. Phase locking values are between 0 and 1. Phase locking values near 0 represent the absence of synchronization between trials, while values close to 1 in-dicate high synchronization.
EEG data preprocessed in BVA were uploaded to EEGLAB (Delorme and Makeig, 2004). ITC analysis was conducted by wavelet convolu-tion. Morlet wavelet was used for the wavelet convoluconvolu-tion. Frequency ranges were 1–3 Hz for delta, 4–7 Hz for theta, 8–13 Hz for alpha. The number of cycles for wavelets was 3 for each three frequency range. In EEGLAB, after entering the analysis-related parameters, each group was analyzed according to the following formula for three different fre-quencies for each FE.
∑
⎜ ⎟∑
= × ⎛ ⎝ ⎞ ⎠ = × ITC t f N W t f W t f N exp iφ t f ( , ) 1 ( , ) | ( , )| 1 ( ( , )) j j j j jwhereФj(t, f) is the phase of the wavelet at time t and frequency f. The results were converted to numerical values using the MATLAB script for statistical analysis. Different time windows were used to evaluate maximal phase-locking values for each frequency range (0–600 ms for delta, 0–500 ms for theta, and 0–400 ms for alpha).
Analysis of low frequency bands by means of wavelet analysis re-quired a long time length. For this reason, the EEG recordings were divided into epochs 3 s before and 3 s after the stimulus for the delta frequency band.
2.5. Statistical analysis
“Repeated Measures ANOVA” analysis was performed with SPSS 22 and Statistica programs. In the statistical analysis, Repeated Measures ANOVA were examined for between-group (group: healthy elderly, healthy young) and within-group factors (hemisphere: right, left; lo-cation: frontal, central, temporal, temporoparietal, parietal 1, parietal 2, occipital; face: angry, happy, neutral, sad, fearful). p-Values cor-rected by Greenhouse-Geisser correction were reported. Following the analysis, appropriate Post Hoc tests were applied (Bonferroni). A total of six ANOVAs were performed for three different frequency bands (delta, theta, and alpha) in each of the 2 different EEG analysis methods (frequency-band response analysis, phase locking analysis).
Fig. 2. A) Topographic maps of the grand averages of the delta responses (peak-to-peak amplitude) upon applica-tion of angry (top), happy (middle) and, neutral (bottom) facial expression (FE) stimulation for healthy young (HY; first column) and healthy elderly (HE; second column). The healthy young group had higher delta response than the healthy elderly group in parieto-occipital areas. There was a slight difference between FEs (angry, happy > neural) for both groups but it was not statistically sig-nificant (p > 0.05). B) Line plots of the grand averages of the delta responses upon application of angry (top), happy (middle) and, neutral (bottom) FE stimulation at occipital locations (O1–O2) for healthy young (HY; black line) and healthy elderly (HE; red line). The healthy young group had higher delta response than the healthy elderly group in occipital areas regardless of FEs. Plus and minus signs represent the polarity of the signal for both line plots and topographic maps. The intensity of the colors represents the greatness of the amplitude for to-pographic maps. (For interpretation of the references to color in thisfigure legend, the reader is referred to the web version of this article.)
Fig. 3. The mean values of delta phase locking values at seven different loca-tions for healthy elderly (blue line) and healthy young (red line) group. F3-F4: frontal, C3-C4: central, T7-T8: temporal, Tp7-Tp8: temporo-parietal, P3-P4: parietal-1, P7-P8: parietal-2, O1-O2: occipital. HE: healthy elderly, HY: healthy young. The vertical bars denote 0.95 confidence intervals. The locationXgroup interaction was significant (F(df =6, 168) = 3.646, p = 0.014,η_p^2 = 0.115). The elderly group's phase locking value was higher than that of the young group at the frontal location (p < 0.05). (For interpretation of the references to color in thisfigure legend, the reader is referred to the web version of this article.)
The Non-Parametric Mann Whitney-U test was used to test the significance of the difference between the groups' FE recognition scores. The significance level for the comparisons was fixed at p < 0.05. 3. Results
3.1. Behavioral results/FE recognition scores
A subject could receive a maximum of“6” points if all FEs presented during one session were correctly named or chosen. For each of the block series of photographs in whichfive different FEs (angry, happy, neutral, fearful, sad) were presented, the young group's FE recognition scores were higher than the elderly group for all FEs, as presented in Table 2. This difference was statistically significant at p < 0.05 for neutral, fearful and sad FEs (Table 2).
3.2. Delta frequency 3.2.1. Delta response analysis
The main effect of group was not statistically significant. (F(df =1, 28) = 1.399, p = 0.247,η_p^2 = 0.048).
The locationXgroup difference was significant (F(df =6, 168) = 3.855, p = 0.032,η_p^2 = 0.121). Post Hoc analysis showed that the young group's delta response amplitude (M: 11.07μV, SE: 1.18) was greater than the elderly group's delta response amplitude (M: 8.07μV, SE: 1.18) in the occipital area (p < 0.001) (Figs. 1, 2). The different FEs (sad, happy, angry, fearful, neutral) had no effect on the delta re-sponse (p > 0.05).
3.2.2. Delta phase locking analysis
The main effect of group was not statistically significant (F(df =1, 28) = 0.899, p = 0.351,η_p^2 = 0.031).
The locationXgroup difference was significant (F(df =6, 168) = 3.646, p = 0.014,η_p^2 = 0.115). As could be seen inFig. 3, Post Hoc analysis showed that the elderly group's phase locking value (M: 0.66, SE: 0.03) was higher than that of the young group (M: 0.55, SE: 0.03) at the frontal location (p < 0.05) (Fig. 3). But that the young group's phase locking value (M: 0.81, SE: 0.02) was higher than that of the elderly group (M: 0.77, SE: 0.02) at the occipital location, even it was not a statistically significant difference between groups (p > 0.05) (Fig. 4). Delta phase locking values were not significantly affected by changes in the type of FEs (p > 0.05).
3.3. Theta frequency 3.3.1. Theta response analysis
Between-subject effect was significant (F(df =1, 28) = 4.702, p = 0.039, η_p^2 = 0.114). Post Hoc analysis showed that the older group (M: 5.32 μV, SE: 0.35) had a higher theta response than the younger group (M: 4.23μV, SE: 0.35) (p < 0.05).
The locationXgroup difference was marginal significant (F(df =6, 168) = 2.883, p = 0.056,η_p^2 = 0.093). Post Hoc analysis showed that the healthy elderly group (M: 7.28 μV, SE: 0.47) had a higher theta response than the healthy young group (M: 4.62μV, SE: 0.47) in the frontal locations (p < 0.05) and again, the healthy elderly group (M: 6.94μV, SE: 0.9) had a higher theta response than the healthy young group (M: 4.9μV, SE: 0.9) in occipital locations (p < 0.05) (Fig. 5). FE difference also had a clear tendency to significance (F(df =4, 112) = 2.490, p = 0.058,η_p^2 = 0.082). Accordingly, theta response amplitudes in response to the angry (M: 4.96μV, SE: 0.3), happy (M: Fig. 4. A) The grand average of delta phase locking va-lues upon application of angry FE stimulation over occi-pital locations for healthy elderly and healthy young subjects. The X axis represents time and the Y axis re-presents frequency; the point at which the stimulus ar-rives is marked as a zero point on the X axis. O1-O2: Occipital. The young group's phase locking value was higher than that of the elderly group at the occipital lo-cation, even it was not a statistically significant differ-ence between groups (p > 0.05). B) The thick black line indicates the average of single segments, and the thin gray lines show every single segment upon application of angry FE simulation at occipital locations for the single subject (first column: an elderly healthy subject; second column: a healthy young subject). In thisfigure, the delta phase locked response could be seen clearly for the healthy young subject but not for the healthy elderly subject at the occipital locations.
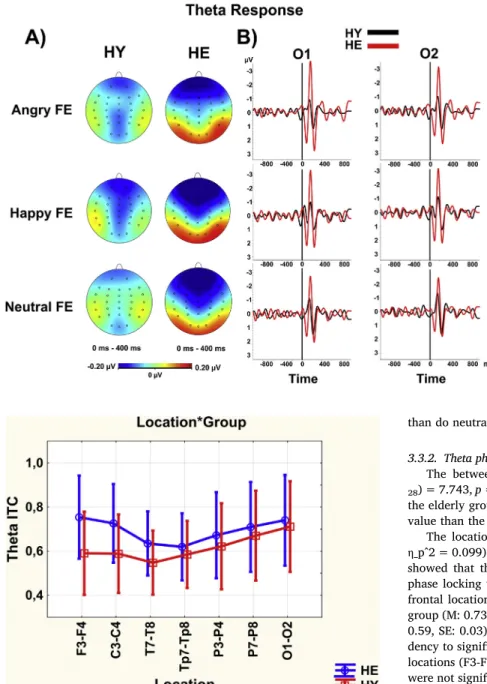
Fig. 5. The mean values of theta responses (peak-to-peak amplitude) at seven different locations for healthy elderly (blue line) and healthy young (red line) group. F3-F4: frontal, C3-C4: central, T7-T8: temporal, Tp7-Tp8: temporo-par-ietal, P3-P4: parietal-1, P7-P8: parietal-2, O1-O2: Occipital. HE: healthy elderly, HY: healthy young. The vertical bars denote 0.95 confidence intervals. The locationXgroup interaction was marginally significant (F(df =6, 168) = 2.883, p = 0.056,η_p^2 = 0.093). The healthy elderly group had a higher theta re-sponse than the healthy young group in the frontal (p < 0.05) and the occipital locations (p < 0.05). (For interpretation of the references to color in thisfigure legend, the reader is referred to the web version of this article.)
4.98μV, SE: 0.25), fearful (M: 4.78 μV, SE: 0.28) and sad (M: 4.66 μV, SE: 0.3) FE stimuli were higher than that in the response to neutral (M: 4.49 μV, SE: 0.24) expressions. Post Hoc analysis showed that theta response amplitudes, only in response to the angry and happy FE sti-muli were higher than that in the response to the neutral expressions, statistically (for both comparisons; p < 0.05).
Fig. 6shows the grand averages of the theta response, which are released after the stimulus and changes between the two groups. Also, thefigure shows that angry and happy FEs' elicit higher theta responses
than do neutral FEs.
3.3.2. Theta phase locking analysis
The between-subject effect was statistically significant (F(df =1, 28) = 7.743, p = 0.010,η_p^2 = 0.217). According to Post Hoc analysis, the elderly group (M: 0.69, SE: 0.02) had a higher theta phase locking value than the younger group (M: 0.62, SE: 0.02) (p < 0.01).
The locationXgroup difference (F(df =6, 168) = 3.087, p = 0.031, η_p^2 = 0.099) was statistically significant (Fig. 7). Post Hoc analysis showed that the elderly group (M: 0.75, SE: 0.03) had higher theta phase locking value than the young group (M: 0.59, SE: 0.03) in the frontal locations (p < 0.01). Also, the difference between the elderly group (M: 0.73, SE: 0.03) phase locking value and the young group (M: 0.59, SE: 0.03) phase locking value in the central locations had a ten-dency to significance (p = 0.07). InFig. 8, phase locking in the frontal locations (F3-F4) is shown for both groups. Theta phase locking values were not significantly affected by the type of FE presented (p > 0.05). 3.4. Alpha frequency
3.4.1. Alpha response analysis
The main effect of group was not statistically significant (F(df =1, 28) = 0.719, p = 0.404,η_p^2 = 0.025).
There was no statistically significant locationXgroup difference, but there was a marginal trend (F(df =6, 168) = 2.457, p = 0.093, η_p^2 = 0.081). Nevertheless, as can be seen inFig. 9, the elderly group had a higher alpha response than the young group especially in the frontal (elderly group: M: 6.21μV, SE: 0.38; young group: M: 4.07 μV, SE: 0.38) and central locations (elderly group: M: 5.26μV, SE: 0.46; young group: M: 4.06μV, SE: 0.46).Fig. 10shows the grand average results of how the alpha responses change in three different locations for the two groups as supported by the statistic results. Alpha responses were not significantly affected by the type of FE presented (p > 0.05). 3.4.2. Alpha phase locking analysis
The main effect of group was not statistically significant (F(df =1, 28) = 2.359, p = 0.136,η_p^2 = 0.078).
The locationXgroup difference was statistically significant (F(df =6, 168) = 4.329, p = 0.006,η_p^2 = 0.134). Post Hoc analysis showed that Fig. 6. A) Topographic maps of the grand averages of the theta responses (peak-to-peak amplitude) upon applica-tion of angry (top), happy (middle) and, neutral (bottom) facial expression (FE) stimulation for healthy young (HY; first column) and healthy elderly (HE; second column). The healthy elderly group had greater theta response than the healthy young group in frontal and occipital areas. There was a slight difference between FEs (happy, angry > neutral), especially in the elderly group. B) Line plots of the grand averages of the theta responses upon application of angry (top), happy (middle) and, neutral (bottom) FE stimulation at occipital locations (O1-O2) for healthy young (HY; black line) and healthy elderly (HE; red line). The healthy elderly group had higher theta response than the healthy young group in occipital areas for each FEs. Plus and minus signs represent the polarity of the signal for both line plots and topographic maps. The intensity of the colors represents the greatness of the amplitude for topographic maps. (For interpretation of the references to color in thisfigure legend, the reader is referred to the web version of this article.)
Fig. 7. The mean values of theta phase locking values at seven different loca-tions for healthy elderly (blue line) and healthy young (red line) group. F3-F4: frontal, C3-C4: central, T7-T8: temporal, Tp7-Tp8: temporo-parietal, P3-P4: parietal-1, P7-P8: parietal-2, O1-O2: occipital. HE: healthy elderly, HY: healthy young. The vertical bars denote 0.95 confidence intervals. The locationXgroup interaction (F(df =6, 168) = 3.087, p = 0.031,η_p^2 = 0.099) was statistically significant. The elderly group had higher theta phase locking value than the young group, especially over frontal locations (p < 0.01). Also, the difference between the elderly group phase locking value and the young group phase locking value in the central locations had a tendency to significance (p = 0.07). (For interpretation of the references to color in thisfigure legend, the reader is referred to the web version of this article.)
the elderly group (M: 0.69, SE: 0.03) had a higher alpha phase locking value than the young group (M: 0.54, SE: 0.03) in the frontal locations (p < 0.05) (Fig. 11). InFig. 12, phase locking in the frontal locations (F3-F4), in which the greatest group difference was observed, is shown for both groups. Differences in FEs were not statistically significant, but there was a marginal trend (F(df =4112) = 2.263, p = 0.08, η_p^2 = 0.075). The alpha phase locking values in the happy FE (M: 0.61, SE: 0.02) and the angry FE (M: 0.6, SE: 0.02) were higher than those in the neutral FE (M: 0.57, SE: 0.01).
The main results of the study are presented inTable 3, for the quick overview.
4. Discussion
The purpose of this study was to investigate the brain's dynamic structure regarding FE perception that changes with aging, by means of the EEG-Brain oscillations method. This study showed different dy-namic structures occurring in elderly and young individuals by in-vestigating phase locking analysis and event-relatedfiltered responses at delta, theta, and alpha frequency bands forfive different FEs. This investigation was performed for the first time in the literature. The mainfindings of the present study include: (I) Recognition of FE was less strong in elderly people than in young people, (II) the young group had higher delta responses than the elderly group in the parieto-occi-pital area, (III) the elderly group showed increased theta and alpha phase locking values than the young group in the fronto-central area during FE perception, (IV) elderly individuals' theta responses and Fig. 8. The grand average of theta phase locking values upon application of angry FE stimulation over frontal locations for healthy elderly and healthy young subjects. The X axis represents time and the Y axis represents frequency; the point at which the stimulus arrives is marked as a zero point on the X axis. F3-F4: Frontal. The elderly group had higher theta phase locking value than the young group in the frontal locations (p < 0.01).
Fig. 9. The mean values of alpha responses (peak-to-peak amplitude) at seven different locations for healthy elderly (blue line) and healthy young (red line) group. F3-F4: frontal, C3-C4: central, T7-T8: temporal, Tp7-Tp8: temporo-par-ietal, P3-P4: parietal-1, P7-P8: parietal-2, O1-O2: occipital. HE: healthy elderly, HY: healthy young. The vertical bars denote 0.95 confidence intervals. There was no statistically significant locationXgroup interaction, but there was a marginal trend (F(df =6, 168) = 2.457, p = 0.093,η_p^2 = 0.081). The elderly group had a higher alpha response than the young group, especially in the frontal and central locations. (For interpretation of the references to color in thisfigure legend, the reader is referred to the web version of this article.)
phase locking values were higher than in young individuals. This study showed that elderly people could use different dynamic structures during FE perception than those employed by young people.
Event-related oscillation studies also showed increased frontal ac-tivations with aging, especially in the alpha frequency band. Several studies have shown increased alpha phase locking in elderly individuals compared to the younger people for both auditory and visual paradigms (Yordanova et al., 1998;Kolev et al., 2002). We also found that elderly subjects show greater alpha phase locking values and alpha responses at fronto-central locations in comparison with young subjects in the FE
paradigm. Some studies showed the same pattern changing with age (increased fronto-central alpha phase and increased fronto-central alpha response) although they had employed different paradigms. These results suggest that increased fronto-central alpha activity asso-ciated with aging might not be related to the paradigm. This might simply be a general increase that occurs with aging. But this suggestion needs to be proved by a comparative study that employs several para-digms.Güntekin and Basar (2007)showed that greater alpha activity is elicited in response to a happy FE than in response to an angry FE, especially in the temporo-occipital area. Also,Campagnoli et al. (2019) showed that mid-occipital alpha power is sensitive to facial expression processing, including face-specific and attentive selection processes. These studies might indicate that alpha frequency could be important for FE perception. Our study showed that aging related increases in frontal alpha response is one of the important dynamics of FE percep-tion.
One of the prominent results of this study was that elderly subjects had greater theta responses and theta phase locking than young sub-jects, especially in the fronto-central area. This result has indicated that increased activity over frontal regions occurs with aging. Several EEG studies have also shown that theta responses in the frontal area in-creases with aging. Gunning-Dixon et al. (2003) showed increased frontal activation in elderly adults compared to young adults. On the other hand, young adults showed more temporo-limbic activation than did elderly adults. Elderly adults have decreased amygdala activation compared to young adults during the emotion discrimination task. There are some postmortem studies indicating that this result was re-lated to the loss of neurons in the limbic area (Kemper, 1994; Raz, 2000;Gunning-Dixon et al., 2003). Theta activity plays an important role in complex processes such as FE recognition. Also, event-related theta oscillations were important for memory, attention, and cognition related process (Basar, 1998; Başar et al., 1999a, 1999b, 2001; Klimesch et al., 1997; Klimesch, 1999; Kahana et al., 2001; Khader et al., 2010;Sauseng et al., 2010).Crespo-Garcia et al. (2012)have used FEs as memory paradigm in their study to compare elderly and young subjects. Their study showed that both groups manifested increased theta power. However, they found that theta power was related to memory performance in the elderly group. Poor memory performance indicated the decrease of theta power, while good memory performance Fig. 10. A) Topographic maps of the grand averages of the alpha responses (peak-to-peak amplitude) upon ap-plication of angry facial expression (FE) stimulation for healthy young (HY; bottom) and healthy elderly (HE; top). The healthy elderly group had greater alpha re-sponse than the healthy young group in frontal and central areas. B) Line plots of the grand averages of the alpha responses upon application of angry FE stimulation at frontal (F3-F4), parietal-1 (P3-P4) and occipital (O1-O2) locations for healthy young (HY; black line) and healthy elderly (HE; red line). The healthy elderly group had higher alpha response than the healthy young group in frontal locations and, there is no obvious difference between groups at parietal and occipital locations. Plus and minus signs represent the polarity of the signal for both line plots and topographic maps. The intensity of the colors represents the greatness of the amplitude for to-pographic maps. (For interpretation of the references to color in thisfigure legend, the reader is referred to the web version of this article.)
Fig. 11. The mean values of alpha phase locking values at seven different lo-cations for healthy elderly (blue line) and healthy young (red line) group. F3-F4: frontal, C3-C4: central, T7-T8: temporal, Tp7-Tp8: temporo-parietal, P3-P4: parietal-1, P7-P8: parietal-2, O1-O2: occipital. HE: healthy elderly, HY: healthy young. The vertical bars denote 0.95 confidence intervals. The locationXgroup difference was statistically significant (F(df =6, 168) = 4.329, p = 0.006, η_p^2 = 0.134). The elderly group had a higher alpha phase locking value than the young group in the frontal locations (p < 0.05). (For interpretation of the references to color in thisfigure legend, the reader is referred to the web ver-sion of this article.)
indicated higher theta power in elderly subjects. Taking all of these results together, it is shown that theta activation is important both in memory paradigms and FE recognition. Increased theta activity in el-derly individuals was determined to be more significant considered alongside the“processing deficiency hypothesis” by the same research group (Burke and Light, 1981; Eysenck, 1974). These results might suggest that elderly individuals were using a compensatory mechanism because they didn't have the same efficient processing ability as young people. This compensation mechanism could necessitate using neuronal mechanisms more. So, it means that elderly individuals could require more brain activity to perform the same functions. Thisfinding was also emphasized in many hypotheses about the aging brain.
Our study showed that young individuals elicited higher occipital delta responses while elderly individuals had increased frontal theta and alpha responses. This result was one of the important results of our study. Generally, delta responses increased in frontal and central lo-cations in response to cognitive stimuli (Ishii et al., 2009;Yener et al., 2008, 2012;Caravaglios et al., 2008;Stampfer and Baslar, 1985) but delta responses increased at occipital locations rather than frontal lo-cations in response to FE stimuli (Başar et al., 2006, 2007, 2008; Balconi and Lucchiari, 2006; Güntekin and Başar, 2009). Our study confirms that delta responses and delta phase locking increased at oc-cipital locations in the FE paradigm. Additionally, we found that young individuals have greater delta responses and delta phase locking in the occipital area than in elderly individuals. These results suggest that delta responses play an important role in complex brain functions like FE recognition. Elderly individuals were not as successful as young individuals at FE recognition tasks according to behavioral results. In-creasing occipital delta responses during FE recognition could be the result of increased selective attention and the recognition of complex pictures with details. Since elderly individuals have impairment in this processing, their occipital delta responses might be lower than in young individuals.
Mesulam (1994) has presented the concept of a selectively dis-tributed network. Before Mesulam, the results about selectively Fig. 12. The grand average of alpha phase locking values upon application of A) angry facial expression (FE), B) happy FE, C) neural FE stimulation over frontal locations for healthy elderly (HE) and healthy young (HY) subjects. The X axis represents time and the Y axis represents frequency; the point at which the stimulus arrives is marked as a zero point on the X axis. F3-F4: Frontal. The healthy elderly group had higher alpha phase locking value than the healthy young group in frontal locations, regardless of FEs. There was a slight difference between FEs (happy, angry > neutral), especially in the elderly group.
Table 3
The summary of main results.
Phase locking value Maximum amplitude value Delta HE > HY at fronto-central HY > HE at parieto-occipital Theta HE > HY at all areas (especially
at fronto-central)
HE > HY at frontal and occipital, angry, happy > neutral Alpha HE > HY at fronto-central,
angry, happy > neutral
HE > HY at fronto-central
dispersed and coherent multi-release responses in feline and human brains were published byBaşar (1980). This hypothesis has become a key notion in an increasing amount of publications in recent years (von Stein and Sarnthein, 2000;Varela et al., 2001;Fell et al., 2001). There were several studies emphasizing the selectively distributed multi-cor-tical oscillations in the processing of not only cognitive but also emo-tional stimuli like FE (Başar et al., 2006;Başar et al., 2007;Güntekin and Basar, 2007). The results of our study were also congruent with this approach. The processing of FEs elicits oscillatory responses that are selectively distributed to all cortex and works as a network. It has been shown that this network activity changes with aging.
5. Conclusions
This study showed the different dynamic patterns of FE in elderly and young individuals via the EEG-brain oscillations method for the first time in the literature. It has been shown that FE perception was impaired in elderly individuals. This impairment mostly presented with reduced occipital delta responses and a reduced delta phase locking in elderly individuals. In addition to reduced delta response, increased theta responses and phase locking were found in elderly individuals, especially in frontal areas. Moreover, increased frontal alpha responses were found in elderly individuals. These results might be a compensa-tory mechanism in elderly individuals. Since older people cannot pro-cess FEs effectively as young individuals, they might be using a different dynamic network, which requires the use of a large number of neuronal mechanisms.
Our study had some limitations; the gender difference in this study was not considered, and the number of female and male subjects in each group was not sufficient to make a proper comparison. Education year considerably differs across the groups. According to neuropsychological assessment, all subjects at the elderly group were cognitively normal and not low educated. Accordingly, we have not expected that the difference in education between the groups would affect the results. Nevertheless, the education level should be considered more sensitively for further research. Another limitation was that the sample size of each group was small. Although the main results of our study were consistent with the literature, the sample size would be enlarged for further re-search. As a conclusion, we believe that knowing the effect of age on the recognition of FEs could provide important initial data for further re-search. Future research should also consider using electrocardiography and electromyography to identify the emotional states of individuals during the task. These recordings could give us more insight into how FE recognition changes with aging. Additionally, it would be interesting to use videos instead of photographs as the stimuli, this is because vi-deos have higher ecological validity than photographs.
Author contributions statement
BG, ÜİA, and TA initiated the study and designed the protocol. TA and BG wrote the paper. TA recorded the EEG and analyzed the EEG data. BG, ÜİA, and LH supervised and controlled the study. All authors contributed to manuscript revision, read and approved the submitted version.
Funding
This research did not receive any specific grant from funding agencies in the public, commercial, or not-for-profit sectors.
Declaration of competing interest
The authors declare that the research was conducted in the absence of any commercial orfinancial relationships that could be construed as a potential conflict of interest.
Acknowledgments
The authors acknowledge Yasemin Abra for her helpful corrections of thefirst version of the manuscript.
References
Absher, J.R., Cloutier, J., 2016. Neuroimaging Personality, Social Cognition, and Character. Academic Press, London.
Adolphs, R., 2002. Recognizing emotion from facial expressions: psychological and neurological mechanisms. Behav. Cogn. Neurosci. Rev. 1 (1), 21–62.https://doi.org/ 10.1177/1534582302001001003.
Adolphs, R., 2003. Cognitive neuroscience of human social behaviour. Nat. Rev. Neurosci. 4, 165.https://doi.org/10.1038/nrn1056.
Adolphs, R., Tranel, D., Damasio, H., Damasio, A., 1994. Impaired recognition of emotion in facial expressions following bilateral damage to the human amygdala. Nature 372, 669. Retrieved from. https://doi.org/10.1038/372669a0.
Aftanas, L.I., Varlamov, A.A., Pavlov, S.V., Makhnev, V.P., Reva, N.V., 2001. Affective picture processing: event-related synchronization within individually defined human theta band is modulated by valence dimension. Neurosci. Lett. 303 (2), 115–118.
Aftanas, L.I., Reva, N.V., Varlamov, A.A., Pavlov, S.V., Makhnev, V.P., 2004. Analysis of evoked EEG synchronization and desynchronization in conditions of emotional ac-tivation in humans: temporal and topographic characteristics. Neurosci. Behav. Physiol. 34, 859–867.
Albohn, D.N., Adams Jr., R.B., 2016. Social vision: at the intersection of vision and person perception. In: Absher, J.R., Cloutier, J. (Eds.), Neuroimaging Personality, Social Cognition, and Character. Academic Press, London, pp. 159–186.
Allison, T., Puce, A., Mccarthy, G., 2000. Social perception from visual cues: role of the STS region. Trends Cogn. Sci. 4 (7), 267–278.
Alper, K.R., 1999. The EEG and cocaine sensitization: a hypothesis. J Neuropsychiatry Clin Neurosci. 11, 209–221.
Alper, K.R., John, E.R., Brodie, J., Günther, W., Daruwala, R., Prichep, L.S., 2006. Correlation of PET and qEEG in normal subjects. Psychiatry Res. Neuroimaging 146 (3), 271–282.
Balconi, M., Lucchiari, C., 2006. EEG correlates (event-related desynchronization) of emotional face elaboration: a temporal analysis. Neurosci. Lett. 392 (1–2), 118–123.
https://doi.org/10.1016/j.neulet.2005.09.004.
Başar, E., 1980. EEG-Brain Dynamics-Relation between EEG and Brain Evoked Potentials. Elsevier, Amsterdam.
Basar, E., 1998. Brain Function and Oscillations [v. I]: Brain Oscillations, Principles and Approaches. Springer, Berlin, Heidelberg.
Başar, E., 2012. A review of alpha activity in integrative brain function: fundamental physiology, sensory coding, cognition and pathology. Int. J. Psychophysiol. 86 (1), 1–24.https://doi.org/10.1016/j.ijpsycho.2012.07.002.
Başar, E., Yordanova, J., Kolev, V., Başar-Eroglu, C., 1997. Is the alpha rhythm a control parameter for brain responses? Biol. Cybern. 76, 471–480.https://doi.org/10.1007/ s004220050360.
Başar, E., Başar-Eroğlu, C., Karakaş, S., Schürmann, M., 1999a. Are cognitive processes manifested in event-related gamma, alpha, theta and delta oscillations in the EEG? Neurosci. Lett. 259 (3), 165–168.
Başar, E., Basar-Eroglu, C., Karakas, S., Schürmann, M., 1999b. Oscillatory brain theory: a new trend in neuroscience: the role of oscillatory processes in sensory and cognitive functions. IEEE Engineering in Medicine and Biology Magazine. 18 (3), 56–66.
https://doi.org/10.1109/51.765190.
Başar, E., Başar-Eroglu, C., Karakaş, S., Schürmann, M., 2001. Gamma, alpha, delta, and theta oscillations govern cognitive processes. Int. J. Psychophysiol. 39 (2–3), 241–248.
Başar, E., Güntekin, B., Öniz, A., 2006. Chapter 4 principles of oscillatory brain dynamics and a treatise of recognition of faces and facial expressions. Prog. Brain Res. 159 (06), 43–62.https://doi.org/10.1016/S0079-6123(06)59004-1.
Başar, E., Özgören, M., Öniz, A., Schmiedt, C., Başar-Eroǧlu, C., 2007. Brain oscillations differentiate the picture of one's own grandmother. Int. J. Psychophysiol. 64 (1), 81–90.https://doi.org/10.1016/j.ijpsycho.2006.07.002.
Başar, E., Schmiedt-Fehr, C., Öniz, A., Başar-Eroǧlu, C., 2008. Brain oscillations evoked by the face of a loved person. Brain Res. 1214 (1999), 105–115.https://doi.org/10. 1016/j.brainres.2008.03.042.
Bergerbest, D., Gabrieli, J.D.E., Whitfield-Gabrieli, S., Kim, H., Stebbins, G.T., Bennett, D.A., Fleischman, D.A., 2009. Age-associated reduction of asymmetry in prefrontal function and preservation of conceptual repetition priming. NeuroImage. 45 (1), 237–246.https://doi.org/10.1016/j.neuroimage.2008.10.019.
Berntson, G.G., Bechara, A., Damasio, H., Tranel, D., Cacioppo, J.T., 2007. Amygdala contribution to selective dimensions of emotion. Soc. Cogn. Affect. Neurosci. 2 (2), 123–129.https://doi.org/10.1093/scan/nsm008.
Bowers, D., Bauer, R.M., Heilman, K.M., 1993. The nonverbal affect lexicon: theoretical perspectives from neuropsychological studies of affect perception. Neuropsychology. 7 (4), 433–444.https://doi.org/10.1037/0894-4105.7.4.433.
Burke, D.M., Light, L.L., 1981. Memory and aging: the role of retrieval processes. Psychol. Bull. 90 (3), 513.
Cabeza, R., Anderson, N.D., Locantore, J.K., McIntosh, A.R., 2002. Aging gracefully: compensatory brain activity in high-performing older adults. NeuroImage. 17 (3), 1394–1402.https://doi.org/10.1006/nimg.2002.1280.
Cacioppo, J.T., Berntson, G.G., Bechara, A., Tranel, D., Hawkley, L.C., 2011. Could an aging brain contribute to subjective well-being? The value added by a social neu-roscience perspective. In: Todorov, A., Fiske, S., Deborah, P. (Eds.), Social
Neuroscience: Toward Understanding the Underpinnings of the Social Mind. Oxford press, New York, pp. 249–262.
Campagnoli, R.R., Wieser, M.J., Gruss, L.F., Boylan, M.R., McTeague, L.M., Keil, A., 2019. How the visual brain detects emotional changes in facial expressions: evidence from driven and intrinsic brain oscillations. Cortex. 111, 35–50.
Caravaglios, G., Costanzo, E., Palermo, F., Muscoso, E.G., 2008. Decreased amplitude of auditory event-related delta responses in Alzheimer's disease. Int. J. Psychophysiol. 70 (1), 23–32.
Carstensen, L.L., 2006. The influence of a sense of time on human development. Science 312 (5782), 1913 LP–1915 LP.
Carstensen, L.L., Fung, H.H., Charles, S.T., 2003. Socioemotional selectivity theory and the regulation of emotion in the second half of life. Motiv. Emot. 27 (2), 103–123.
https://doi.org/10.1023/A:1024569803230.
Carstensen, L.L., Turan, B., Scheibe, S., Ram, N., Ersner-Hershfield, H., Samanez-Larkin, G.R., ... Nesselroade, J.R., 2011. Emotional experience improves with age: evidence based on over 10 years of experience sampling. Psychol. Aging 26 (1), 21–3321.
https://doi.org/10.1037/a0021285.
Carvalho, C., Páris, M., Lemos, M., Peixoto, B., 2014. Assessment of facial emotions re-cognition in aging and dementia. The development of a new tool. Biomedicine and Aging Pathology. 4 (2), 91–94.https://doi.org/10.1016/j.biomag.2014.01.003. Charles, S.T., Carstensen, L.L., 2010. Social and emotional aging. Annu. Rev. Psychol. 61,
383–409.https://doi.org/10.1146/annurev.psych.093008.100448.
Charles, S.T., Mather, M., Carstensen, L.L., 2003. Aging and emotional memory: the forgettable nature of negative images for older adults. J. Exp. Psychol. Gen. 132 (2), 310.
Cohen, J., 1988. Statistical Power Analysis for the Behavioral Sciences. Routledge Academic, New York, NY.
Crespo-Garcia, M., Cantero, J.L., Atienza, M., 2012. Effects of semantic relatedness on age-related associative memory defi cits: the role of theta oscillations. NeuroImage. 61 (4), 1235–1248.https://doi.org/10.1016/j.neuroimage.2012.03.034.
Darwin, C., Prodger, P., 1998. The Expression of the Emotions in Man and Animals. Oxford University Press, USA.
Davis, S.W., Dennis, N.A., Daselaar, S.M., Fleck, M.S., Cabeza, R., 2008. Qué PASA? The posterior-anterior shift in aging. Cereb. Cortex 18 (5), 1201–1209.https://doi.org/ 10.1093/cercor/bhm155.
Dawson, G., Webb, S.J., McPartland, J., 2005. Understanding the nature of face proces-sing impairment in autism: insights from behavioral and electrophysiological studies. Dev. Neuropsychol. 27 (3), 403–424.
Delorme, A., Makeig, S., 2004. EEGLAB: an open source toolbox for analysis of single-trial EEG dynamics including independent component analysis. J. Neurosci. Methods 134 (1), 9–21.https://doi.org/10.1016/j.jneumeth.2003.10.009.
Desimone, R., 1991. Face-selective cells in the temporal cortex of monkeys. J. Cogn. Neurosci. 3 (1), 1–8.https://doi.org/10.1162/jocn.1991.3.1.1.
Edwards, J., Jackson, H.J., Pattison, P.E., 2002. Emotion recognition via facial expression and affective prosody in schizophrenia: a methodological review. Clin. Psychol. Rev. 22 (6), 789–832.https://doi.org/10.1016/S0272-7358(02)00130-7.
Ekman, P., 1976. Pictures of Facial Affect. Palo Alto. Consulting Psychologists Press. Ekman, P., Friesen, W.V., 1971. Constants across cultures in the face and emotion. J. Pers.
Soc. Psychol. 17 (2), 124–129.https://doi.org/10.1037/h0030377.
Ertl, M., Hildebrandt, M., Ourina, K., Leicht, G., Mulert, C., 2013. Emotion regulation by cognitive reappraisal - the role of frontal theta oscillations. NeuroImage. 81, 412–421.https://doi.org/10.1016/j.neuroimage.2013.05.044.
Eysenck, M.W., 1974. Age differences in incidental learning. Dev. Psychol. 10 (6), 936.
Faul, F., Erdfelder, E., Buchner, A., Lang, A.-G., 2009. Statistical power analyses using G*Power 3.1: tests for correlation and regression analyses. Behav. Res. Methods 41, 1149–1160.
Fell, J., Klaver, P., Lehnertz, K., Grunwald, T., Schaller, C., Elger, C.E., Fernández, G., 2001. Human memory formation is accompanied by rhinal–hippocampal coupling and decoupling. Nat. Neurosci. 4 (12), 1259.
Gaebel, W., Wölwer, W., 1992. Facial expression and emotional face recognition in schizophrenia and depression. Eur. Arch. Psychiatry Clin. Neurosci. 242 (1), 46–52.
https://doi.org/10.1007/BF02190342.
Ghanouni, P., Zwicker, J.G., 2018. Electrophysiological responses to emotional facial expressions in individuals with autism spectrum disorder: a systematic review. Review Journal of Autism and Developmental Disorders. 5 (3), 208–226. Goh, J.O., Park, D.C., 2009. Neuroplasticity and cognitive aging: the scaffolding theory of
aging and cognition. Restor. Neurol. Neurosci. 27 (5), 391–403.https://doi.org/10. 3233/RNN-2009-0493.
Grady, C., 2012. The cognitive neuroscience of ageing. Nat. Rev. Neurosci. 13 (7), 491–505.https://doi.org/10.1038/nrn3256.
Grill-Spector, K., Knouf, N., Kanwisher, N., 2004. The fusiform face area subserves face perception, not generic within-category identification. Nat. Neurosci. 7, 555. Retrieved from. https://doi.org/10.1038/nn1224.
Gross, J., 2014. Analytical methods and experimental approaches for electrophysiological studies of brain oscillations. J. Neurosci. Methods 228, 57–66.
Gunning-Dixon, F.M., Gur, R.C., Perkins, A.C., Schroeder, L., Turner, T., Turetsky, B.I., ... Gur, R.E., 2003. Age-related differences in brain activation during emotional face processing. Neurobiol. Aging 24 (2), 285–295.
Güntekin, B., Basar, E., 2007. Emotional face expressions are differentiated with brain oscillations. Int. J. Psychophysiol. 64 (1), 91–100.
Güntekin, B., Başar, E., 2009. Facial affect manifested by multiple oscillations. Int. J. Psychophysiol. 71 (1), 31–36.https://doi.org/10.1016/j.ijpsycho.2008.07.019. Güntekin, B., Başar, E., 2014. A review of brain oscillations in perception of faces and
emotional pictures. Neuropsychologia. 58, 33–51.https://doi.org/10.1016/j. neuropsychologia.2014.03.014.
Güntekin, B., Başar, E., 2016. Review of evoked and event-related delta responses in the
human brain. Int. J. Psychophysiol. 103, 43–52.
Güntekin, B., Hanoğlu, L., Aktürk, T., Fide, E., Emek-Savaş, D.D., Ruşen, E., ... Yener, G.G., 2019. Impairment in recognition of emotional facial expressions in Alzheimer's disease is represented by EEG theta and alpha responses. Psychophysiology 56 (11), e13434.
Hargrave, R., Maddock, R.J., Stone, V., 2002. Impaired recognition of facial expressions of emotion in Alzheimer's disease. The Journal of Neuropsychiatry and Clinical Neurosciences. 14 (1), 64–71.https://doi.org/10.1176/jnp.14.1.64.
Hasher, L., Zacks, R.T., 1988. Working memory, comprehension, and aging: a review and a new view BT. Psychol. Learn. Motiv. 22, 193–225. https://doi.org/10.1016/s0079-7421(08)60041-9.
Haxby, J.V., Hoffman, E.A., Gobbini, M.I., 2000. The distributed human neural system for face perception. Trends Cogn. Sci. 4 (6), 223–233. https://doi.org/10.1016/S1364-6613(00)01482-0.
Haxby, J.V., Hoffman, E.A., Gobbini, M.I., 2002. Human neural systems for face re-cognition and social communication. Biol. Psychiatry 51 (1), 59–67.https://doi.org/ 10.1016/S0006-3223(01)01330-0.
Hein, G., Knight, R.T., 2008. Superior temporal sulcus—it's my area: or is it? J. Cogn. Neurosci. 20 (12), 2125–2136.https://doi.org/10.1162/jocn.2008.20148. Hemond, C.C., Kanwisher, N.G., Op de Beeck, H.P., 2007. A preference for contralateral
stimuli in human object- and face-selective cortex. PLoS One 2 (6), 3–7.https://doi. org/10.1371/journal.pone.0000574.
Herman, S.R., 2017. ERP and Theta Activity Associated with Facial Emotion Memory (dissertation/thesis). Loma Linda University, Loma Linda, CA.
Herrmann, C.S., Grigutsch, M., Busch, N.A., 2005. EEG oscillations and wavelet analysis. In: Handy, T.C. (Ed.), Event-Related Potentials: A Methods Handbook. The MIT Press, Cambridge, pp. 229–258.
Hess, U., Thibault, P., 2009. Darwin and emotion expression. Am. Psychol. 64 (2), 120. Heywood, C.A., Cowey, A., 1992. The role of the‘face-cell’ area in the discrimination and recognition of faces by monkeys. Philosophical Transactions of the Royal Society of London. Series B: Biological Sciences 335 (1273), 31–38. Abstract retrieved from.
http://rstb.royalsocietypublishing.org/content/335/1273/31.abstract.
Hot, P., Klein-Koerkamp, Y., Borg, C., Richard-Mornas, A., Zsoldos, I., Adeline, A.P., ... Baciu, M., 2013. Fear recognition impairment in early-stage Alzheimer's disease: when focusing on the eyes region improves performance. Brain Cogn. 82 (1), 25–34.
https://doi.org/10.1016/j.bandc.2013.02.001.
Hu, L., Xiao, P., Zhang, Z.G., Mouraux, A., Iannetti, G.D., 2014. Single-trial time–-frequency analysis of electrocortical signals: baseline correction and beyond. Neuroimage. 84, 876–887.
Ishii, R., Canuet, L., Herdman, A., Gunji, A., Iwase, M., Takahashi, H., ... Takeda, M., 2009. Cortical oscillatory power changes during auditory oddball task revealed by spatiallyfiltered magnetoencephalography. Clin. Neurophysiol. 120 (3), 497–504.
https://doi.org/10.1016/j.clinph.2008.11.023.
Kahana, M.J., Seelig, D., Madsen, J.R., 2001. Theta returns. Curr. Opin. Neurobiol. 11 (6), 739–744.
Kamarajan, C., Rangaswamy, M., Chorlian, D.B., Manz, N., Tang, Y., Pandey, A.K., ... Porjesz, B., 2008. Theta oscillations during the processing of monetary loss and gain: a perspective on gender and impulsivity. Brain Res. 1235, 45–62.
Kanwisher, N., McDermott, J., Chun, M.M., 1997. The fusiform face area: a module in human extrastriate cortex specialized for face perception. J. Neurosci. Off. J. Soc. Neurosci. 17 (11), 4302–4311.https://doi.org/10.1098/Rstb.2006.1934. Kanwisher, N., Stanley, D., Harris, A., 1999. The fusiform face area is selective for faces
not animals. NeuroReport. 10 (1), 183–187. https://doi.org/10.1097/00001756-199901180-00035.
Kemper, T.L., 1994. Neuroanatomical and neuropathological changes during aging and dementia. In: Albert, M.L., Knoepfel, E.J.E. (Eds.), Clinical Neurology of Aging, 2nd ed. Oxford University Press, New York, pp. 3–67.
Khader, P.H., Jost, K., Ranganath, C., Rösler, F., 2010. Theta and alpha oscillations during working-memory maintenance predict successful long-term memory encoding. Neurosci. Lett. 468 (3), 339–343.
Klein-Koerkamp, Y., Beaudoin, M., Baciu, M., Hot, P., 2012. Emotional decoding abilities in Alzheimer's disease: a meta-analysis. Journal of Alzheimer's Diseas. 32 (1), 109–125.https://doi.org/10.3233/JAD-2012-120553.
Klimesch, W., 1999. EEG alpha and theta oscillations reflect cognitive and memory performance: a review and analysis. Brain Res. Rev. 29 (2–3), 169–195.https://doi. org/10.1016/S0165-0173(98)00056-3.
Klimesch, W., Doppelmayr, M., Pachinger, T., Ripper, B., 1997. Brain oscillations and human memory: EEG correlates in the upper alpha and theta band. Neurosci. Lett. 238 (1–2), 9–12.
Knyazev, G.G., 2007. Motivation, emotion, and their inhibitory control mirrored in brain oscillations. Neurosci. Biobehav. Rev. 31 (3), 377–395.https://doi.org/10.1016/j. neubiorev.2006.10.004.
Knyazev, G.G., Slobodskaya, H.R., 2003. Personality trait of behavioral inhibition is as-sociated with oscillatory systems reciprocal relationships. Int. J. Psychophysiol. 48 (3), 247–261.https://doi.org/10.1016/S0167-8760(03)00072-2.
Knyazev, G.G., Slobodskoj-Plusnin, J.Y., 2007. Behavioural approach system as a mod-erator of emotional arousal elicited by reward and punishment cues. Personal. Individ. Differ. 42 (1), 49–59.https://doi.org/10.1016/j.paid.2006.06.020. Knyazev, G.G., Bocharov, A.V., Levin, E.A., Savostyanov, A.N., Slobodskoj-Plusnin, J.Y.,
2008. Anxiety and oscillatory responses to emotional facial expressions. Brain Res. 1227, 174–188.https://doi.org/10.1016/j.brainres.2008.06.108.
Knyazev, G.G., Slobodskoj-Plusnin, J.Y., Bocharov, A.V., 2009. Event-related delta and theta synchronization during explicit and implicit emotion processing. Neuroscience. 164 (4), 1588–1600.https://doi.org/10.1016/j.neuroscience.2009.09.057. Kolev, V., Yordanova, J., Basar-Eroglu, C., Basar, E., 2002. Age effects on visual EEG