55 The Problematic of Savings: The Case of Turkey as an Emerging Market Economy1
[*]
Emre Alkin2 [**]
Abstract
This study provides an analysis on the course of private savings in Turkish economy, which are considered to be the primary source of sustainable growth and development. It also discusses the way how growth model adopted by Turkey regulates the relationship between Public Expenditure, Taxes and Private Sav-ings. Based on the results obtained from this analysis, it has been concluded that ever expanding public sector has a negative impact on private savings. As a long term solution, modifying or replacing the cur-rent growth model has been offered. As a short term offer, there is need to regulate the revenues and expenditures of all public institutions including the Central Government Budget with the support of the legislative authorities to eliminate the negative impact in question.
Keywords: Disposable Income, Savings, Domestic Savings, Private Savings, Investments, Growth, Tax
Rev-enues, Public Expenditure, Central Government Budget
Kısa Özet
Bu Çalışma, sürdürülebilir büyüme ve kalkınmanın kaynağı olarak kabul edilen özel tasarrufların Türkiye’deki seyri ile ilgili bir analizi içermektedir. Ayrıca Türkiye’nin uyguladığı büyüme modelinin Kamu Harcama-ları, Vergiler ve Özel Tasarruflar arasındaki ilişkiyi ne şekilde düzenlediği üzerine tartışmaları da içermek-tedir. Yapılan analizin sonucu olarak, sürekli genişleyen kamu kesiminin özel tasarruflar üzerinde olum-suz etki yaptığı konusundaki kesin bir yargıya ulaşılırken, söz konusu olumolum-suzluğun giderilmesinin uzun vadeli olarak büyüme modelinde değişiklik yapılması; kısa vadeli olarak da Merkezi Bütçe ve haricinde kalan kamu kurum ve kuruluşlarının gelir ve harcama kalemlerini kanun yapıcının desteğiyle disipline etme çözümleri önerilmiştir.
Anahtar Kelimeler: Kullanılabilir Gelir, Tasarruflar, Yurt İçi Tasarruflar, Özel Tasarruflar, Yatırımlar, Büyüme,
Vergi Gelirleri, Kamu Harcamaları, Merkezi Bütçe
1. Introduction
Savings are the most important source of funds in terms of economic stability, the saving-investment balance also plays an important role in achieving sustainable growth. In emerging markets, particularly in Turkey, the fact that households and the private sector incur debts constantly due to the lack of sav-ings and capital, while on the other hand, the public sector continues expanding and receiving a larger share of national income compared to the private sector has become increasingly identifiable without needing to conduct a quantitative analysis. As a result, private sector and households assets’ property rights belong to the financial institutions. Another important fact is that individuals living in countries
[*] I would like to thank İlke Yalçın for translating the article. [**] Istanbul Kemerburgaz University, [email protected]
56
suffering from a lack of savings due to high taxes, high cost of living and low income are trying to main-tain a reasonable standard of living by getting into debt.
Therefore, internationalization of the financial sector and capital circulation since the beginning of the last century has deprived national savings of their “sine qua non” status in terms of investment. Contradictory antitheses have been developed in the middle of the 20th century to disprove the theses insisting that both investments and savings are strictly correlated. For example, Keynes warned that researchers may make incorrect deductions with regard to the correlation between investment and saving1. There actu-ally can be saving without investment or investment without saving. There are also other theses and the-ories analysing the fact that insisting on saving more rather than spending can negatively impact other people’s savings and income, such as the Paradox of Thrift.
Despite experts and economists’ “hypersensitivity” warnings about saving, it is a commonly accepted re-ality that savings shortage is a serious obstacle to sustainable growth. This study will analyze the con-tradictory behaviours of Governments in countries aiming at increasing savings and ultimately discuss the steps that should be taken to boost savings. Also taking into account the fact that the studies con-ducted over the past centuries had formed a sound basis for this study, and considering the existence of economic paradigm shifts; it has been decided that references herein shall mainly include the works of 21st century authors.
However, it would be more convenient to start with the fundamental principles of macroeconomics so as to avoid any confusion that may arise due to the differences between the approaches to the notion of saving.
2. Disposable Income and Savings
When we take the statement “The ultimate goal of the economist is to explain the economy as a whole”2 into consideration, we can say that making analyses and developing solutions without looking out only for the interests of a certain individual or a group should be the focus of the act of analysing. From this point of view, improving the prosperity of every individual should be aimed at increasing savings, in-stead of increasing aggregate savings within the scope of pareto optimality, i.e. a state of allocation of re-sources in which it is impossible to make any one producer, consumer and factor owner better off with-out making at least one worse off.
The following pages of this paper will introduce you to analyses conducted in Turkey, and in both de-veloped and developing countries; and offer practical solutions based on decades of experiences of the countries in question. But first, it is essential to describe “personal income”, which is a key indicator for in-dividual prosperity, and the ways to increase earnings.
Defining the main types of macroeconomic variables would help to define personal income. Often used to mean the same as “national income”, gross national product (GNP) is far more inclusive than national 1 John Maynard Keynes, General Theory of Employment, Interest, and Money (London: Palgrave Macmillan, 1936)
57
income as it is defined as the total value of final goods and services produced by a nation’s economy in one year. Depreciation, i.e. devaluation of capital goods due to wear and tear, or constant use in the pro-duction process, is subtracted from GNP to determine Net National Product (NNP), and Indirect Taxes are subtracted from NNP to determine National Income (NI).
NI basically represents the earnings of the owners of factors of production. The cost of labour is wages, cost of the capital is the rate of interest, land price equals rent, and finally the total profit that entrepre-neurs aim to achieve denotes NI. However, revenues are not limited only to wages, interest, rent and profit. Those who are not a part of production possibilities can earn income as well, such as retirees, widows and orphans etc. Personal Income (PI) is determined by adding the Transfer Payments made to those in-dividuals to NI. Direct Taxes are subtracted from PI to determine Disposable Income (DI). To put it differ-ently, DI is the final amount of money that individuals have available for spending at their own discre-tion.3 Following this line of thought, we might define savings as follows:
“Savings consist of the amount left over after DI is used for consumption”. Therefore, it is possible to say that “savings will increase depending on the increase in DI” by presenting a valid mathematical proof. As mentioned above, the detailed explanation of how this increase can be realized will be analyzed in the coming pages.
3. Relationship Between Savings and Growth
After clarifying the relationship between DI and Savings using the main macroeconomic indicators above, it would be easier to theoretically present the solution required to increase savings. If we consider the system lying between the GNP and Disposable Income to be a table, we will come up with the result below:
GNP - Depreciation = NNP NNP - Indirect Taxes = NI NI + Transfer Payments = PI PI - Direct Taxes = DI
Thus, there are at least two solutions – that can be employed either simultaneously or separately – to increase savings. The first solution is to increase GNP which would enable NI, PI and ultimately DI to grow. However, it is known that the growth of GNP alone is not enough to boost savings. It is also known that countries having high Marginal Propensities to Consume4 tend to have lower incomes. In other words, given the fact that savings are a function of income, no parallelelity exists between the savings rates and Gross Domestic Product (GDP) growth rates in emerging economies. The case of Turkey as an emerging market economy is probably one of the most suitable examples to discuss the problematic of savings.
3 Alkin, İktisat, 166
58
It can be observed that the ratio of Domestic Savings to GNP, which kept a relatively high course until early 2000s, had been gradually subsided before 2012 despite high growth rates in subsequent years5. Decline in the savings rate continued until 2015, which led the 61st Government of Turkey to add arti-cles like, “Special purpose saving mechanisms shall be developed to incite long-term savings” into the “Medium Term Program” (MTP) Guide issued in January 2016.
Savings/GNP ratio in Turkey maintains a very low level of 14 percent. Private sector saving is not entirely different either with a ratio of 15.9 percent. Ratios in other countries compared to Turkey are as follows; Brazil 19 percent, Canada 20.5 percent, Italy 20.8 percent, UK 22 percent, United States 22.1 percent, France 24.2 percent, Spain 24.2 percent.6 Therefore, pushing GNP growth at a faster rate in order to increase sav-ings has not always been a fruitful method. Therefore, we need to look for an alternative method which basically suggests reducing taxes to directly increase DI.
In the scheme above, Direct and Indirect Taxes appear as two important milestones between the start-ing point of GNP and the end point, which is the DI. Considerstart-ing that NI is determined by subtractstart-ing the Indirect Taxes from NNP and DI is determined by subtracting the Direct Taxes from PI, improvements in both components would result in a faster growth of savings. This issue is analyzed from different per-spectives in the following section.
4. The Relationship Between Saving and Public Expenditure
A very significant finding about emerging market economies is that the taxation issue has not been ad-dressed as a part of the growth model. This is one of the main differences between developed and de-veloping countries. Due to tax collection challenges in emerging economies, governments implement higher tax rates to create funds for public spending. Tax legislation in these countries imposes yet an-other challenge. Tax rates can vary greatly by industry, goods and services, or even by state/region. One of the main reasons why the savings rate is constantly low in emerging markets is the fact that public expenditure remains at high levels and is financed through a higher tax burden.
According to conventional fiscal approaches, the State shall provide efficient and effective distribution of public and private resources, and a fair distribution of income.7 It should be pointed out, however, that in countries like Turkey, it is a fact that a substantial part of tax revenues consists of indirect taxes that goes against the two principles of taxation: equity and fairness.8
In many emerging or developing economies tax increases bring negative impacts on private savings and even lead to inflationary effects. Still, governments in emerging economies tend to think that they can decrease consumption by increasing taxes, so that they can also increase savings.
5 “Medium Term Programme 2014-2016,” T.R. Ministry of Development, accessed May 4, 2016, http://www.mod.gov.tr/Lists/MediumTermPrograms/ Attachments/10/Medium%20Term%20Programme%202014-2016.pdf
6 Asaf Savaş Akat, “Dünya’da tasarruf oranları,” Gazete Vatan, November 26, 2012, accessed May 4, 2016, http://www.gazetevatan.com/asaf-savas-akat-495497-yazar-yazisi-dunyada-tasarruf-oranlari/
7 Ahmet Burçin Yereli, “Tasarruf Politikalarının Oluşumunda Vergi Sisteminin Rolü,” Maliye Yazıları 55 (1997): 64.
8 Erdoğan Alkin, “Vergilerdeki Yeni Düzenlemenin Tasarruflara Etkisi,” İstanbul Ticaret Odası Yayını, January 11, 2013, accessed May 4, 2016, http:// www.ito.org.tr/itoyayin/SY0080522.pdf
59
However, given the fact that low-income individuals spend a substantial part of their earnings on basic and vital needs, they are obliged to sacrifice their hard-earned savings, which are already quite limited, instead of giving up their consumption habits, whenever the goods and services that meet the above mentioned needs experience a price increase due to tax hikes. Despite rapid economic growth in Tur-key in the last 15 years, the above mentioned facts represent strong clues on the necessity of searching for the reason for downward spiral in savings rates in the right places.
“Discouraging consumption”, which is one of the main purposes of taxation, actually discourages con-sumer saving mostly in emerging economies. “In some cases, while concon-sumers should have refrained from spending, contrary to expectations, spending might climb to record high and cause the prices to rise. The result may be tolerated for a while considering the fact that increasing government tax revenues is the main aim in the first place. However, negative effects arising from a decrease in people’s propensity to save should not be taken lightly as they may lead to serious problems in the future.”9
Studying the decline in Personal and Corporate Savings due to high tax rates only with regard to slowing capital accumulation and a decrease in investment levels would be would be a less accurate approach. It is also important how governments spend taxpayers’ money.10 Due to possible negative impacts of govern-ment spending on the general price level, saving levels may tend to fall contrary to what is expected. In short, it is now generally accepted that domestic savings are the most reliable source of sustainable growth. From this point of view, the necessity of increasing DI becomes even more important than at-taining high growth rates, in order to obtain an acceptable level of savings. Choosing to focus on the for-mer solution will enable not only savings, but also consumption to be kept at a certain level that would support sustainable economic growth.
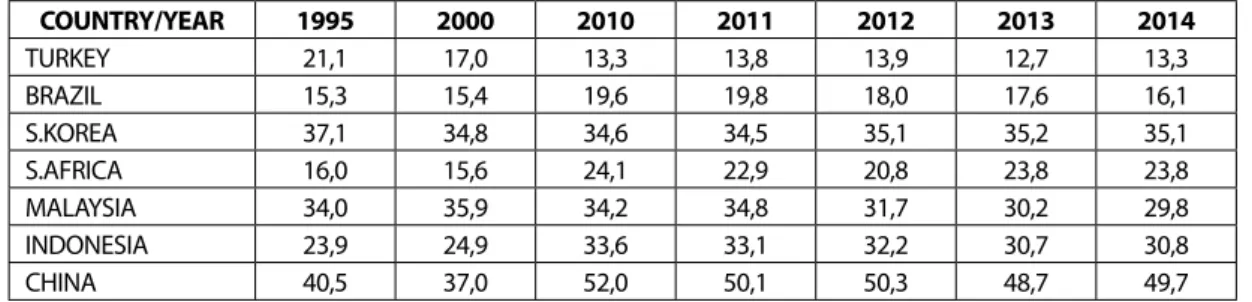
Table 1: Ratio of Aggregate Savings to GDP (%)
COUNTRY/YEAR 1995 2000 2010 2011 2012 2013 2014 TURKEY 21,1 17,0 13,3 13,8 13,9 12,7 13,3 BRAZIL 15,3 15,4 19,6 19,8 18,0 17,6 16,1 S.KOREA 37,1 34,8 34,6 34,5 35,1 35,2 35,1 S.AFRICA 16,0 15,6 24,1 22,9 20,8 23,8 23,8 MALAYSIA 34,0 35,9 34,2 34,8 31,7 30,2 29,8 INDONESIA 23,9 24,9 33,6 33,1 32,2 30,7 30,8 CHINA 40,5 37,0 52,0 50,1 50,3 48,7 49,7
Source: Table is prepared based on the data provided by IMF; World Economic Outlook, Database, April 201511
As the Table 1 clearly shows, the ratio of aggregate savings to GDP in Turkey is dramatically low com-pared to other emerging markets, leading both households and the private sector to fall further into 9 Alkin, “Vergilerdeki Yeni Düzenlemenin.”
10 Yereli, “Vergi Sisteminin Rolü,” 77.
60
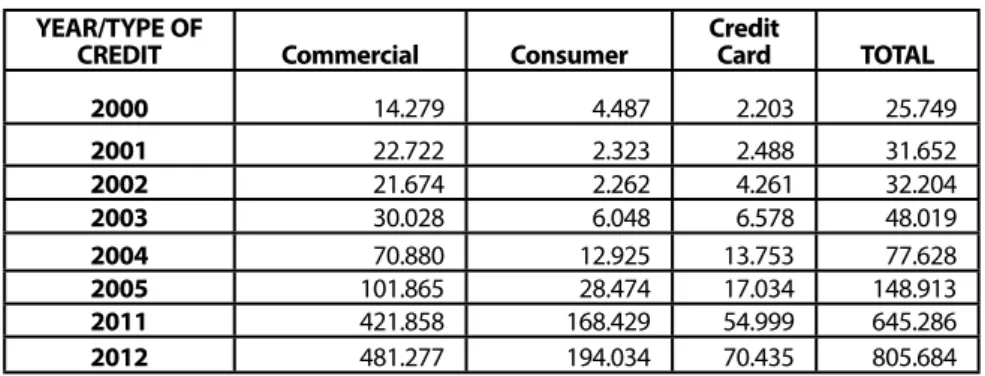
debt. As can be seen from Table 2, loan volume growth between 2000-2012 is quite above Turkey’s eco-nomic growth rate and inflation.
Table 2: Credit Growth in Turkey over the past few years (million TL) YEAR/TYPE OF
CREDIT Commercial Consumer Credit Card TOTAL
2000 14.279 4.487 2.203 25.749 2001 22.722 2.323 2.488 31.652 2002 21.674 2.262 4.261 32.204 2003 30.028 6.048 6.578 48.019 2004 70.880 12.925 13.753 77.628 2005 101.865 28.474 17.034 148.913 2011 421.858 168.429 54.999 645.286 2012 481.277 194.034 70.435 805.684
Source: Table is prepared based on the data provided by Uysal, İşletme Yönetiminde Küresel ve Makro Ekonomik Vizyon Oluşturma, 1—38, accessed May 4, 2016, kisi.deu.edu.tr/yasar.uysal/site/sonYaptiklarim/
islkureselmakrovizyon.ppt
The economic situation in Turkey experiencing higher rates of growth despite a savings gap can be un-derstood more clearly when we compare the ratio of fixed capital of investments and domestic savings to GDP.
Table 3: Domestic Savings/GDP ratio and Fixed Capital Investments/ GDP ratio
YEARS Domestic Savings/GDP Fixed Capital Investments. / GDP
1998 24,3 23,1 1999 20,1 19,3 2000 18,4 20,8 2001 18,4 16,4 2002 18,6 17,1 2003 15,5 17,4 2004 16,0 20,7 2005 15,9 21,4 2006 16,6 22,6 2007 15,5 21,8 2008 16,8 20,2 2009 13,2 17,2 2010 13,9 19,1 2011 13,8 24,2 2012 13,9 20,1 2013 12,7 21,1
Source: Table is prepared based on the data provided by the Turkish Ministry of Development and IMF World Economic Outlook, Database, April 201512
Table 3 confirms Keynes’s13 proposition that “there can be saving without investment or investment with-out saving”. However, we should indicate that Turkey will never be able to solve the dilemma of “achiev-12 https://www.imf.org/external/pubs/ft/weo/2015/01/weodata/index.aspx; http://www.kalkinma.gov.tr/Lists/Yaynlar/Attachments/654/Ekonomik%20
ve%20Sosyal%20G%C3%B6stergeler_1950_2014.pdf, accessed May 4, 2016.
61
ing economic growth but running a current account deficit at the same time” as long as it cannot estab-lish a balance between domestic savings and investment14, which can be clearly seen from Table 4.
Table 4: The ratio of Growth Rate to Current Account Deficit/GDP over the years YEARS, GROWTH RATE, CURRENT ACCOUNT
DEFI-CIT/GDP Growth Current Account Deficit/GDP
1970-79 4.7 1.3 1980-89 4.1 1.2 1990-99 4.9 0.6 2000-10 4.2 3.6 2010-12 5.5 7.8 2012-13 4,2 7.7
Source: Table is prepared based on the data provided by the Central Bank of the Republic of Turkey (CBRT), Undersecretariat of the Treasury and Turkish Statistical Institute (TSI)
Despite the comments about the phenomenon where Public Debt / NI ratio has caused the crowding-out effect to lessen after 2000s, the fact that the savings rate is in continuous decline, the current account deficit is getting larger and the public sector is growing incessantly reveals the necessity of conducting extensive analyses on tax rates and revenues.
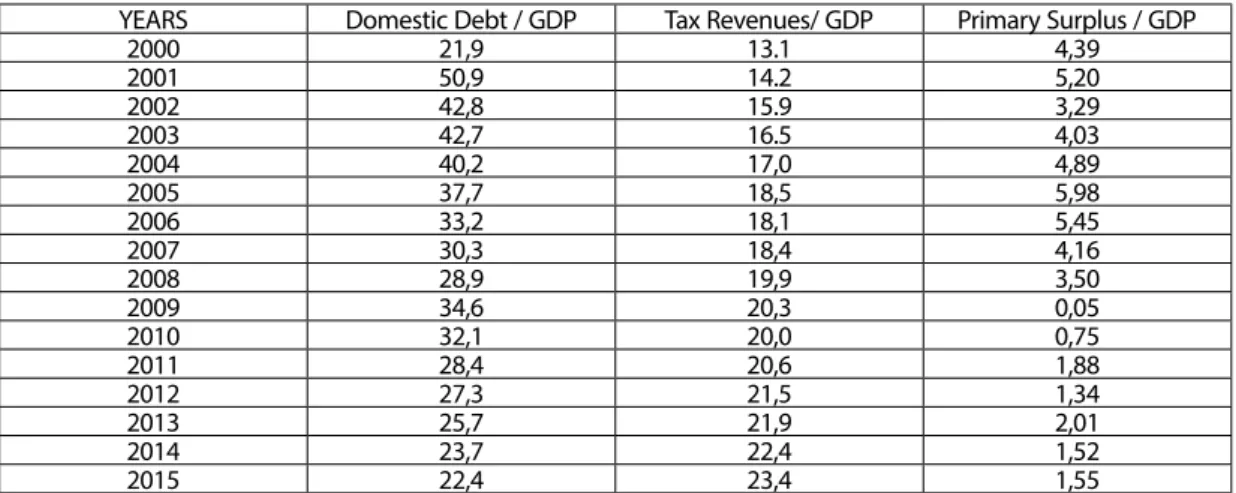
Data showing the ratio of government revenue and expenditures, excluding interest payments, also known as “primary balance” to GDP has steadily declined over the years, and kept a lower course reveals the fact that the public sector is handed a much bigger share of economic growth than the private sector.
Table 5: Domestic Debt / GDP and Primary Surplus / GDP ratios over the years (%)
YEARS Domestic Debt / GDP Tax Revenues/ GDP Primary Surplus / GDP
2000 21,9 13.1 4,39 2001 50,9 14.2 5,20 2002 42,8 15.9 3,29 2003 42,7 16.5 4,03 2004 40,2 17,0 4,89 2005 37,7 18,5 5,98 2006 33,2 18,1 5,45 2007 30,3 18,4 4,16 2008 28,9 19,9 3,50 2009 34,6 20,3 0,05 2010 32,1 20,0 0,75 2011 28,4 20,6 1,88 2012 27,3 21,5 1,34 2013 25,7 21,9 2,01 2014 23,7 22,4 1,52 2015 22,4 23,4 1,55
Source: Table is prepared based on the data provided by the Republic of Turkey Ministry of Finance General Directorate of Budget and Fiscal Control15
14 Ercan Dedekoca, “TASARRUFLAR: Globalde ve Türkiye’de Nereye?,” 21. Yüzyıl Türkiye Enstitüsü, Ekonomik Araştırmalar Merkezi, May 29, 2015, accessed
May 4, 2016,http://www.21yyte.org/tr/arastirma/ekonomik-arastirmalari-merkezi/2015/05/29/8197/tasarruflar-globalde-ve-turkiyede-nereye
62
As can be seen from Table 5, while the ratio of domestic debt to GDP has been decreasing, primary bal-ance to GDP ratio has continued to drop, and remained mostly at low levels through the recent years. The fact that tax revenues show continuing growth despite the decline in the debt-to-GDP ratio repre-sents confirming evidence for a paradigm shift. Considering, on the one hand, that the debt-to-GDP ratio keeps decreasing whereas the tax-to-GDP ratio further increases; on the other hand, that public spend-ing keeps climbspend-ing, excludspend-ing interest payments, might be said to be due to a comfort provided by the following equation.
Real Interest Rate = Growth Rate + (Primary Surplus / GDP)
According to this equation, since Turkey is delivering high growth performance due to relatively low real interest rates, it may prove unnecessary to get hypersensitive about Primary Surplus. However, various pa-rameters and dynamics should be taken into account when evaluating these equations, instead of con-ducting separate or instantaneous evaluations. This is the reason why PI and DI, and ultimately Savings are negatively affected by the continuous growth of public expenditures and efforts made to increase tax revenues, on the grounds that real interest rates are persistently lower and economy grows too fast.
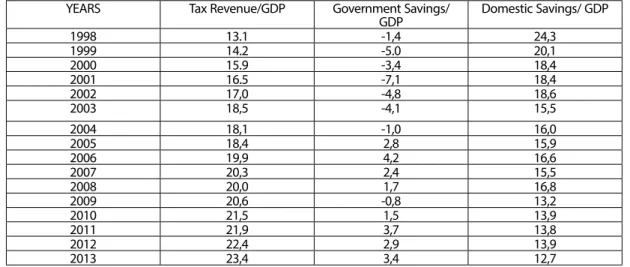
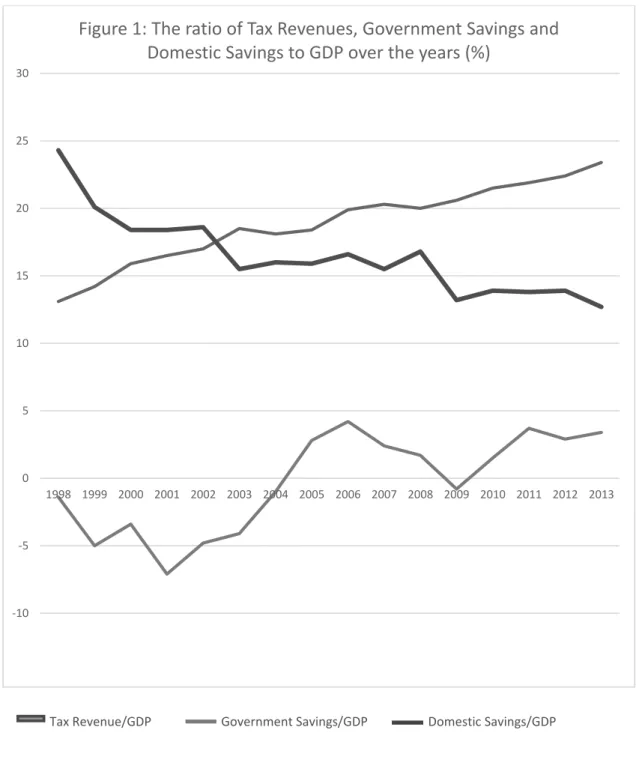
Table 6: The ratio of Tax Revenue, Government Savings and Domestic Savings to GDP over the years (%) YEARS Tax Revenue/GDP Government Savings/
GDP Domestic Savings/ GDP 1998 13.1 -1,4 24,3 1999 14.2 -5.0 20,1 2000 15.9 -3,4 18,4 2001 16.5 -7,1 18,4 2002 17,0 -4,8 18,6 2003 18,5 -4,1 15,5 2004 18,1 -1,0 16,0 2005 18,4 2,8 15,9 2006 19,9 4,2 16,6 2007 20,3 2,4 15,5 2008 20,0 1,7 16,8 2009 20,6 -0,8 13,2 2010 21,5 1,5 13,9 2011 21,9 3,7 13,8 2012 22,4 2,9 13,9 2013 23,4 3,4 12,7
Source: Table is prepared based on the data provided by the Turkish Revenue Administration16
63
Tax Revenue/GDP Government Savings/GDP Domestic Savings/GDP
-10 -5 0 5 10 15 20 25 30 1998 1999 2000 2001 2002 2003 2004 2005 2006 2007 2008 2009 2010 2011 2012 2013
Figure 1: The ratio of Tax Revenues, Government Savings and
64
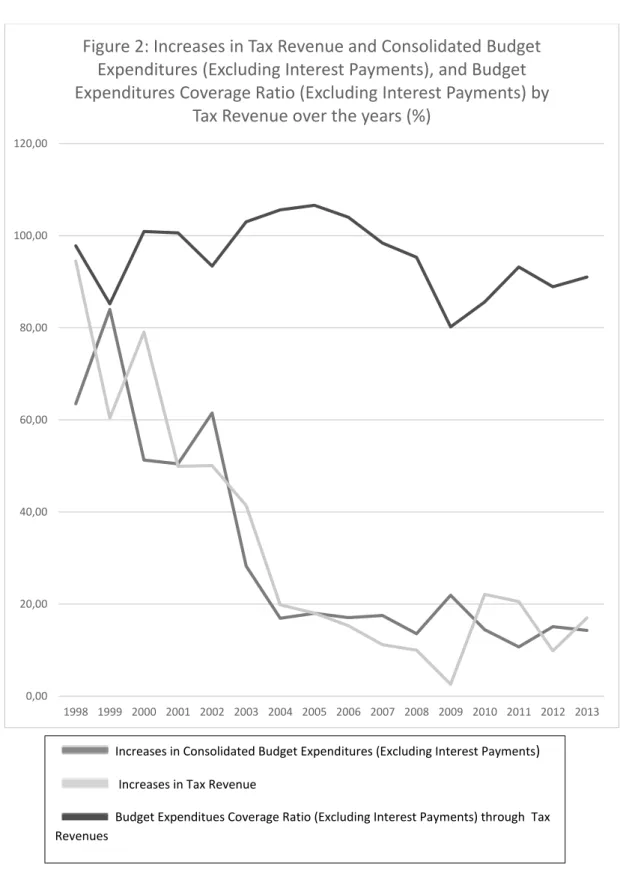
In the light of Figure 1, it would be useful to analyze whether public spending over the years has been above the inflation rates or not, in terms of size or growth. Thus, it might be possible to observe the pub-lic expenditure growth in periods where the ratio of domestic savings to national income is in constant decline. The conjuncture where the tax revenue is adequately covering or not covering the budget ex-penditures (excluding interest payments) can be considered as empirical evidence about the fact that the public sector does not care too much about saving and keeps on expanding at a blistering pace.
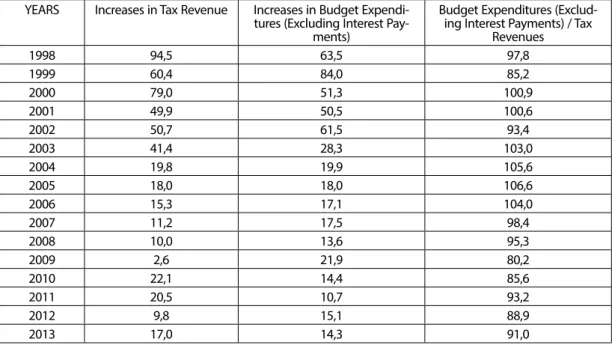
Table 7: Increases in Tax Revenue and Consolidated Budget Expenditures (Excluding Interest Payments) and Budget Expenditures Coverage Ratio (Excluding Interest Payments) by Tax Revenue over the years (%) YEARS Increases in Tax Revenue Increases in Budget
Expendi-tures (Excluding Interest Pay-ments)
Budget Expenditures (Exclud-ing Interest Payments) / Tax
Revenues 1998 94,5 63,5 97,8 1999 60,4 84,0 85,2 2000 79,0 51,3 100,9 2001 49,9 50,5 100,6 2002 50,7 61,5 93,4 2003 41,4 28,3 103,0 2004 19,8 19,9 105,6 2005 18,0 18,0 106,6 2006 15,3 17,1 104,0 2007 11,2 17,5 98,4 2008 10,0 13,6 95,3 2009 2,6 21,9 80,2 2010 22,1 14,4 85,6 2011 20,5 10,7 93,2 2012 9,8 15,1 88,9 2013 17,0 14,3 91,0
Source: Table is prepared based on the data provided by the Turkish Revenue Administration17,
65 0,00 20,00 40,00 60,00 80,00 100,00 120,00 1998 1999 2000 2001 2002 2003 2004 2005 2006 2007 2008 2009 2010 2011 2012 2013
Figure 2: Increases in Tax Revenue and Consolidated Budget
Expenditures (Excluding Interest Payments), and Budget
Expenditures Coverage Ratio (Excluding Interest Payments) by
Tax Revenue over the years (%)
Increases in Consolidated Budget Expenditures (Excluding Interest Payments) Increases in Tax Revenue
Budget Expenditues Coverage Ratio (Excluding Interest Payments) through Tax Revenues
66
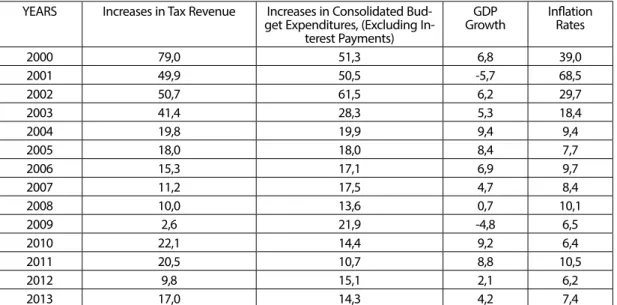
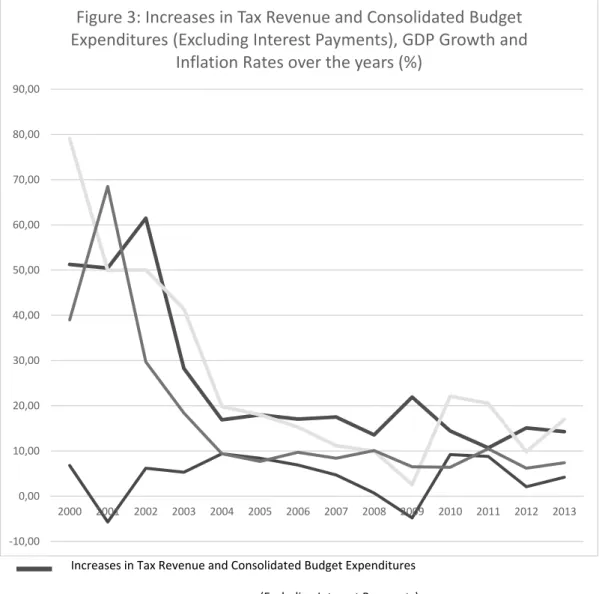
Another issue that needs to be analyzed is the comparison between the increase in Budget Expendi-tures (Excluding Interest Payments), Growth and Inflation Rate; which would allow us to see if public ex-penditures increase coordinately with growth and cause inflationary effects. According to this analysis, we may establish whether public sector expansion causes domestic savings to decrease due to high tax rates and high inflation rates.
Table 8: Increases in Tax Revenue and Consolidated Budget Expenditures (Excluding Interest Payments), GDP Growth and Inflation Rates over the years (%)
YEARS Increases in Tax Revenue Increases in Consolidated Bud-get Expenditures, (Excluding
In-terest Payments)
GDP
Growth InflationRates
2000 79,0 51,3 6,8 39,0 2001 49,9 50,5 -5,7 68,5 2002 50,7 61,5 6,2 29,7 2003 41,4 28,3 5,3 18,4 2004 19,8 19,9 9,4 9,4 2005 18,0 18,0 8,4 7,7 2006 15,3 17,1 6,9 9,7 2007 11,2 17,5 4,7 8,4 2008 10,0 13,6 0,7 10,1 2009 2,6 21,9 -4,8 6,5 2010 22,1 14,4 9,2 6,4 2011 20,5 10,7 8,8 10,5 2012 9,8 15,1 2,1 6,2 2013 17,0 14,3 4,2 7,4
Source: Table is prepared based on the data provided by the Turkish Revenue Administration and the Republic of Turkey Ministry of Development18
18 http://www.gib.gov.tr/fileadmin/user_upload/VI/GBG/Tablo_16.xls.htm; http://www.kalkinma.gov.tr/Lists/Yaynlar/Attachments/654/Ekonomik%20
67
Increases in Tax Revenue and Consolidated Budget Expenditures (Excluding Interest Payments) Increases in Tax Revenue
GDP Growth Inflation Rates -10,00 0,00 10,00 20,00 30,00 40,00 50,00 60,00 70,00 80,00 90,00 2000 2001 2002 2003 2004 2005 2006 2007 2008 2009 2010 2011 2012 2013
Figure 3: Increases in Tax Revenue and Consolidated Budget
Expenditures (Excluding Interest Payments), GDP Growth and
Inflation Rates over the years (%)
As can be seen from Table 8 and Figure 3, when public expenditure growth and increases in tax revenue are analyzed and compared with growth or inflation rates, it can be clearly seen that they stream back at very high levels. Considering the fact that developments occurring in the previous period might di-rectly affect the following period, high public sector growth rates should be analyzed in terms of ineffi-cient use of resources.
68
However, we might say that Turkish Governments have taken a certain decision to enliven economic growth hurt by the slowdown during the 2001 Banking Crisis and 2008 Global Financial Crisis. Gov-ernments’ campaigns to reinvigorate the economy, which seemed impossible to improve only by pri-vate sector investments, stand out as an non-negligible challenges, considering the enormous in-crease in public expenditure.
The relationship between public expenditure and economic growth can be analysed through empirical tests. Also, the relationship between each of expenditure’s subcomponents and the economic growth can be tested through various analyses.19
Using the Engle-Granger Cointegration test, Yüksel and Songur (2011) have proved that the economic growth and all other series, excluding interest payments, are cointegrated; i.e. a long-term relationship between economic growth and series exists: “…[T]he result of the Granger causality test proves that a unidirectional casualty runs from current expenditure and aggregate public expenditure to economic growth, while no casualty exists between other variables and economic growth…” Both researchers concluded that “… public expenditures have been highly effective and efficient in achieving economic growth. However, as is known, quantitative increases in public expenditures are not enough alone to attain a sustainable economic growth. Qualitative methods should be used to evaluate expenditures in order to maintain and increase economic efficiency. Besides, considering the fact that a long-run relationship between interest payments and growth does not exist, borrowing to finance public ex-penditures should be approached with skepticism…”
In the light of the above mentioned information, it can be seen that while public expenditures be-tween 1980-2003, which have greatly contributed to Turkey’s growth performance, have been largely financed through domestic borrowing, after 2003 a paradigm shift has been implemented to finance government spending mostly through taxation.
Once the method of contributing to economic growth was defined as “growth with public spending”, private consumption expenditures and investments started through borrowing; public expenditures and investments through taxation. This trend can be clearly seen in the MTP targets.
Although “increasing savings” stands out as the priority goal of the programme, the idea of continu-ously expanding consolidated budget expenditures and financing those expenditures through taxa-tion is clearly defined in the MTP. On the other hand, when we look at the macroeconomic indicators stated in the MTP, it can be seen that the authors of the programme are envisaging improving the ra-tio of savings to GDP by lowering the tax revenues and public expenditures (excluding interest pay-ments) to GDP ratio.
19 Cihan Yüksel and Mehmet Songur, “Kamu Harcamalarının Bileşenleri ile Ekonomik Büyüme Arasındaki I=lişki: Ampirik Bir Analiz (1980-2010),”
69 Table 9: The Ratio of Public Expenditures (Excluding Interest Payments), Tax Revenues and Savings to GDP (%)
YEARS Public Expenditures (Excluding Interest
Payments)/GDP Tax Revenues / GDP Savings/ GDP
2011 21.1 21,9 13,8 2012 22,1 22,4 13,9 2013 22.9 23,4 12,7 2014 22,8 20,2 15,0 2015 (GT) 23,1 20,8 15,6 2016 (P) 23,3 20,8 16,5 2017 (P) 22,5 20,5 17,2 2018 (P) 21,9 20,5 17,8
Source: Table is prepared based on the data provided by the Republic of Turkey Ministry of Finance General Directorate of Budget and Fiscal Control, http://www.bumko.gov.tr/Eklenti/9691,ortavadeliprogram20162018.pdf?0
Considering the previous MTP targets, and the fact that Public Expenditures have constantly remained above the target, it seems unlikely that the government will be able to achieve the savings target. Fur-thermore, envisaging an increase in savings in 3 to 4 years only by lowering the ratio of public expendi-tures and taxes to GDP is theoretically questionable, and not practically possible according to Table 9. The figures above show that the growth rate of central budget expenditures and spending made by other public institutions and organizations will exceed both inflation and the growth rate. In that case, we should not expect that savings will steadily increase in the medium term as the expenditures in ques-tion are largely financed through taxaques-tion.
5. Conclusion and Suggestions
The public sector plays a vital part in Turkey’s growth dynamics. The Growth Model has been designed accordingly and a financial plan was made pursuant to this design. This being the case, it is very diffi-cult to raise DI such that it would contribute to savings. On the other hand, it is impossible to monitor and analyse the negative impact of expenditures and public revenues on savings just by looking at Cen-tral Government Budget figures. When examining the Medium Term Program, it can be clearly noticed that the spending levels of the Central Government Budget and “Other Public Institutions and Organiza-tions” for the 2014–2015 period are almost equal. Then again, pressure exerted by the above mentioned institutions on DI is non-negligible. General Budget/Central Budget ratio in the aforementioned period is about 56–57 percent. It is envisaged that this ratio will rise to 65 percent by 2018 according to MTP. However, as mentioned above, it would not be very realistic to expect self-regulating organizations like annexed budget administrations and municipalities to remain within the budget limits specified in the MTP, while even the Central Government Budget itself exceeds the limits set by its own resources. Addi-tionally, both government and local administrations, and other public institutions and organizations as well, spend much more than the allocated budget during electoral periods. Given the fact that
consec-70
utive general elections and snap elections have been held in Turkey in recent years, it seems like Turkey will have difficulty in strictly abiding by the public expenditure targets specified in the MTPs.
However, it can be seen that the government is exerting effort to achieve the tax revenue target by al-ways taking into account the possibility that expenditures may rise. Therefore, public expenditures will need to be financed by an increase in tax levels. According to the difference between target and realiza-tion, it appears that the ex-post expenditure has exceeded ex-ante targets specified in the MTPs and this is the same case for tax revenues.
Another matter is the constant increase in public expenditures and tax revenues despite the fact that the economy fell short of the growth target and the inflation rate remained above the official target. It is known that above-target inflation during periods of high inflation will help achieve the tax revenue target. Today, the increase in tax revenue is quite a lot higher than both growth and inflation rates. However, it is remarkable that, despite that growth is below target, public expenditure has continued to increase. In view of the fact that growth slowdown means in a sense a decline in income, the state’s continuous at-tempts to collect even more taxes, despite the decrease in individuals’ income, is a practical reality that should be pointed out. This statistical data is available from the reports issued by statistical institutions and organizations.
Considering the facts set forth in this study, we can state that Turkey’s economic growth is not driven by the “private sector”. The public sector receives a larger share of effective demand and generated income, compared to the private sector. This share is getting bigger ever year, and accordingly public expendi-ture keeps on rising. For that reason, investment and consumption expendiexpendi-tures on the private side are mostly financed through loans. Due to over taxation and stringent regulations, the private sector slowly withdraws from certain industries. This is one the main reasons for the increasing current account defi-cit. Importing started to seem more reasonable than producing.
Given the fact that a large part of imports consists of raw material, intermediate goods and investment goods, high taxes and non-tariff barriers levied on imported final goods lead to higher costs of living, lower profit and bring negative impacts to bear on markets. Policies implemented to decrease the inter-est rate; savings gap and current account deficit usually fail or damage other components of economy when they are temporarily ameliorated. Therefore, the existing growth model must be modified – this topic is to be addressed in a forthcoming study. Additionally, considering governments’ unwillingness to modify the economic model, it is unquestionable that this issue requires some practical suggestions. As mentioned above, revenues and expenditures of the public institutions, except Central Government Budget, have been sharply rising since 2007. The fact that the number of independent institutions func-tioning as regulatory authorities keep increasing; municipalities’ undisciplined spending, and the con-tinuous growth of the budget of other annexed budget administrations proves the necessity of drawing up and adopting legal regulations with regard to the aforementioned institutions. By the rights granted to them, these institutions make capital and savings accumulation rather difficult by making cutbacks in markets on the grounds of growing trade volume. Furthermore, on the basis of the “spending is allowed if
71
there are available resources” principle, the more revenue these institutions bring in, the more they spend. New regulations should be drawn to limit their spending and public sector cuts must be reduced. A similar framework can be put into practice for Ministries and Institutions included in Central Govern-ment Budget. A budget prepared according to target inflation rate, instead of “estimated” needs might be a vigorous start. Regulations should lay down an inflation targeting condition for the Central Gov-ernment Budget, the number of institutions that are not included in the Central GovGov-ernment Budget should be reduced, and also their budget should be cut. Especially investment and consumption spend-ing made by municipalities should be audited thoroughly and regularly. It is necessary for the Parliament to switch to a more effective position than its former one in terms of public savings. It also appears that the Parliament has not been conducting a tighter audit on the amount, sources, nature and planning of public expenditure.
In conclusion, it does not seem possible to eliminate savings gaps that arise from the continuous expan-sion of the public sector without modifying or replacing the existing growth model. Regardless of which political party comes into power, it unfortunately looks like the public sector will continue expanding. In-creasing the ratio of Tax Revenues and various deductions to GDP; reducing Central Budget and other in-stitutions and organizations spending will only be possible in the short-term by closely monitoring the parliamentary parties and making amendments to laws and regulations on audit and supervision. The most certain and infallible way to increase the ratio of savings to GDP is to replace the existing growth model that is based on the “financing public expenditure through tax revenue; financing private con-sumption through borrowing” approach.
References
Alkin, Erdoğan. İktisat. İstanbul: Filiz Kitabevi, 2011.
Keynes, John Maynard. General Theory of Employment, Interest, and Money. London: Palgrave Macmillan, 1936.
Yereli, Ahmet Burçin, “Tasarruf Politikalarının Oluşumunda Vergi Sisteminin Rolü.” Maliye Yazıları 55 (1997): 64—87.
Yüksel, Cihan and Songur, Mehmet, “Kamu Harcamalarının Bileşenleri ile Ekonomik Büyüme Arasındaki İlişki: Ampirik Bir Analiz (1980-2010).” Maliye Dergisi 161 (2011): 365—380.