i
ARTIFICIAL OLFACTION WITH HOLLOW CORE
BRAGG FIBER ARRAYS
A DISSERTATION SUBMITTED TO
MATERIALS SCIENCE AND NANOTECHNOLOGY PROGRAM OF THE GRADUATE SCHOOL OF ENGINEERING AND SCIENCE
OF BILKENT UNIVERSITY
IN PARTIAL FULFILLMENT OF THE REQUIREMENTS FOR THE DEGREE OF
MASTER OF SCIENCE
By
Fahri Emre Öztürk
August, 2014
ii
I certify that I have read this thesis and that in my opinion it is fully adequate, in scope and in quality, as a thesis of the degree of Master of Science.
………. Prof. Dr. Mehmet Bayındır (Advisor)
I certify that I have read this thesis and that in my opinion it is fully adequate, in scope and in quality, as a thesis of the degree of Master of Science.
………. Assoc. Prof. Dr. Mecit Yaman
I certify that I have read this thesis and that in my opinion it is fully adequate, in scope and in quality, as a thesis of the degree of Master of Science.
………. Assoc. Prof. Dr. Selçuk Aktürk
iii
Approved for the Graduate School of Engineering and Science:
………. Prof. Dr. Levent Onural
iv
ABSTRACT
ARTIFICIAL OLFACTION WITH HOLLOW CORE BRAGG
FIBER ARRAYS
Fahri Emre Öztürk
M.S. in Materials Science and Nanotechnology Supervisor: Prof. Dr. Mehmet Bayındır
August, 2014
An optoelectronic nose for the analysis of alcohols (ethanol and methanol) in chemically complex environments is reported. The cross-responsive sensing unit of the optoelectronic nose is an array of three distinct hollow core infrared (IR) transmitting photonic band gap fibers (Bragg fibers), which transmit a specific band of IR light depending on their Bragg mirror structures. Presence of alcohol molecules in the optofluidic core quench the fiber transmissions if there is an absorption band of the analyte overlapping with the transmission band of the fiber. The cumulative response data of the fiber array enables rapid, reversible and accurate discrimination of alcohols in chemically complex backgrounds such as beer and fruit juice. In addition, we observed that humidity of the environment has no effect on the response of the optoelectronic nose, which is rarely achieved in gas sensing applications. Consequently, it can be reliably used in virtually any environment without pre-calibration for humidity or drying the analytes. To further improve the performance, we engineered the photonic bandgap of Bragg fibers by controlling the thickness profile of the fiber during the thermal drawing. Conical hollow core Bragg fibers were produced by thermal drawing under a rapidly alternating load, which was applied by introducing steep changes to the fiber drawing speed. In conventional cylindrical Bragg fibers, light is guided by omnidirectional reflections from interior dielectric mirrors with a single quarter wave stack period. In conical fibers, the diameter reduction introduced a gradient of the quarter wave stack period along the length of the fiber. Therefore, the light guided within the fiber encountered slightly smaller
v
dielectric layer thicknesses at each reflection, resulting in a progressive blueshift of the reflectance spectrum. As the reflectance spectrum shifts, longer wavelengths of the initial bandgap cease to be omnidirectionally reflected and exit through the cladding, which narrows the photonic bandgap. A narrow transmission bandwidth is particularly desirable in hollow waveguide mid-infrared sensing schemes such as the optoelectronic nose. We carried out sensing simulations using the absorption spectrum of isopropyl alcohol vapor to demonstrate the importance of narrow bandgap fibers in chemical sensing applications.
Keywords: Electronic noses, Photonic band gap fibers, Optofluidics, Adulterated
vi
ÖZET
İÇİ BOŞ BRAGG FİBER DİZİLERİ İLE YAPAY KOKLAMA
Fahri Emre Öztürk
Malzeme Bilimi ve Nanoteknoloji, Yüksek Lisans TezYöneticisi: Prof. Dr. Mehmet Bayındır
Ağustos, 2014
Bu çalışmada, kimyasal olarak karmaışk ortamlarda alkolleri (etanol ve methanol) analiz edebilen bir optoelektronik burun sistemi anlatılmaktadır. Optoelektronik burunun sensör dizisi üç tane içi boş, fotonik bant yapılı fiberden (Bragg fiber) oluşmaktadır. Bragg fiberler kızılötesi ışığı, fiberin Bragg ayna yapısı ile belirlenen belli bir spektrum bantında iletir. Fiberin opto-akışkan çekirdeğine bir kimyasal verildiğinde, kimyasal moleküllerinin soğurma bantları ile fiberin iletim bantı çakıştığı durumda fiberin ilettiği kızılötesi ışık şiddeti düşmektedir. Her bir fiberden alınan sinyalin karşılaştırmalı olarak analiz edilmesi ile alkoller karmaşık ortamlarda (bira veya meyve suyu gibi), hızlı, tekrarlanabilir ve güvenilir şekilde birbirlerinden ayırt edilebilmektedir. Ayrıca, optoelektronik burun sistemi nemden etkilenmeyecek şekilde tasarlanmıştır ki bu durum gaz sensör uygulamalarında nadir olarak başarılabilmektedir. Sonuç olarak geliştirilmiş optoelektronik burun sistemi dış ortamlarda ve nem için herhangi bir kalibrasyona gerek duymadan veya algılanmak istenen kimyasalları kurutmadan çalışabilmektedir. Sistem performansını daha da artırmak için, fiber kalınlık profili, fiber çekimi esnasında kontrol edilerek Bragg fiberlerin fotonik bant yapıları esnek biçimde tasarlanmıştır. Konik, içi boş Bragg fiberler termal fiber çekimi esnasında fiber üzerindeki yük keskin biçimde değiştirilerek üretilmiştir. Yükteki keskin değişim, fiber çekim hızının kontrolü ile sağlanmıştır. Geleneksel silindirik Bragg fiberlerde ışık, fiber içindeki tek bir çeyrek dalga istifi periyoduna sahip dielektrik aynalar vasıtasıyla iletilir. Konik fiberlerde, fiber boyunca kalınlıktaki azalma, fiber boyunca bir çeyrek dalga istifi periyodu
vii
gradyenti oluşmasını sağlamıştır. Bu şekilde fiber boyunca iletilen ışık her bir yansımada hafif biçimde incelmiş dielektrik katmanları ile karşılaşmaktadır, bu da fiber boyunca yansıma spektrumunun maviye kaymasına yol açmaktadır. Yansıma spektrumu maviye kaydıkça, fiberin başındaki fotonik banttaki daha uzun dalga boyları daha fazla yansıtılmamakta ve fiber kılıfından dışarıya çıkmaktadır ki bu da fiberin fotonik bantını daraltmaktadır. Dar iletim bantları özellikle optoelektronik burun gibi, içi boş dalga kılavuzu kullanılan orta-kızılötesi bölgedeki sensör uygulamaları için gereklidir. Dar fotonik bant yapılı fiberlerin kimyasal sensör uygulamaları için önemini göstermek amacıyla izopropil alkol buharının soğurma spektrumu kullanılarak algılama simulasyonları yapılmıştır.
Anahtar kelimeler: Elektronik burun, fotonik bant yapılı fiber, opto-akışkan, sahte içki,
viii
Acknowledgement
First and foremost I would like to thank my academic advisor, Prof. Mehmet Bayindir, for his support and guidance throughout my dissertation. He has provided me a broad view of the scientific community. I believe his open-minded and enthusiastic approach to research had invaluable contribution to my perspective on science.
Adem Yildirim was a second advisor to me through these two years. I cannot thank him enough for being a teacher, mentor and a friend. It was a unique opportunity to work with him. I wish him the best in his further studies, and I will be most interested to see what he will achieve as a scientist.
I have enjoyed working and exchanging ideas with the many interesting and talented characters of the Bayındır research group. They were the reason I felt at home in the laboratory and office. I would like to thank Urandelger Tuvshindorj, Muhammad Yunusa, Erol Özgür, Tamer Doğan, Bihter Dağlar, Pınar Beyazkılıç, Ersin Eroğlu, Mehmet Kanık, Murat Dere, Neşe Özgür, Ozan Aktaş, Girayhan Say, Emel Gürbüz, Dilara Oksüz, Tural Khudiyev, Bekir Türedi, Osama Tobail, Mostafa M. El-Ashry, Hale Nur Çoloğlu, Seyit Ali Yaşar, Pelin Tören and Gökcen Birlik Demirel for being there.
I would like to dedicate this thesis to the memory of Korkut Okan Ozansoy, my teacher and mentor during the graduate years at Ankara University. He has given me a strong background in electromagnetism, which has supported me at every step of these studies. But most importantly, he has taught me to never give up on what you believe is right. His never faltering energy to improve himself, the people around him and the world will be a candle showing the right direction to me in life. I know he would find many things to straighten if he had the chance to read this thesis. I will continue doing my best as a scientist and a person to be a worthy student to his efforts.
ix
x
Contents
Chapter 1 Artificial Olfaction ... 20
1.1 Introduction ... 20
1.2 The Mammalian Nose ... 23
1.3 Different Approaches for Artificial Olfaction ... 25
1.3.1 Metal Oxide Semiconductors ... 25
1.3.2 Metal Oxide Semiconductor Field Effect Transistors ... 26
1.3.3 Conductive Polymers ... 27
1.3.4 Carbon Nanotubes ... 28
1.3.5 Quartz Crystal Microbalance Sensors ... 28
1.3.6 Microcantilevers ... 29
1.3.7 Colorimetric Sensor Arrays ... 29
1.3.8 Fluorescence Sensors ... 30
Chapter 2 Optoelectronic Digital Nose ... 33
2.1 Chemical Identification with the Cross Response of the Fiber Array ... 34
2.2 Effect of Fiber Transmission Bandwidth to Performance ... 38
Chapter 3 Bragg Fibers ... 42
3.1 Dielectric Mirrors ... 42
3.2 History of the Bragg Fiber ... 42
3.3 Fabrication of Hollow Core Polymer/Chalcogenide Bragg Fibers ... 43
3.3.1 Polymer Material Choice ... 44
3.3.2 Thickness Measurement of Polymer Films ... 45
xi
3.3.4 Chalcogenide Thin Film Coating on Polymer Films... 49
3.3.5 Preform Preparation ... 50
3.3.6 Fiber Drawing ... 52
Chapter 4 Counterfeit Alcoholic Beverage Detection with the Optoelectronic Nose ... 54
4.1 Pattern Recognition with Hierarchical Cluster Analysis ... 54
4.2 Fiber Array Design ... 56
4.3 Array Response to Mixtures and Real Samples ... 60
Chapter 5 Photonic Bandgap Engineering of Bragg Fibers for Enhanced Performance... 70
5.1 Fabrication of Conical Bragg Fibers ... 70
5.2 Photonic Bandgap Narrowing in Conical Bragg Fibers ... 72
5.3 Advantages of Narrow Photonic Bandgaps ... 79
Chapter 6 Conclusions ... 81
xii
List of Figures
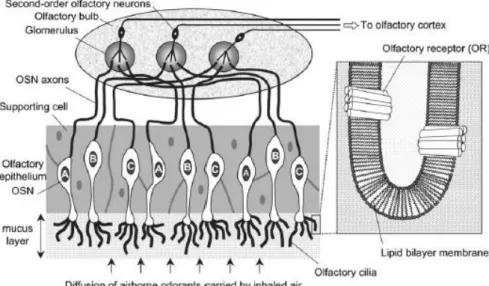
Figure 1 When any volatile molecules reach the nasal cavity, they diffuse through the mucus and reach olfactory receptors. Olfactory receptors produce a signal after the interaction with molecules if the receptor is responsive to that particular molecule. The signals are carried with olfactory sensory neurons to the olfactory bulb. The axons of the olfactory sensory neurons converge in the olfactory bulb, where the signal is directed to the olfactory cortex [6]. ... 24
Figure 2 Design of a typical MOSFET [40]. ... 27
Figure 3 Colorimetric sensor array responses for volatile organic compounds produced by 10 different bacteria species [43]. The color patterns are different for each of the 10 bacteria species, which demonstrates the very high selectivity of the sensor array. . 30
Figure 4 Microsphere fluorescence sensor array [40]. ... 31
Figure 5 (a) Preparation of the microsphere array on the fiber tip. (b) Measurement and signal reading [45]. ... 32
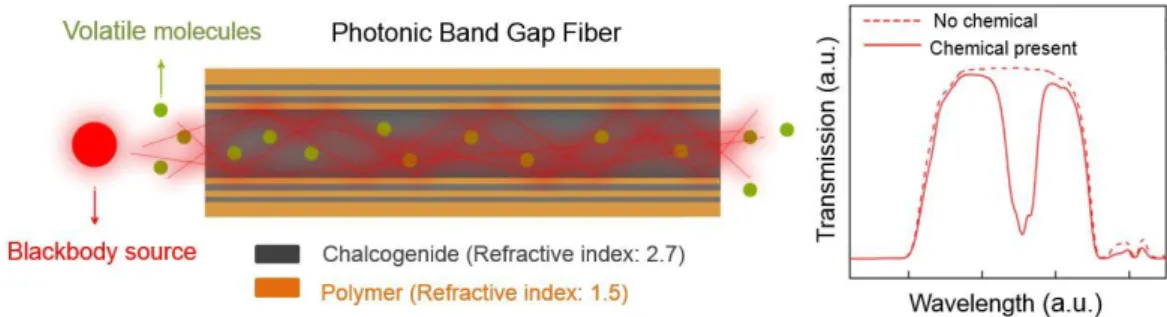
Figure 6 Infrared absorption measurement inside the hollow core Bragg fibers. Bragg fibers guide electromagnetic radiation with in-built chalcogenide/polymer dielectric mirrors. The blackbody radiation is coupled to the hollow core of the fiber and volatile molecules of the analyte are introduced into the hollow fiber core simultaneously. In the presence of the analyte, the transmission of the fiber is quenched, which allows the detection of the analyte. ... 35
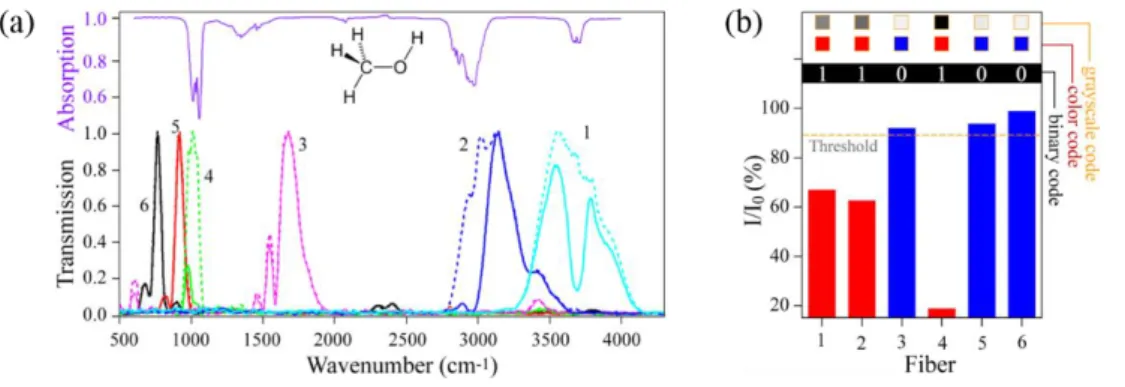
Figure 7 Response of an array of six fibers to methanol. (a) The transmission spectra of the fibers are shown along with the absorption of methanol, the measured analyte.
xiii
Transmission of the fibers are quenched where there is an overlap between the photonic bandgap of the fiber and the absorption band of the analyte. (b) The response of the fiber array as a binary code. A threshold value of about 85% was used to register the array response in ones and zeroes. With this approach it is possible to describe methanol in binary code as ‘110100’. The quenching of the fibers are also shown in gray scale color code [26]. ... 36
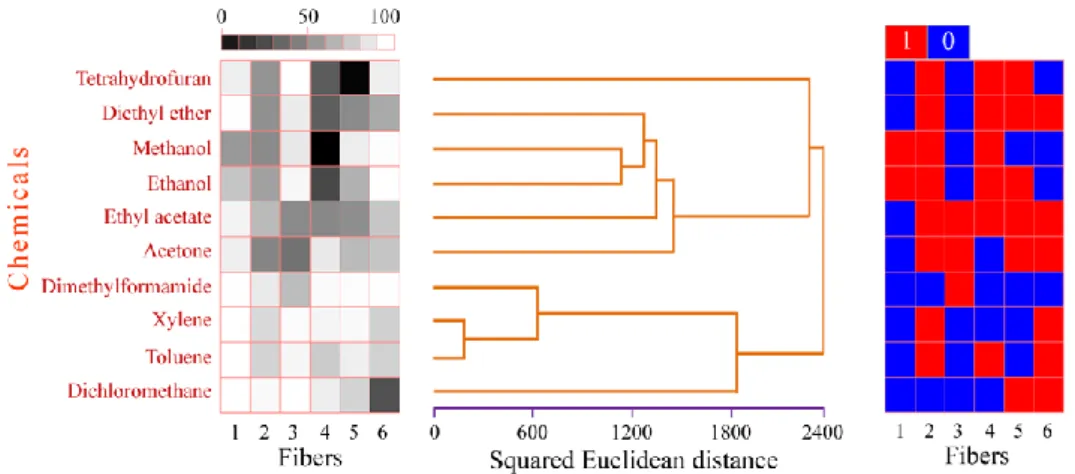
Figure 8 Ten chemicals measured with the optoelectronic nose and the analysis of fiber array response data. Hierarchical cluster analysis of the array response classifies chemicals demonstrating the selectivity of the approach. Also, it is possible to tag each of the ten chemicals with a specific binary code [26]. ... 37
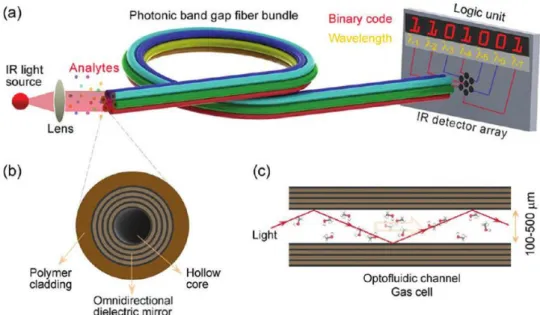
Figure 9 Digital optoelectronic nose scheme. (a) An ordinary blackbody source such as a heated filament is used. The broadband radiation is coupled to the fibers, and analytes are introduced to the hollow core of the fibers simultaneously. The array response is measured with an array of infrared detectors. The quenching in the transmission of each fiber is registered to identify the chemical and tag the chemical with a binary code. (b) Representative cross section of hollow core Bragg fibers. The hollow core is surrounded by polymer/chalcogenide dielectric mirrors. (c) The light is guided by omnidirectional reflections from the dielectric mirrors inside the hollow core of the fiber. The hollow core functions as the gas cell as well as the waveguide [30]. ... 38
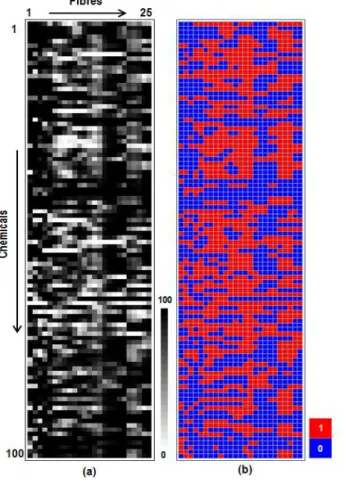
Figure 10 Response of a 25-fiber sensor array. (a) The gray scale representation of the fiber responses is shown for each fiber and chemical combination. (b) Binary codes of each chemical obtained with a threshold number of 91%. The array tags each chemical with a unique binary code [30]... 39
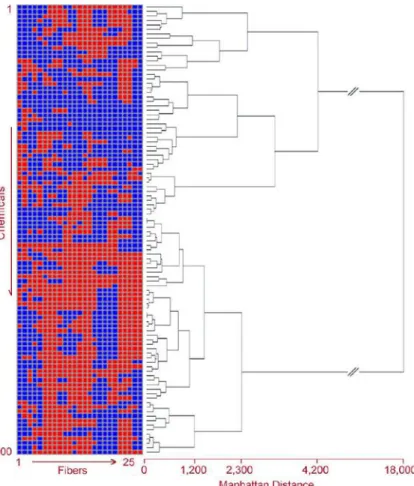
Figure 11 Hierarchical clustering analysis of the 25-fiber array response and the binary codes of each chemical assigned by the array. Successful classification and binary tagging of 100 chemicals was possible with the array of 25 fibers [30]. ... 40
xiv
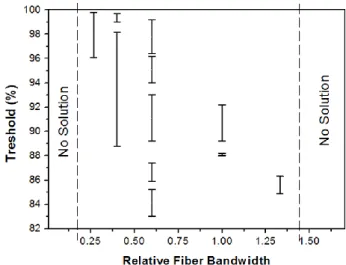
Figure 12 The relation between photonic bandgap of the fibers and the threshold bandwidth. Fibers with potonic bandgaps at the same spectral position but with different bandwidths were studied. The threshold bands were calculated for the previous 100 chemicals. Bandgap narrowing widens the threshold bands to some extent, demonstrating enhanced selectivity. However the threshold bandwidth disappears for too narrow or too wide photonic bandgaps, showing that extreme narrowing or widening of the photonic bandgap is not favorable for selective detection. ... 41
Figure 13 Infrared absorption spectra of the candidate polymer materials for fiber fabrication. (a) Polycarbon (PC), (b) polyetherimide (PEI), (c) polysulphone (PSU), (d) polyethershulphone (PES). ... 45
Figure 14 Thickness measurement of polymer films with fringing. (a) The fringing pattern in the reflection spectrum of PES measured by a FTIR microscope. (b) The 3149 cm-1 – 3470 cm-1 region which was used for thickness measurement. The thickness of the polymer films was measured as 48.7 µm with the method. ... 46
Figure 15 SEM Images of PES films before the application of plasma (a) and after the application 180W plasma for 12 minutes (b). The roughness of the polymer film surfaces increase significantly after the application of plasma. ... 47
Figure 16 FTIR microscope reflectance of PES films before (blue) and after the application of plasma (red). The fringing effect disappears after the plasma application. ... 48
Figure 17 The change in CA of PES films with plasma power and application time. (a) CA values decrease with increasing plasma power and application time. (b) CA values of PES films before plasma and after the application of 180 W plasma for 12 min. . 49
xv
Figure 18 Chalcogenide coating of the PES films. (a) As2Se3 ingots are grinded to
obtain very fine powder for thermal evaporation. (b) PES films with thin film chalcogenide coating at both sides. The surface of the coated films is very smooth which is critical for preparing low loss fibers. ... 50
Figure 19 Steps of the preform preparation. (a) Polymer/chalcogenide composite films are rolled around a glass rod. (b) The polymer part which will form the cladding is obtained by rolling bare PES films around the composite structure until the desired preform diameter is reached. (c) The preform is covered by Teflon tape to protect it from extra heat during the consolidation. (d) The composite preform which is ready for drawing after consolidation and etching of the glass. ... 51
Figure 20 The fiber tower and hollow core Bragg fibers. (a) The custom made fiber tower of Bayındır Group laboratories is used for fabrication of various functional fibers. (b) The Bragg fibers obtained by thermal drawing of the preform. Meters of fibers can be drawn with a single fabrication step. ... 53
Figure 21 Optoelectronic nose measurement. Analyte vapors were introduced to the fiber cores with nitrogen as carrier gas using a mass flow controller (MFC). IR light from the broad band source of an FTIR was coupled to the fiber. Measurements were taken from each fiber by rounds. IR detector of the FTIR (uncooled DLATGS) was utilized for measuring total transmitted intensities of the fibers. ... 57
Figure 22 (a) SEM images of in-fiber Bragg mirror structures. Infrared light transmitting bands of the fibers are controlled by the thickness and refractive index parameters of the periodic structure. The gradual decrease in layer thicknesses of the fibers is apparent as transmission band shifts to higher wavenumber values. (b) Measured transmission spectra of the three fibers used in this study. It is possible to design a fiber array for a specific application by adjusting the transmission bands of the fiber so that they correspond to major absorption lines of analytes. Inset shows the
xvi
photograph of hollow core infrared photonic bandgap (PBG) fibers demonstrating their flexibility. ... 58
Figure 23 Quenching of fiber transmissions due to absorption of light by the analyte inside the fiber. Absorption spectra (purple lines) of the analytes and transmission spectra of fibers before (dashed lines) and after (solid lines) analyte introduction, (a) for ethanol, (b) for methanol and (c) water. Insets in (b) are close up views of fundamental and second order bands of fiber 1. ... 59
Figure 24 (a) Intensity ratio of the fibers before and after introduction the ethanol, methanol and water mixtures at different concentrations. Each fiber respond differently to the alcohol containing mixtures in a concentration dependent manner. None of the fibers show any response against pure water, indicating that the response of the fiber array is independent of the humidity of the environment. The analytes are named with the number in the abbreviation showing the analyte volume percentages and letters in the abbreviations are the initial letters of the analytes, such that 20E+20M is the solution containing 20% ethanol and 20% methanol. (b) Blue scale representation of the response of each fiber. White corresponds to a 100% intensity drop and blue corresponds to 0%. (c) Hierarchical cluster analysis of alcohol mixture measurements. Horizontal length scale shows how ‘similar’ the analytes are according to the sensor array. The overall response of the sensor array shows a clear discrimination for alcohol mixtures of different concentrations. ... 62
Figure 25Thequenching of the fiber transmissions can be analyzed for not just the discrimination of two different alcohols, but also for a quantitative analysis of the alcohol concentrations. (a) And (c) show quenching of fiber 2 transmission spectrum for different concentrations of ethanol and methanol, respectively. The increase in analyte concentration results in more absorption of radiation within the fiber. In (b) and (d) quantitative analysis is presented, three measurements were taken at each concentration showing the high linearity of the fiber response. ... 63
xvii
Figure 26 (a) Transmission spectra of fiber 2 before and after 5% methanol vapor introduction. Inset shows I/I0 ratios of five repeated measurements. (b) Hierarchical
cluster analysis of ethanol and methanol mixtures in water. Repeated measurements of 5% ethanol, 5% methanol and pure water are correctly clustered by the algorithm. This demonstrates the accuracy of the optoelectronic nose concept. Abbreviations indicate analyte name and percentages, such that 5E is the solution containing 5% ethanol. . 65
Figure 27 Hierarchical cluster analysis of ethanol or methanol adulterated non-alcoholic beer (a) and mixed fruit juice (b). In an environment with various volatile organic compounds, it is possible to distinguish methanol adulterated beverages. Abbreviations indicate analyte name and percentages, such that 5E is the solution containing 5% ethanol in beer or in fruit juice. B and FJ are abbreviations for non-alcoholic beer and mixed fruit juice backgrounds, respectively. ... 67
Figure 28 (a) Thermal drawing of conical hollow core Bragg fibers. The preform is fed into the tower furnace (at 298 oC) with a constant down feed speed 𝑣𝑑. The
macroscopic structure of the preform is scaled down to the micro scale by adjusting the capstan speed (i.e. the drawing speed) 𝑣𝑐. (b) Steep changes in the capstan speed 𝑣𝑐 result in the formation of node structures on the fiber and create conical hollow core Bragg fibers at both ends of the node. (c) A conical fiber with a 40% diameter reduction; the diameter at the base of the conical fiber is 3 mm, whereas the diameter at the tip of cone is 1.8 mm. ... 72
Figure 29(a) Segments of a conical hollow core Bragg fiber and scanning electron micrographs of their respective dielectric mirror structures. The dielectric mirror period decreases gradually from Ʌ1 = 2.82 µm to Ʌ4 = 2.5 µm along the 235 mm fiber (scale bar: 5 µm). (b) Transmission spectra taken after cutting each segment off the fiber. The spectrum in the first column is taken from a section comprising 50 mm of fiber from the base of the cone, with a dielectric mirror period Ʌ1 = 2.82 µm. The spectrum in the second column is taken from a section comprising a 90 mm length of fiber with a dielectric mirror period gradient of Ʌ1 = 2.82 µm to Ʌ2 = 2.79 µm.
xviii
Spectra in the third and fourth columns were taken from sections of 140 and 235 mm, respectively. The purple spectrum is the transmission of polyether sulphone (PES). 74
Figure 30 (a) Transfer matrix method (TMM) simulations for reflections from two dielectric mirror structures (initial and final) with dielectric mirror periods of Ʌ𝑖 = 2.6µm (red line) and Ʌ𝑓 = 2.3µm (blue line), and successive reflections from initial and final structures (green line). (b) TMM simulation for the narrowing of the photonic bandgap in conical Bragg fibers as a function of diameter reduction percentage. White dashed line marks a diameter reduction percentage of 11%, matching the fibers characterized in Figure 2. ... 76
Figure 31(a) Measured transmission spectra of two standard Bragg fibers; one with a large diameter (blue line) and the other with a smaller diameter (red line), and a conical Bragg fiber. The conical fiber has a dielectric mirror period gradient between the dielectric mirror periods of the thick and thin standard fibers (Ʌ𝑖 = 2.8 µm to Ʌ𝑓 = 2.3 µm). The transmission spectrum of the conical fiber is at the overlap of the two standard fibers. In addition, the 2nd order band is absent in the conical fiber, though it exists at wavenumbers around 2750 cm-1 and 3250 cm-1 for standard fibers. (b) Simulations for the thick standard fiber (upper part) and conical fiber (lower part) that take angle dependency of reflections and material absorptions into account. ... 78
Figure 32 Simulated responses of standard and conical hollow core Bragg fibers to isopropyl alcohol (IPA) vapor. (a) Transmission of the standard and conical fibers before (dashed line) and after (solid line) the introduction of IPA. The purple line is the transmission spectrum of IPA vapor. Transmission is strongly quenched after the introduction of the analyte for the conical fiber, whereas quenching is weak for the standard fiber due to the wide transmission band. (c) Fiber response; ((𝐼0 − 𝐼)/𝐼0) ∗ 100, as a function of diameter reduction percentage, where 𝐼0 is the total transmitted intensity before analyte introduction and 𝐼 is the intensity after analyte introduction. There is an exponential increase of fiber response with decreasing cone diameters. 80
xix
List of Tables
Table 1 (I/I0) Ratio between total transmitted intensity before (I0) and after (I)
interacting with the analyte for ethanol (EtOH) methanol (MeOH) mixtures for concentrations varying in the range of 5% to 40%. ... 61 Table 2 (I/I0) between total transmitted intensity before (I0) and after (I) interacting
with the analyte for repeated measurements of 5% ethanol (EtOH), 5% methanol (MeOH) solutions and water. ... 66 Table 3 (I/I0) between total transmitted intensity before (I0) and after (I) interacting
with the analyte for repeated measurements of 5% ethanol (EtOH), 5% methanol (MeOH) adulterated beer mixtures and nonalcoholic beer. ... 68 Table 4 (I/I0) between total transmitted intensity before (I0) and after (I) interacting
with the analyte for repeated measurements of 5% ethanol (EtOH), 5% methanol (MeOH) adulterated mixed fruit juice and unadulterated mixed fruit juice (FJ). ... 69
20
Chapter 1
Artificial Olfaction
1.1 Introduction
Analysis of deleterious chemical substances in end-user products (complex environments containing several diverse components) is of great interest in food, biomedical, and chemical industries in terms of quality control and public health [1, 2]. The most common analytical methods to discriminate chemicals in complex environments are spectroscopic techniques, often coupled with chromatographic methods, such as gas chromatography/mass spectroscopy (GC/MS). Although such methods ensure high sensitivity, they are usually unable to differentiate similar chemicals in mixtures [3]. Also, they are expensive, labor intensive, time consuming and not portable. Therefore, rapid, cost effective and portable sensors with good sensitivity and selectivity are highly demanded for in-situ analysis of chemicals in complex environments.
A promising way to detect a single chemical in complex mixtures or to differentiate similar mixtures from each other is using array based sensors, so called artificial noses [4, 5]. Sensor arrays in artificial noses mimic the cross-responsive olfactory receptors of the mammalian nose, where each sensor element loosely interacts with a large numbers of analytes. The combined response of these sensor elements produces a ‘signature’ for each odor, which is identified by the brain. This combinatorial approach enables detection of large numbers of odors with much fewer receptors. For instance, human nose uses around 400 different receptor proteins in order to discriminate about
21
10000 odorants [6-8]. An additional feature of the mammalian nose is its naturally evolved ability to discriminate mixtures from each other, as odors in nature are mostly complex mixtures of several chemicals. Although mammalian nose usually cannot identify the components of mixtures, especially when the mixture is ternary or more, it can sense slight changes in the composition of mixtures. Each mixture, with its composition and concentration leads to a distinct response, therefore our olfactory system can discriminate complex odors and decide their strength by handling them as a single analyte. In analogy, artificial noses discriminate mixtures from each other without individually analyzing each component of the mixture [4].
Initial artificial noses utilize mostly electrical [9-13] (e. g. metal oxide and polymer semiconductor arrays) and mechanical transducing elements [14-17] (e. g. differently functionalized micro cantilevers and QCM and SAW sensors). In these schemes electrical or mechanical properties of each sensor element shifts as a response to the sorbed chemical species. Ever since the first prototypes, the design parts of electronic noses has barely changed, electronic noses invariably comprise of an array of broadly responsive sensing elements, coupled with a pattern recognition software to sort out the recorded half-fuzzy data for the precise yet ephemeral smell information. Later, optical smelling gadgets (i. e. optoelectronic noses) have also arisen, incorporating fluorescent dye coated optical fibers [18-20], colorimetric dyes [21-23], or mesoporous Bragg mirrorarrays [2, 24]. These methods detect odorants based on changes in an optical property (e. g. fluorescence, refractive index or absorbance) of an active layer (e. g. dye doped polymers). Optical transducing schemes enable to produce more compact artificial noses with low power consumption. Also, they have been successfully applied for discrimination of complex mixtures such as coffee aromas and soft drinks [1, 25]. However, their response and signal regeneration (recover) times are relatively long because the analytes must first diffuse into the active layer and then desorbed to the environment for each measurement. In addition, once the analytes diffuse into the active layer, they can irreversibly change the properties of the layer which constrains their reusability.
Recently, Bayındır Group researchers have developed a distinct optoelectronic nose concept using hollow core photonic band gap (PBG) infrared transmitting fiber arrays [26]. In this design, analytes are detected through their infrared absorption in
22
microfluidic channels of the fibers, which enables direct smelling of the odors, without the need of an active layer. Thus, with such an optofluidic [27] approach odors can be detected and response signal can be generated in less than a second without any baseline drift of the initial signal. The fibers are produced by thermal drawing method [28, 29] and can guide a specified spectral band of infrared light, which is determined by their Bragg structure. It was shown that using this novel concept, as many as 10 chemicals can be selectively and sensitively identified [26]. Also, theoretical calculations revealed that it is possible to differentiate 5 chemicals and their 26 possible binary, ternary, quaternary and quinary mixtures with the optoelectronic nose [30].
In this work, we demonstrate that the optoelectronic nose can operate in complex chemical environments. For this purpose, we tested solutions of two very similar chemicals (ethanol and methanol) in complex environments (beer and fruit juice) with the optoelectronic nose [31, 32]. The discrimination of these two resembling alcohols from each other is particularly important to detect falsified alcoholic beverages, in which methanol is used instead of ethanol. While methanol is cheaper than ethanol, it is very toxic to humans; ingestion of as little as 10 mL can cause blindness and an amount of 30 mL can be fatal [33]. In order to detect toxic methanol containing alcoholic beverages, we prepared an optoelectronic nose using three optofluidic PBG fibers, which have different spectral positions in the infrared region. The spectral positions of the fibers were determined according to Fourier Transform Infrared (FTIR) spectra of ethanol and methanol, to match their absorption bands with the fiber transmissions. Initially, we tested the optoelectronic nose using binary and tertiary mixtures of ethanol, methanol and water and it was observed that the optoelectronic nose can rapidly (in a few seconds) and reversibly discriminate tertiary mixtures even at low alcohol concentrations. Typically, it is very challenging for electronic noses to smell in highly humid environments because water can strongly interact with most types of sensor elements (e. g. metal oxide and conjugated polymer sensors) and largely block the signal obtained from the analytes [34]. Therefore, before measurements, analytes must be dried in some manner. On the other hand, the optoelectronic nose can directly analyze the alcohols even in 100% humidity since water vapor does not have any absorption band that overlaps with the transmission
23
bands of the fibers; therefore water does not affect the IR transmission of fibers (the sensor response). Additionally, we showed that the optoelectronic nose can discriminate methanol containing (falsified) beverages from ethanol containing beverages using non-alcoholic beer and mixed fruit juice as complex backgrounds.
The sensitivity of the optoelectronic nose was found to be at low ppm levels. Whereas this sensitivity level is adequate for some applications such as counterfeit beverage detection, ppb level sensitivity is required for other applications such as disease diagnosis or food quality control. Therefore, improving the performance of the system was the next logical step. In the previous studies of Bayındır Group researchers, it was shown theoretically that the selectivity of the optoelectronic nose was highly dependent on the photonic bandgap of the fibers [30]. In this study, narrow photonic bandgaps increased the threshold bandwidth, which is a measure of the selectivity of the system. In the experimental studies, we observed that typically large bandgaps of Bragg fibers could hinder the selectivity of the system [31]. Additionally, as the photonic bandgaps of Bragg fibers are often larger than the absorption bands of analytes, transmission does not quench at the whole bandgap region even in the presence of analyte. Therefore, large photonic bandgaps have adverse effects on the fiber response as well as the selectivity. We engineered the photonic bandgap of Bragg fibers to achieve narrow band transmission and enhance the optoelectronic nose performance [35]. To narrow the bandgap, a gradient of the quarter wave stack period was achieved along the length of the fiber by introducing a conical shape to the fiber during the thermal drawing. About twofold narrowing of the fundamental transmission band was achieved, and higher order bands were eliminated in conical hollow core Bragg fibers.
1.2 The Mammalian Nose
Through the sense of smell, many living organisms can identify a large number of volatile chemicals. The human nose, for instance, can discriminate up to an amazing number of 10000 chemicals. In addition to this excellent selectivity, human noses have very rapid response times which can alarm us in the case of a fire with sub-second rapidness. Moreover, the human nose has a staggering sensitivity of detecting a single
24
molecule among a billion others [36]. All of the odor molecules, with their particular shape, size, functional group, and charge combination, interact differently with the olfaction system to give different sensations. Even a slight difference in the structure of an odor molecule can change its sensation. The mammals achieve this impressive diversity with their ~1000 olfactory genes, which is the 3% of their entire genome and demonstrates the complexity of olfaction system [37]. This complex olfaction process provides vital information to living organisms for locating foods, identifying predators and toxic compounds and choosing their mates.
Figure 1 When any volatile molecules reach the nasal cavity, they diffuse through the mucus and reach olfactory receptors. Olfactory receptors produce a signal after the interaction with molecules if the receptor is responsive to that particular molecule. The signals are carried with olfactory sensory neurons to the olfactory bulb. The axons of the olfactory sensory neurons converge in the olfactory bulb, where the signal is directed to the olfactory cortex [6].
The first constituent of the olfactory system (Figure 1) is the olfactory receptors (ORs) which are located at the cilias of olfactory sensory neurons (OSNs). Airborne odorants are carried by inhaled air inside the nose and there they interact with ORs. When an odorant interacts with ORs, it causes a structural change in the ORs and activates a cascade of events that lead to nerve cell signal. This signal is transmitted to the olfactory bulb and then to the olfactory cortex of the brain. The olfactory cortex sends the olfactory information to several number of brain areas where it is believed the sensation of odors is formed. Humans have around 400 type of ORs, yet they can
25
smell approximately 10000 odors. So, it is apparent that single OR does not interact with a single odor molecule like a “lock and key” interaction. In fact, it was shown that an OR gives response against several odorants and a single odorant formed responses in several ORs. The combination of all responses of all ORs gives the sensation of odors by pattern recognition of the produced signal in the brain [38].
Inspired by natures’ cross-responsive olfaction mechanism, several sensor arrays (often named as electronic noses) for artificial olfaction has been developed. In electronic noses, array of different sensors which are sensitive to the large number of chemicals are used, instead of classical lock and key type of sensors. The cumulative signals obtained from broadly cross-reactive sensors are processed using pattern recognition methods to identify the odors. This strategy provides detection and identification of various analytes including complex odors (e.g. coffee and perfumes) simultaneously [39]. Also, electronic noses can detect odorless chemicals such as carbon monoxide and water. These features of electronic noses make them promising candidates for several applications including food and beverage control, disease diagnosis and environmental monitoring.
1.3 Different Approaches for Artificial Olfaction
In 1982, the first electronic nose which consisted of a simple metal oxide sensor array was reported [9]. In this study, an array of three titanium oxide gas sensors were used to classify several chemicals. After this pioneering work, several sensor arrays were developed utilizing different transducing mechanisms, for example, metal oxide semiconductors, chemiresistors, fluorescent dye coated fiber optic microarrays, colorimetric dyes and nanoparticles, mesoporous Bragg layers and photonic bandgap fibers. In this chapter we will focus on different transducing schemes which are used in artificial noses.
1.3.1 Metal Oxide Semiconductors
Main elements of a metal oxide semiconductor (MOS) sensor are a metal oxide thin film, a heating element and electrical contacts. SnO2 is most commonly used as
26
the oxide material, but tungsten, titanium and zinc oxides are also used. The n-type semiconductor oxide material is the active surface of a MOS sensor. The molecules adsorbed on the surface make a trade of electrons with the surface molecules and this causes a change in the conductivity of the semiconductor. In the presence of H2adsorption, for instance, hydrogen reacts with oxygen and electrons are released
back into semiconductor which results in a higher conductivity. Various surface effects and chemical reactions such as these, result in a cumulative change in conductivity which can be measured and characterized for the detection of different chemicals[40]. It is possible to alter the sensitivity of a MOS sensor by changing the material of the oxide film, or doping the semiconductor with metal catalysts (such as lead, platinum or palladium) and controlling the temperature. MOS sensors are relatively easy to manufacture and easily obtainable as they were the earliest commercialized devices. However, temperature dependence of these sensors is a negative aspect as this may result in a false signal with temperature change of the environment. Humidity is also a problem for MOS sensors, the change in the humidity affects surface properties which may result in a false signal.
1.3.2 Metal Oxide Semiconductor Field Effect Transistors
In metal oxide semiconductor field effect transistor (MOSFET) sensors, a change of voltage with exposure to the analyte is measured. First MOSFET gas sensor was introduced in 1975. The device proposed in this study utilized a palladium gate and was used to detect hydrogen.
27
Figure 2 Design of a typical MOSFET[40].
Typical MOSFET design has p-type silicon as base and n-type silicon as source and drain, and gate material deposited on n-type semiconductor (Figure 2). This is a basic transistor design where a voltage applied to gate causes a current flow between force and drain. When a chemical is adsorbed on the MOSFET, the voltage required for a particular value of current is changed. Humidity and temperature are again performance issues for MOSFET sensors.
1.3.3 Conductive Polymers
For gas sensing applications, polymers based on the monomers of pyrole, aniline, thiophene, and acetylene are used most frequently. Chemical or electrochemical interactions with analytes causes these initially insulating polymers to become conductors. The response mechanism of conductive polymers (CP) to organic vapors is not thoroughly studied. However, main mechanism that causes conductivity change is thought to be polymer swelling. Hydrogen bonding may be playing a role when the analyte is forming hydrogen bonds with the polymer backbones. Consequently, as the electron density changes in the polymer, the conductivity changes measurably. Thus, the difference in resistance indicates analyte exposure.
Some CPs are have detection limits as low as 0.1ppm for particular vapors. Polymerization conditions and the type of monomer are factors that affect the performance of a CP sensor. As other electrical based artificial olfaction devices, CPs are also sensitive to humidity. Even with these disadvantages, they have found use in industry and were commercialized by several companies.
28
Composite conductive polymers are a particular type of CPs in which insulating polymer is blended with a conducting material. As the conductive material, carbon black, graphite or metal powders are frequently used. In the design of a sensor, the polymer-conductive material mixture is deposited between metal electrodes. This structure allows a current to flow between electrodes. A large variety of materials is available for this kind of sensor design. Some examples are acrylates, styrene and vinyl alcohols. In more recent studies molecules such as tetracosane and metallophtalocyanine are also incorporated for active layers [40].
1.3.4 Carbon Nanotubes
Single walled carbon nanotubes (SWCNT) have also found use in sensing applications. A SWCNT is a hollow tube which is 1nm in diameter, which conducts electricity along cylindrical axis. A SWCNT sensor is similar to MOSFET in design, but the gate material is a randomly distributed matrix of SWCNTs. A change in conductivity or capacitance can be measured for the detection of analyte. In both systems, SWNCT matrix is the active area where the analyte is adsorbed. The adsorbed analyte alters the charge carrier density (electron density) in carbon nanotube network, with mechanisms similar to SnO2 active surface of MOS devices. In the capacitance
mode, adsorbed analytes cause a change in the electric field of SWCNT network. This causes the capacitance to change which can be measured to detect analytes. Carbon nanotube sensors offer a better performance for low vapor pressure compounds and better selectivity. Yet fabrication is harder compared to other electrical sensor types[40].
1.3.5 Quartz Crystal Microbalance Sensors
Quartz crystal microbalance (QCM) is a type of acoustic wave device. Usually it is single quartz crystal (more generally, any piezoelectric crystal) coated with a sorbent (active) layer. Two electrodes are positioned on the opposite sides of the crystal. Adsorbance of the analyte to the coating causes a change in the total mass of the crystal. Mass change gives rise to a change in the resonance frequency of the
29
piezoelectric crystal, which can be measured [40]. Coating choice is the most important parameter in a QCM, the active layer should selectively and sensitively respond to analytes. There is significant freedom for coating choice, some examples are ZnO films and phytalocyanines [41, 42]. Masses as small as 1ng are detectable with this method but sensitivity to temperature and humidity are issues similar to other electrical sensors.
Surface acoustic wave sensors (SAW) are the same as QCMs except that in the SAW sensors both electrons are at the same surface of piezoelectric crystal. Consequently, oscillations travel on the surface and not through the bulk of crystal. SAW sensors are structurally more appropriate to be incorporated in miniaturized devices. But they also need to be operated at higher frequencies than QCMs, which results in higher noise levels.
1.3.6 Microcantilevers
Microcantilevers are microscale thin membranes coated with an active layer. The two layered membrane oscillates due to the difference in thermal expansions of the two materials. For the membrane, silicon or silicon nitride are commonly used materials. The active layer is the chemically selective coating, where the analytes are adsorbed upon exposure. This causes the resonance frequency of the system to change, and membrane starts to oscillate at a different frequency. Oscillation frequency can be measured by optical methods (similar to the system used on tips of AFMs) or by capacitic or piezoelectric means [40]. Coating choice can be a variety of materials such as coated gold and polymers. Their microscale structures makes this type of sensors very sensitive, with detection limits at picogram levels.
1.3.7 Colorimetric Sensor Arrays
Colorimetric sensors are special dyes that change color with exposure to an analyte. This change of color can be measured with optical methods as well as the naked eye. Very selective chemical classification can be achieved by registering the cross response of an array of colorimetric sensors, where each dye responds not just one but
30
a set of chemicals. In Figure 3, the response of a colorimetric sensor array to the volatile organic compounds produced by 10 different bacteria species is shown [43]. In addition to the high selectivity, sub-ppm detection limits have been reported for colorimetric sensor arrays [21]. As the chemically active dyes, metalloporphyrins, solvatochromic dyes and pH sensitive dyes have been used commonly. Fabrication process involves printing sol-gel and dye mixtures onto an inert surface such as reverse phase silica gel, acid free paper or porous polymer membrane. Dye-analyte interaction occurs by hydrogen bonging, Lewis acid-base interactions and physisorption [40]. Most of other sensing technologies (such as QCMs, microcantilevers, MOS or MOSFET devices) work on physical interactions i.e. van der Waals forces between the analyte and the active layer. Incorporation of chemisorption besides physisorption increases selectivity considerably [1]. Colorimetric sensor arrays have commercialized by ChemSensing, Inc. which later changed name to iSense [40].
Figure 3 Colorimetric sensor array responses for volatile organic compounds produced by 10 different bacteria species [43]. The color patterns are different for each of the 10 bacteria species, which demonstrates the very high selectivity of the sensor array.
1.3.8 Fluorescence Sensors
Fluorescence sensors operate with the same principles as colorimetric sensor arrays except the type of dyes used. Dyes used in fluorescence sensors exhibit a change in fluorescence emmitance with exposure to an analyte. First prototype of this system incorporated an optic fiber bundle with each fiber’s end coated with a different dye.
31
The free end of the fibers were attached to a microscope to observe the fluorescence response to chemicals. The second generation of this technology, which was also developed by the same group incorporated a polymer or silica microsphere sensor array immobilized on fiber tips (Figure 4) [18]. Dyes are embedded in these microspheres. When exposed to analyte, the total sensor array response in fluorescence changes is measured. This produces a specific signal for each analyte similar to the colorimetric sensor arrays. Yet this time sensor numbers are not in tens, but in the scale of thousands. A circle of 1mm diameter has about forty thousand sensors, which is the highest density of sensors achieved in artificial noses. With the increasing sensor count, the systems signal to noise ratio is improved [40].
Figure 4 Microsphere fluorescence sensor array [40].
The change in the fluorescence response of the dye molecules are related with the physical and chemical properties such as; shape, size and polarity of the analyte and the polymer matrix in which the dye molecules are trapped. A charge coupled device (CCD) is used to monitor the fluorescence response change of fiber facets in the fiber bundle individually. The complex and time-dependent cross responsive signals obtained from the fiber bundle enables multi-analyte detection. The video images obtained from fiber bundle are used as input signals to train the artificial nose to discriminate volatile organics with great accuracy. The high degree of redundancy due to the large number of fibers provides the high accuracy by decreasing the signal to noise ratio. Also, this configuration enables miniaturization since optical fibers as
32
small as 2 µm are available [44]. However, the sensitivity of the optical fiber based optoelectronic nose is very low i.e. around 1000 ppm. Later, sensitivity of this system is improved to low ppm level using dye doped microbead arrays [45] and to low ppb level using nanoporous silica microspheres [46] on the distal end of a single optical fiber.
Figure 5 (a) Preparation of the microsphere array on the fiber tip. (b) Measurement and signal reading [45].
Typical structure and fluorescence response of a microbead array formed using three type of microspheres is given in Figure 5. Each of the chemicals result in significantly different patterns in sensor array which make the classification of analyte vapors possible.
33
Chapter 2
Optoelectronic Digital Nose
Recently, Bayindir Group researchers demonstrated that hollow core Bragg fiber arrays can be used for high selectivity detection of several volatile organic compounds [26, 30]. In this approach, a broadband blackbody source is used as the infrared light source rather than a narrow band high power laser which is generally used in gas detection applications in hollow core fibers [47]. This design enables detection of chemicals through their infrared absorption patterns by covering the whole spectrum with the sensing fiber array. Bragg fibers that operate at a specific region of the mid-infrared are produced by the control of fiber drawing parameters. In this scheme, therefore, fibers are used not only as a waveguide or absorption cell but also as a filter for the incoming infrared radiation by virtue of their wavelength-scalable photonic band structure. Unlike common electronic noses, the response of the optoelectronic nose to chemicals is highly predictable as the infrared absorption characteristics of the chemicals are well known. Therefore, suitable optoelectronic nose design for a specific application can be simply done by scanning the infrared adsorption spectra of the analytes. Computer simulations performed using 25 fibers to identify a data set containing 100 volatile organics demonstrate the high selectivity of this approach [30]. In this study, the fiber transmissions are generated identical to the real infrared transmitting fibers to span the infrared region between 2.5 to 25 µm and chemicals are selected from a commercial FTIR library (Bruker FTIR demo library). To correlate the absorption peaks of the chemicals inside the fibers with typical absorption peaks seen with an FTIR instrument, infrared absorption spectra of three chemicals with both
34
fibers and an FTIR instrument were measured. Absorption measurements for all chemicals resulted in more intense peaks compared to conventional FTIR, which demonstrates the enhanced fiber response due to the waveguide. The relation between the photonic bandgap and the threshold bandwidth, a measure of the selectivity of the optoelectronic nose, is discussed.
2.1 Chemical Identification with the Cross Response of the
Fiber Array
In the artificial nose concept developed by Bayindir Group researchers, hollow core Bragg fibers are used as an infrared filter, as well as a gas chamber and a waveguide [26, 30]. In this scheme, light from a blackbody source is coupled to the fiber and its transmitted total intensity is measured with an infrared detector. If there is an overlap between an absorption band of the analyte and the bandgap of the fiber, the transmission is quenched and this indicates the presence of the analyte (Figure 6). Using an array which consists of fibers with bandgaps at different regions of the mid-infrared allows the targeting of specific absorption bands. The combined response of the fibers enables the selective sensing of analytes using an ordinary blackbody source and an infrared detector.
35
Figure 6 Infrared absorption measurement inside the hollow core Bragg fibers. Bragg fibers guide electromagnetic radiation with in-built chalcogenide/polymer dielectric mirrors. The blackbody radiation is coupled to the hollow core of the fiber and volatile molecules of the analyte are introduced into the hollow fiber core simultaneously. In the presence of the analyte, the transmission of the fiber is quenched, which allows the detection of the analyte.
In Figure 7 (a), Transmission spectra of an array of six fibers are shown with the absorption spectrum of methanol. Transmissions of fiber 1 at around 3750 cm-1, fiber 2 at around 2900 cm-1 and fiber 4 at around 1000 cm-1 are quenched due to the
absorption of the methanol in the hollow core. On the contrary, transmissions of fiber 3, fiber 5 and fiber 6 are not quenched because there is no overlap between the absorption bands of methanol and the bandgap of the fibers. Since the transmitting wavelengths of each fiber is known, it is possible to determine the absorption bands of the analyte by simply measuring the change in the transmitted intensity for each fiber. Therefore, the chemical inside the hollow core of the fiber is identified accurately. Interestingly, the fiber array response can be represented in binary code by assigning a threshold value to fiber transmittance. In Figure 7 (b), the quenching in the total transmitted intensity of each fiber is shown. A threshold value of about 85 % is chosen to determine the fibers which have significant quenching due to presence of the analyte. The fibers below this threshold, fibers 1, 2 and 4, are labeled with ‘1’, whereas fibers above this threshold are labeled with ‘0’. Consequently, the response of the fiber array to methanol is represented in the binary code ‘110100’.
36
Figure 7 Response of an array of six fibers to methanol. (a) The transmission spectra of the fibers are shown along with the absorption of methanol, the measured analyte. Transmission of the fibers are quenched where there is an overlap between the photonic bandgap of the fiber and the absorption band of the analyte. (b) The response of the fiber array as a binary code. A threshold value of about 85% was used to register the array response in ones and zeroes. With this approach it is possible to describe methanol in binary code as ‘110100’. The quenching of the fibers are also shown in gray scale color code [26].
It is possible to selectively detect several chemicals and represent each of them with a specific binary digital code with this approach. In Figure 8, ten chemicals measured with the fiber array, and the quenching they induced at the transmittance of the each fiber is shown. Each of the chemicals are represented with a specific binary code by registering the quenching of each fiber. The ability to analyze fiber transmittance data by simply assigning a threshold value, and to designate a digital code to each chemical has promising implications for simplifying the hardware and the software of chemical identification systems. To demonstrate the reliability of the approach, a conventional data analysis method, hierarchical cluster analysis, is used to analyze the response of the fiber array. In hierarchical cluster analysis, squared Euclidean distances between each data point of the fiber quenching measurements (at six dimensional space) are calculated and organized in groups. The farther the data points from each other, the more different the analyte. Hierarchical cluster analysis shows that the digital optoelectronic nose approach classifies each of the ten chemicals accurately.
37
Figure 8 Ten chemicals measured with the optoelectronic nose and the analysis of fiber array response data. Hierarchical cluster analysis of the array response classifies chemicals demonstrating the selectivity of the approach. Also, it is possible to tag each of the ten chemicals with a specific binary code [26].
The approach of using an array of infrared transmitting photonic bandgap fibers is very selective, as it allows direct measurement of infrared absorbance. The wavelength selectivity is achieved by the use of Bragg fibers as infrared filters, as well as the waveguide and gas cell. Therefore, a compact and robust device can be built without the need of monochromators or interferometers. Additionally, as the volumes of the fiber cores are very small (in the range of µL), measurements can be done with trace amounts of analytes. The small volumes also increase the optical path length as the light is guided with multiple omnidirectional reflections within the hollow core of the fiber. The signal response time is also very small, a few seconds, which is critical in many applications such as toxic gas or fire detection. Moreover, the analytes can be tagged and classified with binary codes, which greatly simplifies the data analysis. In Figure 9, the concept of the digital optoelectronic nose is shown.
38
Figure 9 Digital optoelectronic nose scheme. (a) An ordinary blackbody source such as a heated filament is used. The broadband radiation is coupled to the fibers, and analytes are introduced to the hollow core of the fibers simultaneously. The array response is measured with an array of infrared detectors. The quenching in the transmission of each fiber is registered to identify the chemical and tag the chemical with a binary code. (b) Representative cross section of hollow core Bragg fibers. The hollow core is surrounded by polymer/chalcogenide dielectric mirrors. (c) The light is guided by omnidirectional reflections from the dielectric mirrors inside the hollow core of the fiber. The hollow core functions as the gas cell as well as the waveguide [30].
2.2 Effect of Fiber Transmission Bandwidth to Performance
In the following study by Bayındır Group, the selectivity of the fiber array is studied by the detection simulations of a large number of volatile organic chemicals and their mixtures [30]. Absorbance spectra of 100 organic volatile compounds taken from a commercial FTIR library is used in the simulations. The effect of fiber transmission bandwidths and the number of fibers to the optoelectronic nose performance is studied. Transmission spectra of 25 Bragg fibers is simulated as a Gaussian profile. Response of the 25-fiber array to the 100 chemicals is shown in Figure 10. The quenching percentage of the fiber transmittance is shown in gray scale representation. To register the quenching data in binary code, assigning a threshold value is necessary. The threshold value should ensure accurate identification of the targeted chemicals of the
39
fiber array, i.e. each of the chemicals should have a distinct binary code. The response of the fiber array determines the possible values for the threshold. If the array can comfortably classify the chemicals, there is a large set of numbers among which the threshold can be set. Therefore, the threshold bandwidth is a measure of the selectivity of the array. In the simulations of this study the threshold band is between 89.2% and 92.2%, and the classification of 100 chemicals is possible with the 25-fiber array.
Figure 10 Response of a 25-fiber sensor array. (a) The gray scale representation of the fiber responses is shown for each fiber and chemical combination. (b) Binary codes of each chemical obtained with a threshold number of 91%. The array tags each chemical with a unique binary code [30].
In Figure 11, hierarchical cluster analysis of the array response is shown with the binary codes of chemicals. Interestingly, the chemicals are classified according to their bond structures. Chemicals #2 and #3 (ethyl formate and buthylformate) for instance, are chemically similar and they are grouped very close accordingly. The
40
array response is similar for chemically similar species, as is the case of infrared spectra of similar molecules.
Figure 11 Hierarchical clustering analysis of the 25-fiber array response and the binary codes of each chemical assigned by the array. Successful classification and binary tagging of 100 chemicals was possible with the array of 25 fibers [30].
The effects of fiber transmission bandwidth to the selectivity of the fiber array were studied with simulations. In Figure 12, the relation of fiber photonic bandwidth with the threshold bandwidth is shown. Normalized full width half-maximum (FWHM) values were used for the comparison. The threshold bandwidth increases with decreasing FWHM values, which demonstrates the increasing selectivity of the array with decreasing fiber photonic bandwidths. It should be noted that the threshold bandwidth is not continuous for some fiber sets. For very small FWHM values with about 5-fold bandgap narrowing, the threshold bandwidth disappears for very narrow or very wide photonic bandgaps (Figure 12). It is interesting to note that if the photonic bandgap is too narrow, the fibers would only respond to single wavelengths,
41
losing their cross-responsive response to multiple analytes. Therefore, even if bandgap narrowing is favorable for selectivity to some extent, further narrowing would hinder the performance of the optoelectronic nose. On the other hand, if the photonic bandgap is too wide, the fibers would not have specific response and this is again not favorable for selectivity. The threshold bandwidth’s disappearance at very wide or very narrow bandgaps demonstrates that the optoelectronic nose is not able to classify the chemicals selectively for these two cases.
Figure 12 The relation between photonic bandgap of the fibers and the threshold bandwidth. Fibers with potonic bandgaps at the same spectral position but with different bandwidths were studied. The threshold bands were calculated for the previous 100 chemicals. Bandgap narrowing widens the threshold bands to some extent, demonstrating enhanced selectivity. However the threshold bandwidth disappears for too narrow or too wide photonic bandgaps, showing that extreme narrowing or widening of the photonic bandgap is not favorable for selective detection.
42
Chapter 3
Bragg Fibers
3.1 Dielectric Mirrors
Light is reflected from dielectric interfaces where there is a change in refractive index between the two media separated by the interface. Dielectric mirrors are periodic layers of dielectric materials with different refractive indices, where the multilayers introduce a periodic change of refractive indices. The light experiences multiple reflectance from each interface of the multilayered structure, therefore, very high reflectance can be achieved even if the reflection from a single interface is low. Dielectric mirrors enable precise manipulation of light, which is desired in many applications such as holography, wavelength filters and waveguides [48]. It is interesting to note that Nature has already found many ways to exploit this simple manipulation of light. Dielectric mirrors are responsible for structural coloration in the bodies of many animal and plant species [49-51]. Very high reflectance can be achieved at specific spectral regions of high reflectance (photonic bandgaps) by precise thickness control of the materials.
3.2 History of the Bragg Fiber
Bragg fibers guide electromagnetic waves using interior dielectric mirrors that enclose the fiber core. Dielectric mirrors, periodically layered materials of different refractive indices, can exhibit omnidirectional reflection at certain bandgaps
43
determined by their layer structure, i.e. by the thicknesses and refractive indices of their material components. Reflection from a dielectric mirror displays similar properties to the diffraction of X-rays from crystal planes, and is therefore called Bragg reflection [48]. The concept of utilizing Bragg reflection in cylindrical waveguides was introduced as early as the late seventies [52], and first Bragg fibers were produced in the early 2000s [28]. In these fibers, a hollow core is surrounded by alternating layers of a high refractive index chalcogenide glass and a low refractive index polymer. The hollow cores and large photonic bandgaps of Bragg fibers provide a new opportunity for the transmission of light from high intensity sources, such as CO2 lasers [28]. Bragg fibers are currently under commercial use in minimally invasive laser surgeries [29, 53, 54].
More recently, advantages of using Bragg fibers for chemical sensing applications were realized. The ability to transmit high intensity light, combined with the increased optical path lengths and very small volumes of hollow fiber cores, makes these fibers suitable for trace gas sensing applications [55]. Current approaches for Bragg fiber-mediated chemical detection are based on a variety of mechanisms, such as measuring the infrared absorption of the analyte with a laser source at a specific wavelength [47], quantifying refractive index changes by measuring shifts in the bandgap of the fiber [56-58], or placing a chemiluminescent material at the hollow core of the fiber [59].
3.3 Fabrication of Hollow Core Polymer/Chalcogenide
Bragg Fibers
Bragg fibers are fabricated by thermal drawing from a preform, similar to the optical or photonic crystal fibers. Here, preform is a macroscopic rod which is prepared in the intended fiber geometry. For Bragg fibers, the preform has a hollow core and dielectric multilayers of chalcogenide glass and polymer enclosing the core, and a polymer cladding surrounding this structure. By feeding the preform to a furnace with precise temperature control and drawing it under mechanical stress, microscale fibers that have the same geometry with the initial preform can be drawn. The photonic bandgaps of the Bragg fibers can be adjusted by controlling the thicknesses of the
44
chalcogenide/polymer layers during thermal drawing. Tens of meters of Bragg fibers can be drawn from a single preform at one step. Fabricated fibers are very robust and they have very low losses in the infrared region.
3.3.1 Polymer Material Choice
The infrared absorption of the polymer material should be considered to fabricate fibers which have photonic bandgaps at the mid-infrared region. Additionally, mechanical properties of the chalcogenide glass and the polymer must be similar to ensure integrity of the preform during the thermal drawing. Otherwise, high temperatures and loads on the fiber cause it to break during the thermal drawing. Chalcogenide glasses have high refractive indices and are transparent at the mid-infrared, which makes these materials ideal for the fabrication of Bragg fibers. A lot of polymers have similar mechanical properties with chalcogenide glasses, which allows the drawing of polymer/chalcogenide composite fibers. However, all polymers have absorption bands at the mid-infrared, and polymers with absorption bands at the desired mid-infrared region should be avoided. Absorption spectra of four candidate polymers for the fabrication of the optoelectronic nose Bragg fiber array are shown in Figure 13.
![Figure 3 Colorimetric sensor array responses for volatile organic compounds produced by 10 different bacteria species [43]](https://thumb-eu.123doks.com/thumbv2/9libnet/5572603.108943/30.892.210.769.566.846/figure-colorimetric-responses-volatile-compounds-produced-different-bacteria.webp)
![Figure 4 Microsphere fluorescence sensor array [40].](https://thumb-eu.123doks.com/thumbv2/9libnet/5572603.108943/31.892.292.687.468.751/figure-microsphere-fluorescence-sensor-array.webp)