İSTANBUL BİLGİ UNIVERSITY INSTITUTE OF GRADUATE PROGRAMS
FINANCIAL ECONOMICS MASTER’S DEGREE PROGRAM
THE EFFECTS OF US MACROECONOMIC DATA ON GOLD MARKET
Enver ERKAN 116621014
Assoc. Prof. Serda Selin ÖZTÜRK
İSTANBUL 2019
İSTANBUL BİLGİ UNIVERSITY INSTITUTE OF GRADUATE PROGRAMS
FINANCIAL ECONOMICS MASTER’S DEGREE PROGRAM
THE EFFECTS OF US MACROECONOMIC DATA ON GOLD MARKET
Enver ERKAN 116621014
Assoc. Prof. Serda Selin ÖZTÜRK
İSTANBUL 2019
16.01.2019 80
PREFACE
This study is submitted in fulfilment of the requirements of the Master’s Degree of Financial Economics program in İstanbul Bilgi University. Gold has been an attractive instrument for many centuries and people had different reasons for owning this precious metal, throughout the ages until today. All in all, the price of gold has been an important factor that people wonder, at every stage of history. Today, the gold is considered as an important alternative investment tool and has an important amount of trading volume in the financial markets as well as physical existence and attractiveness.
In this study, US macroeconomic factors have been chosen in order to model gold prices forecast, as a guide to investment decision makers. This study, mathematically models the theoretical known factors in the markets and provides the opportunity to estimate future prices with numerical parameters.
I would like to express my gratitude and thanks to my adviser Assoc. Prof. Serda Selin ÖZTÜRK for her encouragement and help during my study. I also would like to thank to my colleagues for their supports at every stage of the process.
Enver ERKAN Istanbul, January 2019
CONTENTS
Page Number
PREFACE ………..iii
CONTENTS ...iv
LIST OF ABBREVIATIONS ………...vi
LIST OF SYMBOLS ...viii
LIST OF CHARTS ...ix
LIST OF TABLES …….………...x
ABSTRACT …...xi
ÖZET ……...xiii
INTRODUCTION ………...1
CHAPTER 1 FED'S MONETARY POLICY AFTER THE 2008 CRISIS ………...3
1.1. FED'S EXIT STRATEGY AND ITS EFFECT ON THE GLOBAL FINANCIAL MARKETS ………...3
1.2. MACROECONOMIC DEVELOPMENTS IN THE US ECONOMY DURING FED'S EXIT PROCESS ……….6
CHAPTER 2 GENERAL CHARACTERISTICS OF GOLD MARKETS .………...12
2.1. REASONS FOR GOLD INVESTMENT, WHY GOLD IS HELD? ..……....12
2.1.1. Gold as a Hedging Instrument Against Currency Risk and Inflation ………12
2.1.2. The Reason Why Central Banks Hold Gold in Their Reserves and Long-Term Balance Sheet Strategies ………14
2.2. DYNAMICS OF THE GOLD MARKET ………...17
2.2.1. Supply Demand Balance ………..17
2.2.3. Production Costs ………..22
2.2.4. Inflation Adjusted Gold Price ………...24
2.2.5. Gold / Silver Ratio ………26
2.2.6. Gold / Copper Ratio ……….28
CHAPTER 3 LITERATURE REVIEW ………...30
CHAPTER 4 METHOD AND DATA SET ………..36
4.1. METHOD ………...36
4.1.1. Autoregressive Conditional Heteroskedasticity (ARCH) Model …………36
4.1.2. Generalized Autoregressive Conditional Heteroskedasticity (GARCH) Model ……….38
4.1.3. Exponential Generalized Autoregressive Conditional Heteroskedasticity (EGARCH) Model ……….39
4.2. DATA SET ……….40
CHAPTER 5 IMPLEMENTATION AND FINDINGS ………..43
CHAPTER 6 CONCLUSION AND RECOMMENDATIONS ………..52
REFERENCES ... 55
LIST OF ABBREVIATIONS
US United States Fed Federal Reserve
ARCH Autoregressive Conditional Heteroskedasticity Model
GARCH Generalized Autoregressive Conditional Heteroskedasticity Model EGARCH Exponential Generalized Autoregressive Conditional
Heteroskedasticity Model USD United States Dollar FX Foreign Exchange
JPY Japanese Yen
CHF Swiss Franc
QE Quantitative Easing GDP Gross Domestic Product NAIRU Natural unemployment rate FOMC Federal Open Market Committee PCE Personal Consumption Expenditure CPI Consumer Price Index
WGC World Gold Council
IMF International Monetary Fund
CNY Chinese Yuan
SDR Special Drawing Rights ETF Exchange traded fund
MSCI Morgan Stanley Capital International
CFTC The Commodity Futures Trading Commission
oz Ounce
CME Chicago Mercantile Exchange DXY Dollar Index
USA United States of America
UK United Kingdom
ARDL Autoregressive distributed delay
DEM German Mark
GBP British Pound
EUR Euro
ECB European Central Bank
GARCH-DCC GARCH Dynamic Conditional Correlation AIC Akaike Information Criteria
LIST OF SYMBOLS
ℇ Error Term
GOLDRETURN Daily logarithmic return of gold AHE Average hourly earnings
CPI Consumer price index
ISMM ISM manufacturing index
NFP Non-farm payrolls
RETAIL Retail sales
σ 2 Variance μ, β, ω, γ, Δ, θ, α Parameters
LIST OF CHARTS
Page Number
Chart 1.1. Total Assets of Fed in the Balance Sheet After 2007 ……….4
Chart 1.2. Balance Sheet Structure of Fed, During Monetary Expansion Period …..9
Chart 1.3. Changes in Federal Funding Rate and S&P 500, 2-year and 10-year US Bond Yield and Gold Price Comparison ………10
Chart 1.4. Comparison of US Real Interest Rates and Gold Prices …………...11
Chart 2.1. The Relationship Between Money Supply, Inflation and Gold ……...14
Chart 2.2. Central Banks Net Gold Purchases Between 2010 and 2018 …..……...15
Chart 2.3. Distribution of Global Reserves ………17
Chart 2.4. Gold Prices and Gold-Backed ETF Relationship ………...18
Chart 2.5. Net Inflows to Gold Backed Stock Exchange Funds ………19
Chart 2.6. COMEX Net Gold Long Positions ………20
Chart 2.7. Production Costs of Gold Mining Companies ………...23
Chart 2.8. Global Average Gold Production Cost ………..24
Chart 2.9. Bloomberg Inflation-Adjusted Spot Gold Price ……….25
Chart 2.10. US Annual CPI Inflation Rates (1913-2018) ………..26
Chart 2.11. Gold / Silver Ratio (Last 20 Years Chart)……….28
Chart 2.12. The Course of the Gold and Copper Ratio in the Period 1989 – 2018 ………..29
LIST OF TABLES
Page Number
Table 1.1. Dot Chart of the Fed Members' Interest Views and Fed's Interest
Expectations ………6
Table 1.2. Fed's Current Projections on US Economy Main Indicators and Federal Funding Rate at the December 2018 FOMC Meeting ………10
Table 2.1. The Amount of Gold Held by Global Central Banks in Their Reserves ………16
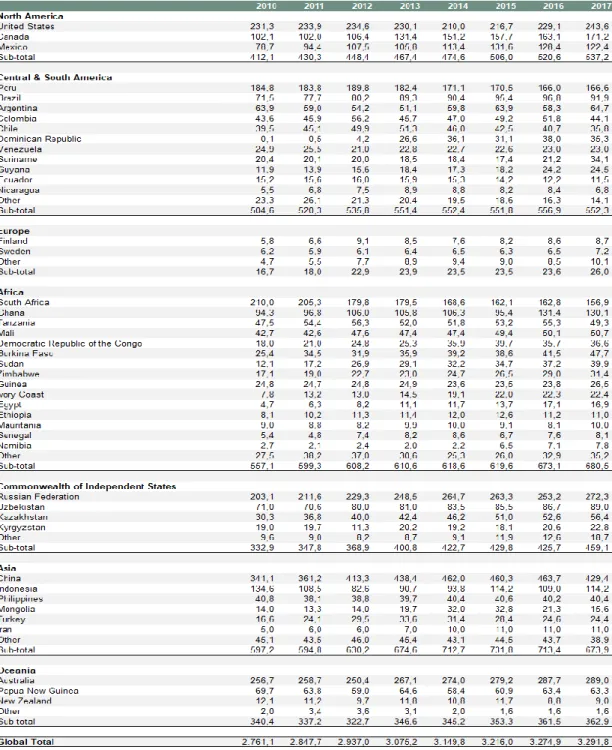
Table 2.2. Global Gold Mining Production …………...21
Table 2.3. Gold Extraction Costs of Firms ……...23
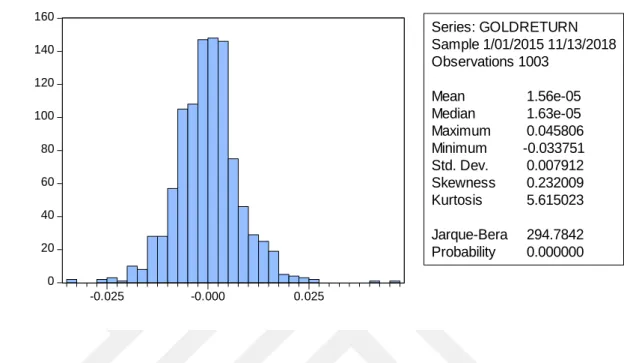
Table 4.1. EViews Gold Return Descriptive Statistics …..……...41
Table 5.1. The Correlation Between the Non-farm Payrolls and Average Hourly Earnings Variables………43
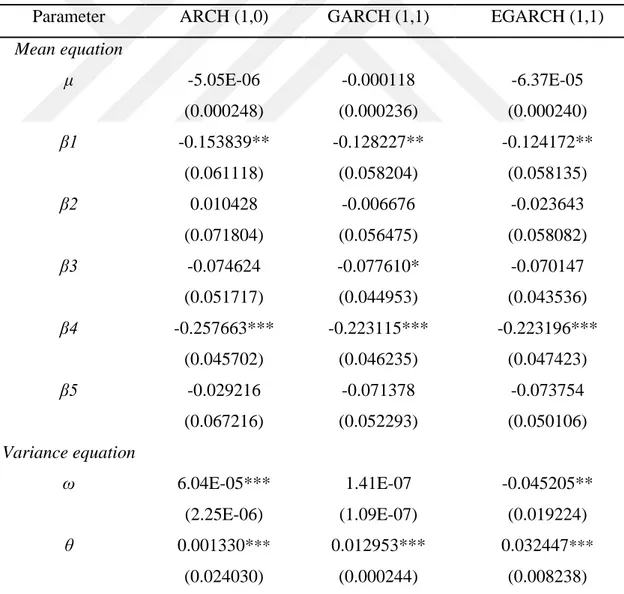
Table 5.2. EViews 6 Mean Equation Research Findings ………...44
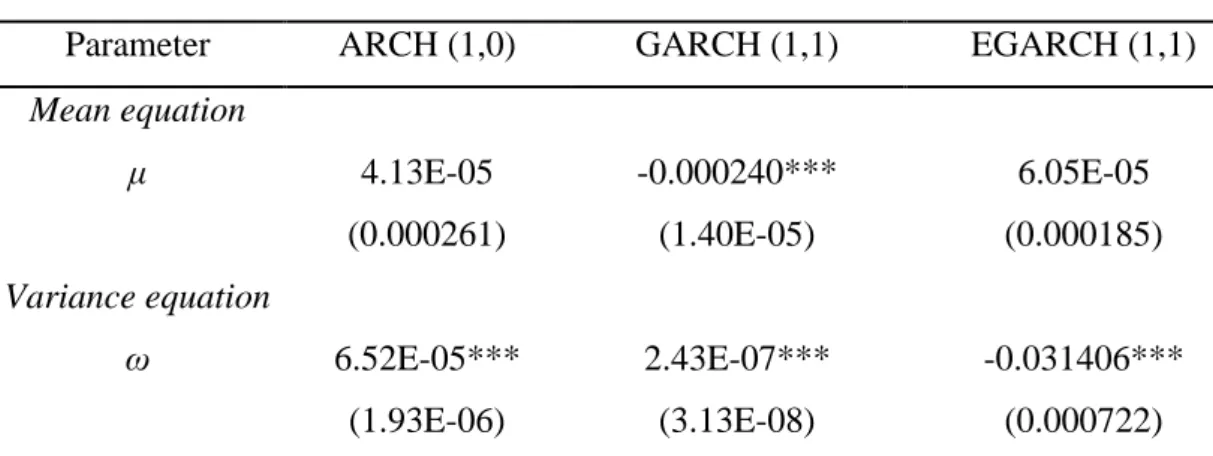
Table 5.3. Estimation of Variance Equation Results………...48
ABSTRACT
This study examines the effects of the main US economic data on the gold return and volatility, in the economic recovery period following the loose monetary policies of the Federal Reserve (Fed) implemented in the aftermath of the 2008 financial crisis and aims to reach the most proper economic data set. For this purpose, using the ARCH, GARCH and EGARCH econometric models, the effects of these data on the gold return and volatility and the rate of spread were examined and the effects of the positive and negative surprise variables on price and volatility were investigated.
Within the framework of macroeconomic assumptions, five variables that we regard as the most important ones are taken into consideration and the degree of reflecting the positive and negative surprises on daily gold return is examined. The purpose of analysing the effects of new news on daily pricing instead of instant pricing is to reach the rational information by including the effect of spreading of the data. Our observations show that the effects of the economic data announcements in the current conjuncture, except for the two variables considered by the investors as the most “game changer”, and are attenuated as the time frame progresses. This shows that the five variables we consider within the framework of macroeconomic assumptions can be further reduced.
The findings of our study revealed that the positive surprises of US macroeconomic data affected the gold return negatively, and the negative surprises affected the gold return positively. In the 2015-2018 period, when the Fed was in the process of increasing interest rates through loose monetary policy, the data that were better than expected gave a positive opinion about the economic trend and directed the investors to USD and equities more; rather than gold. The good news about the economy increases investors' belief that the Fed will raise interest rates faster.
Key Words: Fed, Monetary Expansion, Global Financial Crisis, Bloomberg, Gold
return, Gold volatility, Non-farm Payrolls, Trump, Surprise Variables, ARCH GARCH EGARCH Models, Asymmetric Impact.
ÖZET
Bu çalışma, 2008 finansal krizi sonrası dönemde uygulanan geniş para politikaları sonrasında ABD Merkez Bankası’nın (Fed) ekonomik toparlanma süreci içerisinde izlediği başlıca ekonomik verilerin altın getirisi ve volatilitesi üzerinde etkilerini incelemekte, altını etkileyen temel değişkenlerin anlık ve günlük getirilerini karşılaştırarak anlamlı veri setine ulaşmayı amaçlamıştır. Bu amaçla ARCH, GARCH ve EGARCH ekonometrik modellemeleri kullanılarak söz konusu verilerin altın getirisi ve volatilitesine etkileri ve yayılma hızları araştırılmış, pozitif ve negatif sürpriz değişkenlerinin fiyat ve volatilite üzerindeki sapma etkileri incelenmiştir.
Çalışmada makroekonomik varsayımlar çerçevesinde önem derecesini en yüksek olarak gördüğümüz beş değişken ele alınmış, bu verilerin günlük altın getirisi üzerine pozitif ve negatif sürprizleri yansıtma derecesine bakılmıştır. Yeni haberlerin anlık fiyatlamalar yerine günlük fiyatlamalar üzerindeki etkilerini incelememizin amacı, verilerin yayılma etkisini de işin içine katarak rasyonel bilgiye ulaşmaktır. Yaptığımız gözlemler, güncel konjonktür içerisinde yatırımcıların en “oyun değiştirici” olarak gördükleri iki değişken haricinde açıklanan ekonomik verilerin etkilerinin zaman dilimi ilerledikçe sönümlendiğini göstermektedir. Bu da makroekonomik varsayımlar çerçevesinde ele aldığımız 5 değişkenin daha da indirgenebileceğini göstermektedir.
Araştırma bulgularımız incelediğimiz ABD makroekonomik verilerden pozitif sürpriz yaratanların altın getirisi negatif etkilediğini, negatif sürpriz yaratanların ise altın getirisini pozitif etkilediğini ortaya koymuştur. Fed’in geniş para politikasından çıkarak faizleri artırma sürecinde olduğu dönemi ele aldığımız 2015-2018 döneminde beklenenden iyi gelen verilerin ekonomik gidişat hakkında olumlu fikir verdiği ve yatırımcıları daha çok USD ve hisse senetleri tarafına yönlendirdiği, bu dönemde artan risk iştahı ve USD ile olan ters korelasyonun altın fiyatlarını düşürmekte olduğu sonucuna varılmıştır. Ekonomiye dair iyi haberler,
yatırımcıların Fed’in faiz oranlarını daha hızlı artırmasına olan inancını artırmaktadır.
Anahtar Kelimeler: Fed, Parasal Genişleme, Küresel Finansal Kriz, Bloomberg,
Altın getirisi, Altın volatilitesi, Tarım dışı istihdam, Trump, Sürpriz Değişkenler, ARCH GARCH EGARCH Modelleri, Asimetrik Etki.
INTRODUCTION
Gold, which has always been seen as a value storage tool, protection instrument, investment instrument or value standard throughout the history of humanity, has been an important part of both economy, financial system and markets with these features. Until very recent time period, when the Bretton Woods system collapsed, gold led to the functioning of the financial system as a standard of value. While gold is no longer as important as before in terms of value standardization in the currency period, the “yellow metal” still plays an important role in portfolio diversification as an inflation and risk hedging instrument.
Gold is known as a safe haven within the framework of a general belief and therefore stands out as a mean of protection in times of fear, anxiety, uncertainties in the financial markets, crisis, political instability, war and conflict. During this period, investors withdraw their money from asset classes, such as stocks, emerging markets, FX market etc., which they see as more risky, and invest in gold and other precious metals, haven currencies such as JPY, CHF, or developed countries bonds. In the study of Sarı, Uzunkaya and Hammoudeh (2009), a positive and statistically significant relationship was found between the indicators of political and financial stability and stock markets yield.
Therefore, the 2008 global financial crisis points to a significant turning point in terms of investors' recall of safe havens such as gold. In the post-2013 period, when the global economies were believed to be overcoming the effects of the 2008 global financial crisis, the major central banks tended to put an end to the loose monetary policies they had implemented in order to get out of the crisis.
The purpose of this study is to determine the impact of US macroeconomic data on gold return and volatility, in the post-2015 period when the Fed started to increase interest rates in the post-crisis period in which the Fed's interest rates increased.by the macroeconomic data. In this context, using the ARCH, GARCH and EGARCH
models, it is aimed to reach the best and lasting effect analysis results, whether the effect direction of the theoretically expected variables is confirmed by the data used in the study.
This study is planned as follows: In the first part of the thesis, the 2008 global financial crisis and its effects were summarized in order to provide the infrastructure for the study, and then the monetary policies implemented by the Fed during the exit process and the normalization phase were emphasized. In the second chapter, the general characteristics of the gold market are examined and the properties that distinguish gold from other commodity groups or metals are emphasized. At the same time, the approaches of the market players in the various periods have been evaluated and the ways in which the investor behaviour can change between the periods are examined. Market conditions and ratios which are effective in taking investment decisions are also analysed. In the third chapter, researches on similar topics in the literature were examined, which variables were examined by previous studies and what conclusions they reached. In the fourth chapter, the data to be used in the study and econometric models are given and it is explained why ARCH, GARCH and EGARCH models are selected. In the fifth chapter, the data set used in the study and the econometric models on the gold return / volatility were established and the findings were interpreted. In the sixth and last chapter, the general results obtained and the general comments about the thesis are given.
CHAPTER 1
FED'S MONETARY POLICY AFTER THE 2008 CRISIS
1.1. FED'S EXIT STRATEGY AND ITS EFFECT ON THE GLOBAL FINANCIAL MARKETS
Following the transformation of the mortgage crisis in the US into a banking crisis in 2008, the crisis gained a global character. Mortgage loans given by the US banks in abundant and inexpensive cost in the period when the prices increased in the housing market to the low credibility individuals led the housing sector crisis to turn into a banking crisis when these loans could not be repaid (Zestos, 2016). Normally; it is unlikely that the bank will suffer from mortgage loans because the mortgage loan is the property of the housing / real estate itself. For this reason, the banks thought that they could make profit from the sale of the houses / real estates that they would obtain as collateral even if the loans could not be repaid, thus lowering their credit risks. Because housing prices were rising at that time. However, the housing bubble exploded in the US and the prices in the real estate market began to fall sharply. This situation brought banks into crisis. The explosion of the housing bubble damaged banks due to the high amount of mortgaged loans, and the loans that were recalled due to the disruption of the credit mechanisms of the banks and the urgent risk caused the real sector to be troubled, the economy contracted, and the fluctuations in the US economy brought the crisis to a global dimension. (Rosengren, 2012)
The bankruptcy of Lehman Brothers, one of the largest banks in the US in September 2008, is a turning point for the crisis to become more apparent. Apart from Lehman Brothers, some other organizations operating in the financial services sector have also announced bankruptcy, either purchased by other organizations (selling Bear Stearns to JP Morgan Chase, purchasing Merrill Lynch by Bank of America). The US Congress adopted a 700 billion USD bailout package to stop the
crisis in September 2008, but could not stop the spread of the crisis. (Vermeiren, 2013)
From 2008 to 2014, the Federal Reserve (Fed) launched QE1, QE2, QE3 and QE4 programs respectively. The program, which could be called quantitative expansion or monetary expansion and which would bring about a period of abundant liquidity especially in the developing countries, was based on the fact that the Fed collected treasury bonds and mortgage-based bonds from the market and gave money to the market and kept the funding rate close to 0. The Fed collects the borrowing papers in the market and provides liquidity in return, eliminates the liquidity shortage; at the same time, keeping interest rates low, allowing banks to give loans, thus providing support to the economy. In his study, Vural (2013) stated that the Fed reduced the returns and provided a significant amount of funding to banks.
The Fed's bond purchases led to an increase in the Bank's balance sheet and the Fed's balance sheet size reached 4.5 trillion USD. (Federal Reserve, Credit and Liquidity Programs and the Balance Sheet,
https://www.federalreserve.gov/monetarypolicy/bst_recenttrends.htm)
Chart 1.1. Total Assets of Fed in the Balance Sheet After 2007
The Fed's expansion program, which spans nearly 6 years, has enabled the economy to recover from recession. The unemployment rate regressed and the economic activity, which was enlivened by the increase in consumption expenditures, brought momentum to the inflation.
On May 22, 2013, Fed Chairman Ben Bernanke said in his presentation to the US Congress that bond purchases could be reduced if the economy improved. This was the first important signal that the Fed could come out of monetary expansion. Subsequently, the process of returning liquidity to the US, which had a higher interest rate, started and USD and US bond rates started to rise. Gold prices, which have an inverse correlation with USD and interest rates, remained below 1400 USD after the last quarter of 2013.
The US economy accelerated, pushing the Fed out of monetary expansion, and gradually reduced bond purchases and ended in October 2014. After the exit process, the rate hike process started. In January 2015, Janet Yellen, succeeded Bernanke, who resigned in January 2014, and led Fed's first interest rate hike and began a monetary tightening process. In this period, economic growth has stabilized in the US (GDP growth of 2015 is 2.6%) and unemployment has entered a downward trend. However, as the inflation expectations were still low, the Fed increased interest rates once in 2016. In 2017 and 2018, the Fed increased rates in line with the improvement of the economy, the unemployment rate falling below 4% (the long-term sustainable unemployment rate predicted by the Fed as 4.5%) and the inflation approaching to 2%. According to the current projections, the Fed expects that there will be a further 2 interest rate increase in 2019. The momentum in economic growth, unemployment is below the level of NAIRU (natural unemployment rate) and inflation is expected to rise with the moderate increase in wages. These are found to be the biggest supports for Fed Chairman Jerome Powell to remain on a tightening path (Fed Policy Statements, FOMC Meeting Minutes and Yellen, Powell Speeches 2015 - 2018).
1.2. MACROECONOMIC DEVELOPMENTS IN THE US ECONOMY DURING FED'S EXIT PROCESS
For the US economy, 2017 was a year in which the Fed's expectations for tightening moves and the expectations of Trump's economic agenda for the US economy were intensively followed. The Fed passed the 2017 with three rate hikes and made a very good verbal orientation throughout the year, and the interest rate increase at the end of the year did not create a turbulence in the financial markets. However, after President Donald Trump took office in the United States, the efforts to intensify the economic agenda gained weight, while growth was observed in this period, as the economy was close to the full employment level. US economic growth shifted upwards to 3-4% with Trump's tax package in 2018. In the US, the tightening of the growth has led Fed to a tighter monetary policy, because the rate hike is done in a sense because the economy is reviving.
Table 1.2. Dot Chart of the Fed Members' Interest Views and Fed's Interest Expectations
Source: Bloomberg, Federal Reserve
In 2008, like the Fed has led the unconventional monetary policies that started with the process after the Lehman Brothers crisis, The Bank also leads the normalisation
era of the global central banks. The main effects of the balance sheet reduction initiated by the Fed in October 2017 are seen in 2018, with the growth expectations and full employment levels to continue to affect inflation positively as per the Philips curve.
In line with the Fed's balance sheet and rising inflation expectations, the upward trend in the USD-denominated bond yield curve paved the way for the appreciation of the USD and the strong USD dominates the markets.
The corporation tax deduction in the US came into force in 2018. The corporation tax that American companies will pay as of 2018 has been reduced from 35% to 21% (KPMG, 2018). In the short term, tax cuts are very positive for American companies in the short term. Thus, they increased their investments and increased their profitability and had the opportunity to pay higher salaries (Nunns etc. 2016). The effects of tax reductions triggered growth and inflation, because consumer spending contributes more to the US composition of growth this year. In particular, market rates increase more rapidly, and the positive effect on growth and inflation also encourages the Fed to continue with interest rate hikes and accelerate the tightening.
We observe that the Fed continued to maintain its communication with the markets in a measured manner and that it has been committed to its first plan in the roadmap in 2018 and has 4 interest rate increases in the year. In 2019, the Fed is expected to increase interest rates by 2 according to the current period. Of course, these assumptions will be valid under the current conditions. Trump criticizes the Fed's interest rate hikes with concerns that it will limit growth. However, the Fed continued to raise interest rates in a gradual / cautious / data-driven manner due to the risks of sharp political moves to affect the economy. The Fed is not affected by the policy and remains active in determining monetary policy.
The US economy is going well, almost all of the key indicators are improving, and economic growth has gained momentum. The employment market is quite strong and the unemployment rate is close to the bottom of 50 years. As the unemployment rate receded to its lowest level after 1969, the strong outlook in the labour market continues; the current situation allows the Fed to continue to increase interest rates gradually (United States Department of Labour, Bureau of Labour Statistics, 2018).
If wages maintain a modest increase in and the current strong momentum, they will be able to support inflation in the coming period, while economic activity has gained momentum along with the increase in disposable income. The improvement in the employment market and the tax reform of Trump at the beginning of this year increased the disposable income growth effective. The inflation is in line with the Fed's targets, but not exactly the desired qualifications.
PCE, which is the Fed's preferred inflation indicator, is slightly above the 2% target of the Central Bank and slightly below the CPI. In the context of the increase in economic activity in the US, we see that the inflation supported by the domestic demand channel gained momentum over 2% (US Department of Commerce, United States Bureau of Economic Analysis 2018). Americans, who increased their disposable incomes along with the strengthening labour market dynamics and tax cuts, made more consumption expenditures. Thus, although the price of gasoline on the headline has a temporary impact, both core and headline inflation have increased. The upward trend in the US 10-year bond rate, which is normally in operation, is shaping the USD theme and the risk perception of the market.
In the Fed's balance sheet, which reached 4.5 trillion USD, Treasury bonds constitute approximately 2.5 trillion USD, while the remaining part consists of mortgage-backed securities called MBS. Related to the downsizing; the reduction in treasury bonds will be increased from 6 billion USD to 30 billion USD at 3-month intervals. Then the reduction will be made at the maximum level. The same thing will start with 4 billion USD in mortgage-based bonds and will be increased
every 3 months with 4 billion dollar bills and will go up to 20 billion USD. This will be continued until normalization is achieved.
Chart 1.2. Balance Sheet Structure of Fed, During Monetary Expansion Period
Source: Bloomberg, Federal Reserve
The Fed increased its federal funding rate by 25 basis points as expected at the December 2018 meeting and increased the interest rate to 2.50%. For 2019, 2 interest rates were targeted, while long-term funding rate expectations lowered from September 2018 level 3% to 2.8%. (FOMC Policy Statement, 19th December 2018)
The US economy has a momentum of economic growth that could raise more interest rates. The fact that inflation is at the normalization stage of the Fed's target of 2% increases the Fed's progress towards the implementation of normal monetary policies. While there is no major change in inflation expectations, growth expectations are higher than in June and when the labour market is analysed, it is predicted that the unemployment rate will remain below the long-term sustainable unemployment rate (the Fed still sees the natural unemployment rate as 4.5%) over the next 2-3 years. The latter factor is critical to support inflation momentum. The strengthening of economic activity now also supports this current inflation momentum.
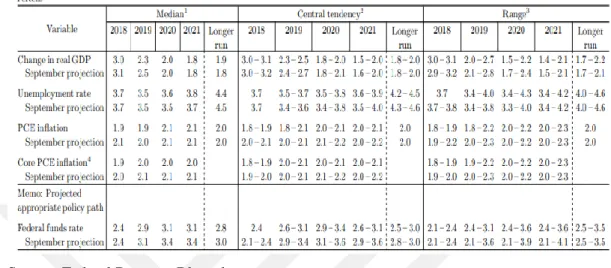
Table 1.2. Fed's Current Projections on US Economy Main Indicators and Federal Funding Rate at the December 2018 FOMC Meeting
Source: Federal Reserve, Bloomberg
The downside risk for the US economy is the trade tensions, particularly in China, and political headlines in the name of Trump. Trump recently announced a tariff of 200 billion USD for 10% of Chinese goods, and a retaliation of 60 billion USD from China.
Chart 1.3. Changes in Federal Funding Rate and S&P 500, 2-year and 10-year US Bond Yield and Gold Price Comparison
Chart 1.4. Comparison of US Real Interest Rates and Gold Prices
CHAPTER 2
GENERAL CHARACTERISTICS OF GOLD MARKETS
2.1. REASONS FOR GOLD INVESTMENT, WHY GOLD IS HELD?
Gold has been known as a standardized metal that has been used for centuries instead of a value storage tool and money. In addition to being the most important commodity used for investment, it is also traded in international markets and continues to be one of the most popular investment instruments. As there are many factors affecting the price of gold, especially supply and demand, there are various components of this supply and demand. The most known feature of gold is to assume that it is “safe haven”. For this reason, demand for gold came to the fore during periods when liquidity risk in financial markets increased or inflationary pressures created instability.
2.1.1. Gold as a Hedging Instrument Against Currency Risk and Inflation
After the extinction of the empire over the sun, the age of gold coins lasted until 1930, the period of depression and World War II period between 1930 and 1944 passed, and the 1949 Bretton Woods system started the reign of USD. During this crisis between the two world wars, the gold standard had already begun to show signs of distinction and important economies such as the US and Britain had already abandoned this standard. In 1971, after the collapse of the Bretton Woods system, the USD was at the centre of the international monetary system. The weight of the American economy in the world has given the US a privileged place in the international monetary system, and it has taken the role of reserve money status and the key currency. (Seyidoğlu, 2009). The reserve is used for coins used as a means of accumulating the term money. All currencies are interchangeable over USD. This is due to the characteristics of the USD.
The assumption that gold is in inverse correlation with the USD is one of the most fundamental assumptions in financial markets. In other words, in the periods when USD is increasing, gold is losing value, and gold is gaining value in the period of decline.
Batten, Ciner and Lucey (2014) stated that gold and inflation have a common trend in the long term. Although this relationship is weakened in cyclical breaks, especially in liquidity-based crises from time to time, it usually acts together in long term. During the global crisis, the US sought to boost liquidity in the market by lowering interest rates, thus seeking to support inflation. As a result, USD depreciated due to the abundance of liquidity and interest rates close to zero started to stimulate economic activity. Inflation also recovered slowly. The reason why the recent CPI and PCE inflation indicators, which were recently announced higher than expected in the US, caused a downward reaction in the gold price, is that these positive data increase the Fed's expectations for normalizing monetary policy and increasing interest rates. The Fed's expectation to attract plenty of liquidity from the market reduces the price of gold. Batten etc. (2014) reveals that interest rates are the most important determinant of gold beta with inflation. The study by Bacey, Sharma and Vigne (2017) reveals that in three main economies, the United States, the UK and Japan, gold’s relation with inflation is through with the money supply. In this study, it has been concluded that the inflation trends in USA and UK are significant in predicting the gold prices in the country. Bacey and so on. (2017) showed that the increasing money supply had a positive effect on consumption and investments, and that the physical demand on gold increased in this context.
Chart 2.1. The Relationship between Money Supply, Inflation and Gold
Source: Bloomberg
According to Aye, Chang and Gupta (2016), there is a positive relationship between gold and inflation variables, but this relationship can be structurally broken at certain periods. This is connected to cyclical changes. In this context, the long-term relationship between gold and inflation is not strong in every period of the market. The reason for this is the temporary tightening and expansion of monetary policies and fiscal policies. These findings are consistent with the other studies mentioned above.
2.1.2. The Reason Why Central Banks Hold Gold in Their Reserves and Long-Term Balance Sheet Strategies
Since the gold is seen as a means of protection, it can be assumed that the Central Bank is assuming that the geopolitical risks will increase and that the gold prices will rise. Because of having the most current international standard of precious metal to be a tool of value storage, gold stands out in the case of any war time to time. At present, gold is known as the most important inflation prevention tool and its weight can be increased in cases of economic instability or risk. When a significant geopolitical risk occurs, trends of market instability increase and global
risk aversion occurs, As a result, gold is a strategic reserve-keeping tool (Gopalakrishnan, 2017).
While it is more appropriate to increase gold reserves during the inflation period, it may be more appropriate to reduce the reserves during disinflation periods. Otherwise, the Central Banks cannot benefit from the opportunity cost of money. But in general, there is no such assumption. It may vary depending on the Bank's own policy.
In the first quarter of 2018, gold purchases of Central Banks increased by 42% compared to the same period of the previous year and reached 116.5 tons. In the first half of the year, the Central Bank's net purchases increased by 8 percent compared to the same period of 2017. (World Gold Council, Gold Demands Trend Report, 2018)
Chart 2.2. Central Banks Net Gold Purchases between 2010 and 2018
Central Banks have been buying 114.9 tonnes on average per quarter since they moved into the net buyer position after 2010. In 2013, net purchases in Russia, Kazakhstan and Turkey have a 50% share in 2018, they did purchase a total of 91 tonnes in the 1st quarter of 2018. Russia made 41.7 tons in the first quarter. Russia's gold reserves rose to 1890.8 tons and currently account for 18% of their total reserves. The Central Bank of Russia has been purchasing gold 38 months in a row for a strategic manner.
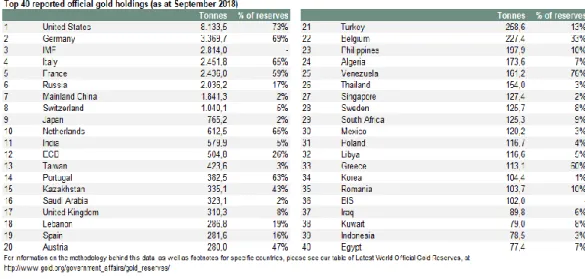
Table 2.1. The Amount of Gold Held by Global Central Banks in Their Reserves
Source: World Gold Council, IMF
The Central Bank's demand is expected to remain alive in the future. The last 1.5 - 2 years are the scene of speculation on reducing the USD dependency of global trade and money markets. After the Chinese Yuan (CNY) is included in the SDR (special drawing rights) basket and theoretically becomes reserve money status, the Central Banks diversify their reserves. According to the IMF's second-quarter reserve data, the USD weight fell to its lowest level in the last few years with 62.4% of total reserves, which declined to 11 trillion 482 billion USD. The transition to the multi-pole foreign exchange reserve system may continue and would be an important determinant of demand for gold in the coming years.
Chart 2.3. Distribution of Global Reserves
Source: IMF
2.2. DYNAMICS OF THE GOLD MARKET
There are many factors in the determination of prices in the gold market. Many studies have been conducted on the fact that gold prices have a reverse relationship between USD and stock returns, and positive with inflation and oil prices. (Le etc. 2011). These relationships should not be considered as causality. Some other factors may affect the price of gold except the factors that we specify. In this chapter, the factors that affect the pricing mechanics in the gold market are evaluated.
2.2.1. Supply Demand Balance
Like all goods and services in the economy, the price of gold is determined by supply and demand. Prices are lowered when demand is low, and gold prices may rise in high demand periods. This supply and demand determine the conditions in the economy and the market and their effects on investor behaviour.
Gold-backed ETFs (stock exchange mutual funds) and similar products constitute an important part of the gold market. Changes in ETFs often emphasize the desire
and investor opinion to keep gold in short-term and long-term. In this respect, changes in ETFs are important indicators of the physically monitored gold demand.
Chart 2.4. Gold Prices and Gold-Backed ETF Relationship
Source: Bloomberg
Global gold-backed ETFs and similar products increased by 16.5 tons due to the inflows in North American and European funds, and total gold assets rose to 2,346 tons. This implies an entry approximately 1 billion USD amount (World Gold Council, 2018). Global stock exchanges suffered the worst October since the 2008 financial crisis in 2018 and the MSCI All-World Index declined by more than 7%. As a result of this; gold has been demanded in this period aimed at safe investment. This period also marks a period in which the relationship between gold and the USD in the opposite direction, weakens. Although the known correlation is in the direction of moving the gold and the USD in the opposite direction, in this period, despite the fact that strong USD theme was effective in global markets, gold prices could rise. We can explain the formation of this anomaly as follows;
In times of crisis and uncertainty, there is demand for government bonds of developed countries. Therefore, the most reliable investment instrument is the government bond. The US government bond is the most demanded country bond in this process. US government bonds are also purchased by using USD. The US
government bond purchased by USD, evaluates the USD. When the price of the bond increases, the bond's interest decreases and the gold price increases when the bond's interest rate decreases. Thus, the price of USD and gold may rise together. This situation is a simple explanation of the rising demand for gold in times of crisis and uncertainty.
Chart 2.5. Net Inflows to Gold Backed Stock Exchange Funds
Source: World Gold Council, Bloomberg
The Commodity Futures Trading Commission (CFTC) publishes a weekly COT report that provides information on the positioning of speculative investors in the US futures markets. This report is generally used as an indicator of market sentiment for the price of gold. While short positioning reflects the downward trend, long positioning reflects the feeling that gold will rise in futures markets.
-300 -240 -180 -120 -60 0 60 120 180 -50 -40 -30 -20 -10 0 10 20 30 1.01.2003 1.01.2005 1.01.2007 1.01.2009 1.01.2011 1.01.2013 1.01.2015 1.01.2017 AUM (US$bn) Flows (US$bn)
North America (lhs) Europe (lhs) Asia (lhs) Other (lhs) Total (rhs)
Gold-backed ETFs (and similar) flows by year*
Chart 2.6. COMEX Net Gold Long Positions
Source: The US Commodity Futures Trading Commission, World Gold Council, Bloomberg
2.2.2. Production
Gold mining is a global activity in every continent except Antarctica, where gold is extracted from mines of various types and scales. On the basis of countries, China is the world's largest producer by 2017, accounting for about 13% of total global production. Approximately 75% of global gold production is realized by a total of 20 countries. Regionally, East Asia meets 21% of total production. South African and Latin American countries, North America, Australia and Russia are other important production areas (World Gold Council, 2018). As can be seen from the production rates, gold mining is not dominated by a single country and is seen as a global field of activity.
The relationship between gold prices and mining activities has been a factor in some studies in the literature. O’Connor et al. (2015) found a negative short-term
relationship between gold price and mining activities. The inverse relationship between gold price and mining was previously empirically found by Keynes (1936) and Marsh (1983).
2.2.3. Production Costs
It is also important to mention the rumours about the gold production costs, which is a matter of interest to investors who are curious about gold, and are not based on the balance sheet data. For the third quarter of 2018, we evaluated the cost of gold extraction. Considering all costs for the cost of mining (all-in-sustaining cash cost USD / oz), the average cost for the third quarter of 2018 is 946.5 USD / oz.
Taking into consideration the costs of mining on the investors' side, there is an idea that the price of gold does not fall below the cost of mining, but in fact this is a false idea. This clearly shows the data collected from the balance sheets. In this approach, the idea that the price of gold may decline to as low as 950 USD / oz, may lead to non-rational behaviour. It is also necessary to take into account whether the firms are technology or labour intensive in gold extraction techniques. Twite (2002) study confirms that gold prices may fall below the cost of production, and gold mining companies can stop production temporarily or permanently if gold price falls below the company's marginal cost of production.
Chart 2.6 shows the current status of gold production costs. As of the second quarter of 2012, the cost of gold extraction has been gradually increasing since the second quarter of 2017, following a decline in extraction costs.
Chart 2.7. Production Costs of Gold Mining Companies
Source: Bloomberg
When the sub-breakdown of large-scale companies is examined; Highest Extraction Cost: Eldorado Gold Corp @ 1112 USD / oz
Lowest removal cost: Alacer Gold Corp @ 695 USD / oz (Bloomberg, 2018)
Chart 2.8. Global Average Gold Production Cost
Source: World Gold Council, Metals Focus
2.2.4. Inflation Adjusted Gold Price
In times of uncertainty, investors tend to underline golds as a safe asset in order to protect themselves from unforeseeable disasters. In order to preserve the value of money in investment contact, investors’ demand valuable metals increase. The rise in the general level of prices in the economy, i.e. inflation, negatively affects the disposable income and purchasing power. Throughout history, gold has been a substitute of paper money for many periods, as long-term storage is easy to handle and simple to process for any purpose. While the cost of holding money is interest, there is no such cost for holding gold. Because of the limited amount of gold in the underground, i.e. the limited amount of supply, pricing mechanisms are formed according to the supply-demand balance in gold prices.
In general, gold has been held as an investment tool for many years to protect the value of money or assets, against inflation. This is not only for individual investors, but for Central Banks to diversify their portfolios for long-term balance sheet management (asset liability management). Of course, as this gold is kept as a means
of protection against inflation, prices need to be adjusted to the general level. Arayssi (2013) proposes to use the gold price adjusted to inflation as a real measure, since gold prices are provided with a distorted picture when viewed in nominal USD. Inflation adjusted gold price is based on US inflation. The reason for referencing US inflation is due to the fact that it is the largest of global economies. Like US 10-year bond interest rate is taken as risk-free interest rate is, the US inflation rate expectations used by the Fed is considered as a criterion to take inflation as a measure.
When we examine the price of gold adjusted for the 1950-2018 period from Bloomberg terminal, we see that the general trend in the period from 1950 until the end of the Bretton Woods system. The trend is more horizontal until the end of Bretton Woods, after the collapse of the system, the inflation adjusted price tend to rise, especially in the inflation periods. Erb and Harvey (2017) found that inflation is the main determinant in the long term and that the divergence between the nominal USD-based gold price and the adjusted price of inflation is corrected in the long term. Inflation adjusted gold price increases are generally seen as periods of increasing inflationary risks, such as the 1973 and 1979 oil crisis, the 1985 Plaza Agreement, 1987 Black Monday, and the expansionary monetary policies implemented in the aftermath of the 2008 global crisis.
Chart 2.10. US Annual CPI Inflation Rates (1913-2018)
Source: Bloomberg
2.2.5. Gold / Silver Ratio
Gold and silver are almost taken into account together, in the financial markets. In particular, gold is traded with larger trading volumes than silver. Silver is not very suitable for physical investment due to its chemical structure. Silver has been used as ornament and jewellery for many years. Today, in both futures and FX markets, silver is used as an investment tool in non-physical form.
Various factors such as economic and political crises, natural disasters, monetary policies of central banks cause high volatility in currencies. In such crisis situations, investors may not want to invest in foreign exchange. Gold is considered as a safe investment tool, because it is always found as a type of reserve in the Central Banks. Increased demand raises gold prices and investors may be reluctant to invest more after rising gold prices. The reason for this is the feeling that prices have reached an extremely high level and that a hard fall can follow. Baur et al. (2017) demonstrated the negative effects of the uncertainty indicators on the gold / silver ratio in their work and showed that silver is the substitute for the active duty of gold. Silver follows the price of gold in a delayed manner and can be significantly differentiated from the price of gold due to industrial usage differences.
If investors still do not trust risky assets, if the gold prices reach the point of overbought, in other words, if the risk appetite is low, they may invest to other instruments as an alternative like precious metals or commodities, such as silver. In this case, investors will be able to diversify their portfolio and find opportunities to gain high profits by taking a position in the low silver price. Therefore, the ratio of gold to other commodity group instruments may be an important indicator. In financial markets; the ratios such as gold / silver, gold / copper, gold / petroleum, gold / palladium, gold / platinum, are followed by many individual investors and hedge fund managers for speculative positions. The gold / silver ratio is one of the most popular among them (CME Group, 2018).
The gold / silver ratio indicates how many ounces of gold coincided with silver. Investors use this ratio to compare the values of gold and silver. This ratio helps to determine the most suitable time to purchase when one of these precious metals is purchased over the other or if one is preferred over the other. Thus, graphs showing the historical course of the gold / silver ratio can also be used. Chizhova et al. (2015) used gold / silver radio to classify deposits on the basis of global gold and silver. While this ratio is low, the gold is cheaper and therefore more preferable than silver, and in cases where the ratio is high, silver can be considered cheaper. The graphic we have created by using Bloomberg terminal shows that the gold / silver ratio has been in an upward trend since 2011, in other words, gold is more positive than silver.
Chart 2.11. Gold / Silver Ratio (Last 20 Years Chart)
Source: Bloomberg
2.2.6. Gold / Copper Ratio
Gold is considered as one of the safest assets by investors. Therefore, it tends to perform generally well in times of economic and geopolitical distress, making it a leading indicator of fear. Copper is the opposite. As the global economy performs well, copper also performs well in the same way as it is an important industrial metal used globally in the industry. This makes it a leading indicator of the power of the global economy. The healthy global economy means global demand is healthy, which raises copper prices. From the perspective of the markets; if the risk appetite is high, copper would be appreciated, if the risk appetite is low, gold rises.
The gold / copper ratio is calculated by dividing the market price of gold by the market price of copper. Copper is an industrial metal, and the high demand for it indicates that the economy is in a growing trend. The different uses of copper and gold allowed the ratio of copper and gold to act as an accurate barometer of global growth. If the copper is in the upward trend, the ratio decreases and risk appetite is high; on the other hand, the fact that gold is more positive than copper causes the ratio to rise, which indicates that the global investor's risk taking appetite is low.
Baur et al. (2017) found that the rate of gold and copper could be used as an indicator of market sensitization for economic growth, because it could be associated with economic growth due to the role of copper in construction and infrastructure projects. Therefore, a decline in the gold-copper ratio can be seen as a sign that expectations for future economic growth have risen.
When we look at the 30-year gold / copper ratio graph at the Bloomberg terminal, it is observed that the economic downturn in the market has increased in the periods of increase, while the economy has been performing well in growth periods. If the growth trend of the economy is positive copper performs well, or if the trend of slowing down, the gold showed a stronger performance. The rate reached its peak in the last 30 years in the 2008 global crisis period. It is noteworthy that the ratio, which is currently on the average level, is on a rising trend compared to the end of 2017. The most important reason for this is the fear of a trade war between China and Trump, which is expected to lead cool down in China economy and global economies.
Chart 2.12. The Course of the Gold and Copper Ratio in the Period 1989 - 2018
CHAPTER 3 LITERATURE REVIEW
In the academic literature, there are many studies examining the effects of surprise variables on macroeconomic data disclosures on asset classes.
Sarı (2014) analysed the effects of macroeconomic variables on gold spot price using the EGARCH model, using US data between 2008 and 2013. It has been analysed how long and how much the disclosures affect the gold price and whether the positive or negative macroeconomic news affects the gold price in the same way. Most macroeconomic data have been found to be effective on gold return and volatility. It was observed that the macroeconomic data affected the price in the first 15 minutes and the related movement lasted for the first 45 minutes. It is concluded that the variables affecting the gold price are the leading indicators that determine employment, inflation and GDP. It is found that the positive US data decreased the price of gold, while the negative realizations increased.
Le and Chang (2011), investigated whether there is a causality or correlation between gold and crude oil prices, inflation channel and dollar index by adding to the model, by using the monthly data between January 1986 and April 2011. In the model, which was formed by using the inflation channel between the gold and oil prices, it was concluded that the increases in the price of crude oil in the long term increased the inflationary pressure and increased the demand for gold as a mean of protecting from inflation. When the relationship with the dollar index is examined, it is revealed that the changes in oil and DXY in the long run have positive and negative effects on gold price. It was found that the interaction between oil and gold prices did not last very long and that the change in gold price was better explained by DXY fluctuations.
Ibrahim (2014) examined the oil price, inflation rate and exchange rates between 2003 and 2012 using multiple regression models as variables affecting gold price
in Malaysia. Inflation and currency variables were found to affect the gold price negatively and significantly, while oil prices affected positively and found to be statistically significant. In other words, while inflation and exchange rate are increasing, the price of gold is decreasing. The study proposes the use of variables such as unemployment rate, political risk, GDP, gold supply and demand, while using inflation, currency and oil variables.
Batten, Ciner and Lucey (2014) examined the long-term relationship between gold and inflation variables. In this study, the volatile period until the beginning of the 1980s has been excluded and it has been observed that the relationship between gold and inflation has increased in recent years. As the main determinant of the sensitivity of gold to inflation, the interest rates have been determined. Since the inflation beta of gold was relatively low in the 1990s, there was no co-integration between inflation and gold, and since the inflation beta was high in 2000s, a co-integration relationship was found. In this study, it was revealed that gold can be an alternative to paper money as a mean of protecting from inflation. In this context, the relationship between the inflation betas of the gold and the USD is negatively correlated, because the US is a country that gives current account deficit. If the value of USD decreases, the inflation is rising through the rise of import prices, and the price of gold and inflation rate are rising together in this environment where the USD is depreciated. As the USD is over-valued, this relationship may be weakened or reversed.
Lucey, Sharma, and Vigne (2017) examined the long-term relationship between inflation and gold prices with the liquidity tool with the US, UK and Japan examples. In the USA, it was observed that the positive relationship between gold and inflation continued until the mid-1990s. In the USA and UK samples, gold was seen as a mean of protection against inflation in the periods when the money supply increased, but this relationship did not work in Japan model. In multiple analyses, it was found that the relationship between gold and inflation was closely related to money supply.
Aye, Chang and Gupta (2016) examined the role of gold in protecting against inflation from a non-linear model, Markov switching co-integration model. In this review, they used monthly macro data between 1833 and 2013, which is quite a long time in the US economy. The long-term inflation and gold price equilibrium relationship was interrupted in 1864, 1919, 1932, 1934, 1976, 1980 and 1982, due to structural changes affecting the gold market.
Batten, Ciner and Lucey (2009) examined the relationship between the changes in macroeconomic factors and the precious metal market. Macroeconomic factors are considered as business cycle model, monetary size and financial market sentiment, and the movements in such variables are more determinant on volatility in gold market. It is concluded that precious metals influence each other's volatility and react like a single index rather than acting as different classes of assets.
Gopalakrishnan and Mohapatra (2017) compared the gold holding tendencies of the Central Banks with global risk variables. For this purpose, they used data sets belonging to 100 countries for 1990 - 2015 period. The VIX index was used as the variable of global stress. In the study, it was concluded that the Central Banks were more focused on the portfolio diversification in the periods when the global risks increased. This is in line with the assumption that gold is a “hedging instrument”.
Baur, Beckmann and Czudaj (2017) aimed to reach the relative value of gold by examining the ratios that are effective in gold investment. In this study, variables such as silver, oil, copper, commodity price indices, CPI, stock prices, bond interest rates and nominal interest rates, which are effective in determining investors' decisions and trading points, were used. The results show that the ratio of gold with the instruments and variables we specified is significantly different from the historical averages in 1980, 1990 and 2010 in various periods. Although it did not indicate a significant impairment in the comparison of the gold price ratios in the period of 2009 - 2014, it was concluded that it was above the historical average for the period 1960 - 2015. It has also been observed that long-term decomposition and
deviations in long-term ratios are realized in the long-term. Besides, it has been found that gold does not lose its relative value against other variables or assets. In the same study, it was concluded that expectations and uncertainties had a significant effect on gold prices and ratios while macroeconomic fundamentals were less important. Another interesting issue is about the impact of policy announcements the relative gold valuation, especially during the recent non-traditional monetary policy period.
Sarı, Uzunkaya and Hammoudeh (2012) examined the relationship between country-based risk ratings and stock market index movements by using autoregressive distributed delay (ARDL) method. In the study, the impact of the risk ratings on the stock index movements of the country is examined, in the specific case of Turkey; it is aimed to establish a link between the movements of the developing countries stocks in the periods when the political, economic and financial risks increased and the risk ratings. In the study, the existence of a long-term relationship between risk ratings and stock market movements was confirmed, and in the long run economic, financial and political risk rating components suppressed the stock market index movements. In the short term, it was concluded that political and financial risk rating components have a positive and significant relationship with stock market movements.
Blose (2005) used the surprises of the CPI variable as a measure of the change in inflation expectations. It has been shown that the surprises in CPI affect the interest rates but do not affect the gold prices. The study concluded that speculation strategies based on inflation expectations could be successful in bond markets, but not in gold markets. In addition, investors cannot determine market inflation expectations by examining gold prices.
Sindhu (2013) focused on many factors affecting gold prices and tested hypothesis. In these hypothesis tests, the relationship between gold prices, USD, crude oil price, repo rate and inflation rates and causality were examined. The relationship of gold
with the variables we have determined is shown by regression analysis. It is revealed that there is an inverse relationship between gold and USD, gold prices are not dependent on crude oil prices, repo interest rates do not affect gold prices and gold prices are not affected by inflation rates. The data set of November 2006 and December 2011 was used in these tests.
Erb and Harvey (2017) aimed to reach the fair value of gold by examining whether inflation is the main determinant of the gold price in the long term. The fact that gold is not an instrument with fixed or expected cash flows, makes it difficult to reach the fair value of gold. For this reason, the relationship between gold and long-term inflation rates has been examined, and gold based price deviations have been observed with respect to nominal USD based gold price and US inflation. In the long term, it was concluded that the deviations between nominal and inflation adjusted price is corrected in the long term.
Andersen, Bollerslev, Diebold and Vega (2001), compared the changes of the value of USD versus DEM, GBP, JPY, CHF and EUR, using a data set of the 6-year real-time exchange rates for January 1992 and December 1998. In particular, they concluded that the surprise variables related to macroeconomic data, namely the differences between expectations and realizations, created movements in exchange rates and the foreign exchange market dynamics were shaped by new news in the main variables. It was observed that the data had an asymmetric effect and the effect of bad news was higher than the effect of good news.
Andersson, Overby and Sebestyen (2009), examined the response of the intraday prices to the large macroeconomic explanations and the ECB monetary policy statements in the German bond market, by using a data set for the period 1999 - 2005. It has been observed that the German bond market has been more responsive to US macroeconomic data disclosures compared to the Euro Area and UK data, and the strength of these reactions has increased over the period considered.
Balduzzi, Elton and Green (2001), used the effects of macroeconomic statements on prices, transaction volume and purchase-sale spreads in the day-to-day data belonging to the government bond market. 17 different surprise variables were observed to have an effect on at least one of the variables such as, 3-month Treasury bond yield, 2, 10 and 30-year Treasury bond interest. These effects may vary depending on the maturities of debt securities. Publicly disclosed data or new news significantly explain price fluctuations and generally price fluctuations occur within one minute of the data or news release. In the study, the increase in volatility and transaction volume after data explanations or news were also examined. Besides, buy-sell spreads are opened during data descriptions but return to their normal values within 5 to 15 minutes.
Brenner, Pasquariello and Subrahmanyam (2009) relate the short-term movements of the US stock, Treasury and corporate bond markets and US macroeconomic surprise variables to correlate financial markets and the real economy. Specifically, it is concluded that the macroeconomic variables described in the US are effective not only on price levels but also on volatility. The analyses were performed using several variations of the GARCH-DCC model. As a result of empirical studies, it was seen that the price formation process and their interactions in each of the financial markets were directed by the surprises in the basic variables. It has been observed that the stock, Treasury and corporate bond markets react asymmetrically to the content of surprise variables.
CHAPTER 4
METHOD AND DATA SET
In this section, the data set used in the research and the method followed in the creation of the model are described.
4.1. METHOD
When the financial time series are examined, small changes, small changes, and large changes are followed by volatility clusters. This volatility may also change over time, with successive dependence being observed, especially when using high frequency data. Autoregressive Conditional Heteroskedasticity (ARCH), GARCH and EGARCH models are generally used in the modelling of volatility. In this part of the study, theoretical information about ARCH, GARCH and EGARCH models will be given.
We consider two different versions for all models where in the first version surprise variables are added to the return equation and in the second one they are added to the volatility equation.
4.1.1. Autoregressive Conditional Heteroskedasticity (ARCH) Model
First of all, the ARCH model introduced by Engle (1982) recognizes that the variance of error terms is not constant. Traditional econometric models assume a fixed period estimation variance. ARCH is the regression model where the conditional variance of the error term is explained by squares of the previous period error terms. It is shown as ARCH (p), where p is the delay length of the error terms frames.
In ARCH model structure, conditional variance is allowed to change over time while unconditional variance is constant. Conditional variance should be positive
for all the values of εt. The etr and θi parameters must be positive for this condition. Since conditional variance ε2t-1 am ε2t-p cannot be negative, it will not be negative. In order to achieve this, the sum of all parameters except must be less than 1. Otherwise, the variance will take infinite values. In addition, to ensure that the variance is positive, a requirement of 0 ≤ 𝜃 ≤ 1 must also be provided. In this situation; First version Mean Equation: 𝑌𝑡= 𝜇 + 𝛽1𝑆1+ 𝛽2𝑆2+ 𝛽3𝑆3+ 𝛽4𝑆4+ 𝛽5𝑆5+ 𝜀𝑡 Variance Equation: ℎ𝑡 = 𝜔 + 𝜃1𝜀𝑡−12 + . . . + 𝜃𝑝𝜀𝑡−𝑝2 Second version Mean Equation: 𝑌𝑡= 𝜇 + 𝜀𝑡 Variance Equation: ℎ𝑡 = 𝜔 + 𝛼1𝑆1+ 𝛼2𝑆2+ 𝛼3𝑆3+ 𝛼4𝑆4+ 𝛼5𝑆5+ 𝜃1𝜀𝑡−12 + . . . + 𝜃𝑝𝜀𝑡−𝑝2
where 𝑆𝑖 is the surprise variable for i=1,..,5.
In his study of predicting the variance in the UK's inflation, Engle proposed the LM (Lagrange multiplier) test to determine the existence of a problem of variable variance. ARCH models include some weaknesses compared to more advanced GARCH and EGARCH models. ARCH models ignore the asymmetric effect. In other words, it gives the same weight to positive and negative shocks. The ARCH model only consists of squares of delayed error terms, while the GARCH equation adds conditional variance terms to the model in the variance equation. ARCH terms can explain the short-term volatility changes well. However, there are shortcomings in explaining long-term volatility.
4.1.2. Generalized Autoregressive Conditional Heteroskedasticity (GARCH) Model
The GARCH model, which was first introduced to the literature by Bollerlev (1986), is a more developed version of the ARCH model. The ARCH model only consists of squares of delayed error terms, while the GARCH equation adds conditional variance terms to the model in the variance equation. In our case th return equations for first and second versions are the same with ARCH model but variance equations are as follows:
Variance Equations; First version: ℎ𝑡 = 𝜔 + 𝜃1𝜀𝑡−12 + . . . + 𝜃𝑝𝜀𝑡−𝑝2 + ∆1ℎ𝑡−1+ ⋯ + ∆1ℎ𝑡−1 Second version: ℎ𝑡 = 𝜔 + 𝛼1𝑆1+ 𝛼2𝑆2+ 𝛼3𝑆3+ 𝛼4𝑆4+ 𝛼5𝑆5+ 𝜃1𝜀𝑡−12 + . . . + 𝜃𝑝𝜀𝑡−𝑝2 + ∆1ℎ𝑡−1+ ⋯ + ∆1ℎ𝑡−1
Restrictions on various parameters must be provided. In the model, ω>0, 0 ≤ 𝜃𝑖 < 1, 0 ≤ ∆𝑗< 1 of the parameters must be met. In this equation, p and q are GARCH degree and are expressed as GARCH (p, q). In order to maintain the stationary condition, ∑𝑝𝑖=1𝜃𝑖 + ∑𝑞𝑖=1∆𝑖= 1. The conditional variance of the term ε depends not only on the square of the error term in the previous time period, but also on the conditional variance in the previous time period (Gujarati, 2004).
The most important deficiency in GARCH models is the neglect of asymmetric effects. In the GARCH variance equations, the frames of error terms are used, so there is no information about the asymmetric effects of positive and negative shocks. For this reason, EGARCH models which take the asymmetrical effect as a higher model of ARCH and GARCH models are used in financial data analysis.