IS GLOBALISATION
INCREASING THE DEPTH OF
GROWTH RECESSION?
Andre Dramais
November 2010
Working Paper No: 3 EU/3/2010
İstanbul Bilgi University, European Institute, Dolapdere Campus,
Kurtulufl Deresi Cad. Yahya Köprüsü Sk. No: 1
34440 Dolapdere / ‹stanbul, Turkey
Phone: +90 212 311 52 40 • Fax: +90 212 250 87 48
e-mail: [email protected] • http://eu.bilgi.edu.tr
IS GLOBALISATION INCREASING THE DEPTH OF
GROWTH RECESSION?
Andre Dramais
1November 2010
Summary
The present recession is not only one of the worst the world has experienced in many years, but
also made its appearance in many countries almost simultaneously. The paper postulates that
such a phenomenon may be linked to the considerable increase in the degree of openness in many
countries and the narrow trade and financial linkages that this entails. In other words, once trade
decreases in one major global actor, the loss of exports diffuses fast into the global economy and
has strong multiplying effects. In the present case, while the financial crisis has worsened the
sit-uation, it is not the main culprit.
Introduction
Since 1960, the share of exports and imports
2has considerably increased in all countries. Even
in an economy always regarded as «very closed», i.e. the United States of America, exports,
which were only 5.2% of GDP in 1960, had jumped to 11 % by 2000 and reached their record
level of 12.7% in 2008, just before the present recession. Similarly, imports jumped from 4.4%
of GDP in 1960 to 14.9% in 2000 and 17.3% in 2008. Even in a very open economy like
Bel-gium, the share of exports was 35.9% in 1960 and reached 85.8 % in 2008.
3In the same way,
in all the large members of the European Union these shares at least doubled over the same
pe-riod. Finally, in more recent times, the so-called emergent countries also increased their trade
shares considerably.
All this means that any export shock is likely to have a greater impact on GDP growth than
ever before and to diffuse more once major countries contract their final demand. The current
recession, according to the ECRI
4is, to date, the most simultaneous in many countries and, as a
result, export demand has crumbled and is in fact much larger than the fall in industrial
produc-tion and GDP.
In this paper, we will in section 1 present the evolution of trade openness and in section 2
we will analyse the present recession in more detail. Section 3 will deal with financial linkages
and will be followed by our conclusions.
1
The author is retired from the European Commission and presently Research Director in ECOMOD.
2
In this note, the terms « exports » and « imports » are used for total exports (and imports) of goods and
servi-ces, national accounts definition.
3
Imports at the same time were respectively at 36.3 and 84.9% GDP in 1960 and 2008.
4
is globalisation increasing the depth of growth recession?1. The long term evolution of trade shares in GDP
Tables 1, 2 and 3 present the evolution of trade shares for the major OECD economies from 1960
to 2008. These are presented as the share of exports in GDP (tab. 1), as the share of imports in
GDP (tab. 2) and finally the share of the average of exports and imports in GDP (tab. 3). In order
to keep the table to a reasonable size only figures at five years intervals are presented.
Table 1. Share of total Exports of goods and services in GDP, 1960-2008 in % ( Xgs/GDP)
Country 1960 1965 1970 1975 1980 1985 1990 1995 2000 2005 2006 2007 2008 Belgium 35.9 39.9 48.2 50.1 54.6 68.0 67.1 65.4 78.2 80.2 82.3 83.4 85.8 Denmark 32.6 29.6 28.0 30.2 33.2 37.4 37.2 37.6 46.6 49.0 52.0 52.3 54.9 Germany na na na na na na na 24.0 33.4 41.1 45.4 46.9 47.3 W. Germany 19.2 18.2 21.4 24.2 26.3 32.4 32.3 na na na na na na Ireland 29.3 32.1 34.0 39.3 45.6 55.4 56.3 76.3 96.3 81.8 79.8 80.9 83.5 Greece 11.8 9.1 9.4 16.8 22.9 19.1 17.5 17.1 24.9 22.4 22.6 22.7 23.2 Spain 8.3 8.1 12.3 12.6 14.7 21.4 16.1 22.4 29.0 25.7 26.3 26.9 26.5 France 14.6 13.3 15.7 18.6 21.0 23.4 21.2 22.8 28.6 26.1 26.7 26.5 26.4 Italy 12.5 14.3 15.8 19.5 21.0 22.0 19.2 25.7 27.1 25.9 27.7 29.0 28.8 Luxemburg 89.0 82.9 91.3 95.0 90.9 111.6 101.5 106.4 150.0 155.8 168.9 177.2 172.8 Netherlands 47.8 42.9 44.8 49.1 52.3 62.1 56.5 59.4 70.1 69.6 72.8 74.8 76.8 Austria 22.2 22.9 28.4 29.1 32.8 36.2 37.1 34.9 46.4 54.2 56.8 59.7 59.4 Portugal 16.4 19.1 19.7 16.2 22.6 31.2 30.7 28.6 29.8 28.5 32.0 32.8 33.0 Finland 21.3 19.2 24.3 22.4 31.1 28.4 22.5 36.4 43.5 41.8 45.2 45.7 47.0 Sweden 22.9 21.7 24.0 28.1 29.7 35.8 30.5 39.8 46.6 18.7 51.5 52.6 54.2 UK 19.8 18.4 22.2 25.4 27.1 28.8 24.0 28.2 27.6 26.4 28.5 26.6 29.2 USA 5.2 5.2 5.8 8.5 10.1 7.2 9.6 11.0 11.0 10.4 11.0 11.8 12.7 Japan 10.6 10.4 10.7 12.6 13.5 14.2 10.4 9.1 11.0 14.3 16.1 17.6 17.4 Canada 17.0 18.6 22.3 22.4 28.1 28.3 25.8 37.3 45.6 37.8 36.0 34.7 35.1 Korea na na 12.9 25.4 30.3 30.2 26.4 27.2 38.6 39.3 39.7 41.9 52.9 Australia 12.7 12.9 12.9 13.7 15.1 15.3 16.2 19.2 22.7 20.3 20.6 20.7 25.0 New Zealand 21.6 20.9 22.2 23.4 29.4 29.5 26.8 29.0 35.5 27.9 29.1 28.5 31.8 Source: Database AMECO of DG ECFIN European Commission, March 2010
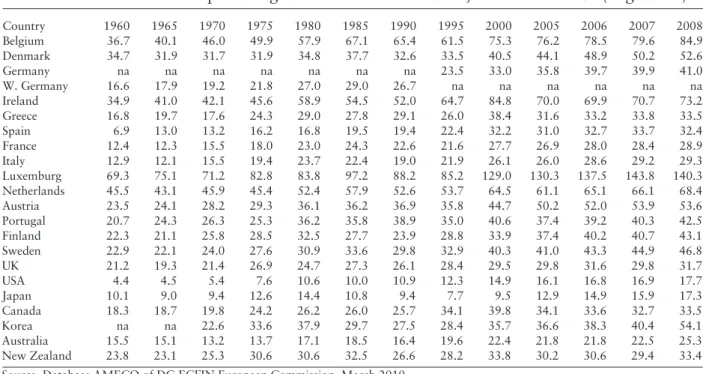
Table 2. Share of total Imports of goods and services in GDP, 1960-2008 in % ( Xgs/GDP)
Country 1960 1965 1970 1975 1980 1985 1990 1995 2000 2005 2006 2007 2008 Belgium 36.7 40.1 46.0 49.9 57.9 67.1 65.4 61.5 75.3 76.2 78.5 79.6 84.9 Denmark 34.7 31.9 31.7 31.9 34.8 37.7 32.6 33.5 40.5 44.1 48.9 50.2 52.6 Germany na na na na na na na 23.5 33.0 35.8 39.7 39.9 41.0 W. Germany 16.6 17.9 19.2 21.8 27.0 29.0 26.7 na na na na na na Ireland 34.9 41.0 42.1 45.6 58.9 54.5 52.0 64.7 84.8 70.0 69.9 70.7 73.2 Greece 16.8 19.7 17.6 24.3 29.0 27.8 29.1 26.0 38.4 31.6 33.2 33.8 33.5 Spain 6.9 13.0 13.2 16.2 16.8 19.5 19.4 22.4 32.2 31.0 32.7 33.7 32.4 France 12.4 12.3 15.5 18.0 23.0 24.3 22.6 21.6 27.7 26.9 28.0 28.4 28.9 Italy 12.9 12.1 15.5 19.4 23.7 22.4 19.0 21.9 26.1 26.0 28.6 29.2 29.3 Luxemburg 69.3 75.1 71.2 82.8 83.8 97.2 88.2 85.2 129.0 130.3 137.5 143.8 140.3 Netherlands 45.5 43.1 45.9 45.4 52.4 57.9 52.6 53.7 64.5 61.1 65.1 66.1 68.4 Austria 23.5 24.1 28.2 29.3 36.1 36.2 36.9 35.8 44.7 50.2 52.0 53.9 53.6 Portugal 20.7 24.3 26.3 25.3 36.2 35.8 38.9 35.0 40.6 37.4 39.2 40.3 42.5 Finland 22.3 21.1 25.8 28.5 32.5 27.7 23.9 28.8 33.9 37.4 40.2 40.7 43.1 Sweden 22.9 22.1 24.0 27.6 30.9 33.6 29.8 32.9 40.3 41.0 43.3 44.9 46.8 UK 21.2 19.3 21.4 26.9 24.7 27.3 26.1 28.4 29.5 29.8 31.6 29.8 31.7 USA 4.4 4.5 5.4 7.6 10.6 10.0 10.9 12.3 14.9 16.1 16.8 16.9 17.7 Japan 10.1 9.0 9.4 12.6 14.4 10.8 9.4 7.7 9.5 12.9 14.9 15.9 17.3 Canada 18.3 18.7 19.8 24.2 26.2 26.0 25.7 34.1 39.8 34.1 33.6 32.7 33.5 Korea na na 22.6 33.6 37.9 29.7 27.5 28.4 35.7 36.6 38.3 40.4 54.1 Australia 15.5 15.1 13.2 13.7 17.1 18.5 16.4 19.6 22.4 21.8 21.8 22.5 25.3 New Zealand 23.8 23.1 25.3 30.6 30.6 32.5 26.6 28.2 33.8 30.2 30.6 29.4 33.4 Source: Database AMECO of DG ECFIN European Commission, March 2010
is globalisation increasing the depth of growth recession?
5
Table 3. Average share of total Exports and Imports of goods and services in GDP 1960-2008,
in % ((Xgs+Mgs)/2)/GDP
Country 1960 1965 1970 1975 1980 1985 1990 1995 2000 2005 2006 2007 2008 Belgium 36.3 40.0 47.1 50.0 56.2 67.6 66.3 63.5 76.8 78.2 80.4 81.5 85.3 Denmark 33.6 30.7 29.9 31.0 34.0 37.6 34.9 35.5 43.5 46.5 50.5 51.2 53.7 Germany na na na na na na na 237 33.2 38.5 42.5 43.4 44.1 W. Germany 17.9 18.0 20.3 23.0 26.6 30.7 29.5 na na na na na an Ireland 32.1 36.5 38.0 42.5 52.2 54.9 54.4 70.5 91.6 75.9 74.9 75.8 78.3 Greece 14.3 14.4 13.5 20.5 26.0 23.5 23.3 21.6 31.6 27.0 27.9 28.3 28.3 Spain 7.6 10.6 12.8 14.4 15.7 20.5 17.8 22.4 30.6 28.3 29.5 30.3 29.5 France 13.5 12.8 15.6 18.3 22.0 23.9 21.9 22.2 28.1 26.5 27.4 27.4 27.7 Italy 12.7 13.2 15.7 19.5 22.4 22.2 19.1 23.8 26.6 26.0 28.1 29.1 29.1 Luxemburg 79.2 79.0 81.2 88.9 87.4 104.4 94.9 95.8 139.5 143.1 153.2 160.5 156.5 Netherlands 46.6 43.0 45.4 47.2 52.4 60.0 54.5 56.5 67.3 65.4 69.0 70.5 72.6 Austria 22.8 23.5 28.3 29.2 34.5 36.2 37.0 35.3 45.5 52.2 54.4 56.8 56.5 Portugal 18.6 21.7 23.0 20.7 29.4 33.5 34.8 31.8 35.2 33.0 35.1 36.5 37.7 Finland 21.8 20.1 25.1 25.4 31.8 28.0 23.2 32.6 38.7 39.6 42.7 43.2 45.0 Sweden 22.9 21.9 24.0 27.9 30.3 34.7 30.2 36.4 43.4 44.9 47.4 48.7 50.5 UK 20.5 18.8 21.8 26.1 25.9 28.1 25.0 28.3 28.6 28.1 30.1 28.2 30.4 USA 4.8 4.8 5.6 8.1 10.4 8.6 10.3 11.6 13.0 13.2 13.9 14.4 15.2 Japan 10.4 9.7 10.0 12.6 14.0 12.5 9.9 8.4 10.3 13.6 15.5 16.8 17.4 Canada 17.7 18.7 21.0 23.0 27.2 27.1 25.7 35.7 42.7 35.9 34.8 33.7 34.3 Korea na na 17.7 29.5 34.1 30.0 27.0 27.8 37.1 37.9 39.0 41.2 53.5 Australia 14.1 14.0 13.0 13.7 16.1 16.9 16.3 19.4 22.5 21.0 21.2 21.6 25.1 New Zealand 22.7 22.0 23.7 27.0 30.0 31.0 26.7 28.6 34.7 29.1 29.8 29.0 32.6 Source: Database AMECO of DG ECFIN European Commission, March 2010Graph 1. Share of total Exports for selected countries.
Thus, all countries registered considerable increases in their trade shares, and the same is
true for countries not presented in these tables. For instance, in Asia, exports as a % of GDP
grew between 1993 and 2008 in Taiwan from about 40% to 70%, Korea from about 20% to
64%, China from about 12% to 34% and India from about 10% to 22%.
100,0 90,0 80,0 70,0 60,0 50,0 40,0 30,0 20,0 10,0 0,0 1960 1965 1970 1975 1980 1985 1990 1995 2000 2005 2006 2007 2008 Belgium Germany United States France
6
is globalisation increasing the depth of growth recession?This means of course that any export shock, whatever its cause, will be transmitted to GDP
in a much stronger way in the 21st century than in the 20th, with stronger consequences for
in-come and employment in the whole economy.
2. The present recession: 2009, 2010 ...?
Is the present recession different from former ones? Leaving aside the financial crisis as an
aggra-vating factor but not the cause, the present recession is, to date, the most simultaneous one.
The ECRI maintains for twenty-one countries
5a database of peaks and troughs in business
cycles based on a set of indicators of output, employment, sales and incomes. This approach is
more sophisticated than the current simplistic definition of “two quarters of negative GDP
growth”.
In fact, the ECRI defines recession as a “vicious circle”, in which a fall in some measure of
economic activity sets off a cascading decline in other coincident measures of economic activity.
The domino effect of, say, a fall in sales inducing a fall in output, employment and income,
which in turn generates further falls in the same indicators is what marks the start of a
recession-ary downturn
In this context, the severity of a recession is measured by three factors:
Its
diffusion, i.e. how many countries were in recession at the same time?
Its
depth, i.e. the amplitude of the fall in many indicators, industries and region(s) of a
country
Its
duration i.e. the number of months before a recovery is clearly visible and durable
2.1. Diffusion:
The diffusion of a recession can be observed via three kinds of observation:
The clustering of the start of recession dates
The proportion of economies in expansion
The co-movement of coincident indices
Compared to the last recession at the beginning of this century, the clustering is clear. In
the last recession, major countries fell into recession in the months between August 2000 and
January 2003, whereas now they are all clustered between December 2007 and July 2008.
The proportion of countries in expansion in the twenty-one countries tracked fell to 30%
in January 1975, but only to 55% in January 1991 and 70% between January 2001 and
Janu-ary 2004. At present, this proportion fell from 100% in JanuJanu-ary 2007 to 50% in JanuJanu-ary 2008
and 20% in January 2009.
Finally the movement of coincident indicators is measured by the proportion of the
co-incident indexes that were higher than they had been three months previously.
For the G7 countries, the index fell from 100 at the end of 2007 to 0 in the late summer of
2008, meaning that all G7 countries were simultaneously in recession. For the 21countries, the
movement was ± the same, but the fall in 2008 was not steep, reaching 10 in March 2008 from
100 in 2006 and 80 in 2007.
Thus, according to all indicators, the present recession is the most simultaneous to date.
5
USA, Canada, Mexico, Brazil, Germany, France, UK, Italy, Spain, Switzerland, Sweden, Austria, Japan, China,
India, Korea, Taiwan, Australia, New Zealand, South Africa, Jordan
is globalisation increasing the depth of growth recession?
7
2. 2. Depth
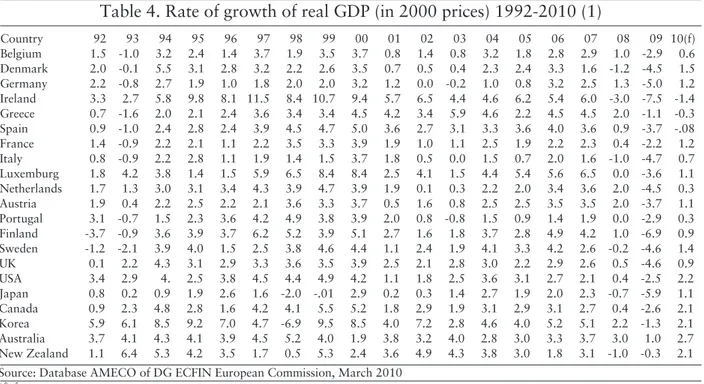
Table 4 gives the rates of growth of real GDP for the period 1992-2010 according to the
latest forecast of the European Commission. As may be seen, the fall in 2008-2009 was much
larger in most countries than in any of the previous twenty years.
Table 4. Rate of growth of real GDP (in 2000 prices) 1992-2010 (1)
Country 92 93 94 95 96 97 98 99 00 01 02 03 04 05 06 07 08 09 10(f) Belgium 1.5 -1.0 3.2 2.4 1.4 3.7 1.9 3.5 3.7 0.8 1.4 0.8 3.2 1.8 2.8 2.9 1.0 -2.9 0.6 Denmark 2.0 -0.1 5.5 3.1 2.8 3.2 2.2 2.6 3.5 0.7 0.5 0.4 2.3 2.4 3.3 1.6 -1.2 -4.5 1.5 Germany 2.2 -0.8 2.7 1.9 1.0 1.8 2.0 2.0 3.2 1.2 0.0 -0.2 1.0 0.8 3.2 2.5 1.3 -5.0 1.2 Ireland 3.3 2.7 5.8 9.8 8.1 11.5 8.4 10.7 9.4 5.7 6.5 4.4 4.6 6.2 5.4 6.0 -3.0 -7.5 -1.4 Greece 0.7 -1.6 2.0 2.1 2.4 3.6 3.4 3.4 4.5 4.2 3.4 5.9 4.6 2.2 4.5 4.5 2.0 -1.1 -0.3 Spain 0.9 -1.0 2.4 2.8 2.4 3.9 4.5 4.7 5.0 3.6 2.7 3.1 3.3 3.6 4.0 3.6 0.9 -3.7 -.08 France 1.4 -0.9 2.2 2.1 1.1 2.2 3.5 3.3 3.9 1.9 1.0 1.1 2.5 1.9 2.2 2.3 0.4 -2.2 1.2 Italy 0.8 -0.9 2.2 2.8 1.1 1.9 1.4 1.5 3.7 1.8 0.5 0.0 1.5 0.7 2.0 1.6 -1.0 -4.7 0.7 Luxemburg 1.8 4.2 3.8 1.4 1.5 5.9 6.5 8.4 8.4 2.5 4.1 1.5 4.4 5.4 5.6 6.5 0.0 -3.6 1.1 Netherlands 1.7 1.3 3.0 3.1 3.4 4.3 3.9 4.7 3.9 1.9 0.1 0.3 2.2 2.0 3.4 3.6 2.0 -4.5 0.3 Austria 1.9 0.4 2.2 2.5 2.2 2.1 3.6 3.3 3.7 0.5 1.6 0.8 2.5 2.5 3.5 3.5 2.0 -3.7 1.1 Portugal 3.1 -0.7 1.5 2.3 3.6 4.2 4.9 3.8 3.9 2.0 0.8 -0.8 1.5 0.9 1.4 1.9 0.0 -2.9 0.3 Finland -3.7 -0.9 3.6 3.9 3.7 6.2 5.2 3.9 5.1 2.7 1.6 1.8 3.7 2.8 4.9 4.2 1.0 -6.9 0.9 Sweden -1.2 -2.1 3.9 4.0 1.5 2.5 3.8 4.6 4.4 1.1 2.4 1.9 4.1 3.3 4.2 2.6 -0.2 -4.6 1.4 UK 0.1 2.2 4.3 3.1 2.9 3.3 3.6 3.5 3.9 2.5 2.1 2.8 3.0 2.2 2.9 2.6 0.5 -4.6 0.9 USA 3.4 2.9 4. 2.5 3.8 4.5 4.4 4.9 4.2 1.1 1.8 2.5 3.6 3.1 2.7 2.1 0.4 -2.5 2.2 Japan 0.8 0.2 0.9 1.9 2.6 1.6 -2.0 -.01 2.9 0.2 0.3 1.4 2.7 1.9 2.0 2.3 -0.7 -5.9 1.1 Canada 0.9 2.3 4.8 2.8 1.6 4.2 4.1 5.5 5.2 1.8 2.9 1.9 3.1 2.9 3.1 2.7 0.4 -2.6 2.1 Korea 5.9 6.1 8.5 9.2 7.0 4.7 -6.9 9.5 8.5 4.0 7.2 2.8 4.6 4.0 5.2 5.1 2.2 -1.3 2.1 Australia 3.7 4.1 4.3 4.1 3.9 4.5 5.2 4.0 1.9 3.8 3.2 4.0 2.8 3.0 3.3 3.7 3.0 1.0 2.7 New Zealand 1.1 6.4 5.3 4.2 3.5 1.7 0.5 5.3 2.4 3.6 4.9 4.3 3.8 3.0 1.8 3.1 -1.0 -0.3 2.1 Source: Database AMECO of DG ECFIN European Commission, March 2010
(f) forecast
(1) 1992 was chosen as starting date in order to have figures for unified Germany
2.3. Duration
In terms of duration, the recession started between December 2007 and July 2008 and is
still going on in April 2010, making it the longest of the post-war period.
Thus, we may say that the recession is the most severe registered in half a century.
This seems to be mostly caused by the bullwhip effect of the fall in domestic demand on
exports as shown in table 5 below:
8
is globalisation increasing the depth of growth recession?Table 5. Rate of growth of real Exports (in 2000 prices) 1992-2010 (1)
Countries 92 93 94 95 96 97 98 99 00 01 02 03 04 05 06 07 08 09 10f Belgium 3.7 -0.4 8.3 5.0 3.7 10.0 4.8 4.5 13.6 11 2.7 0.8 6.6 4.6 5.0 4.5 1.5 -15.7 1.4 Denmark 0.5 1.0 8.4 3.1 4.2 4.9 4.1 11.6 12.7 3.1 4.1 -1.0 2.8 8.0 9.1 2.2 2.2 -10.3 2.1 Germany -.8 -4.9 8.0 6.3 6.0 11.7 8.0 5.9 13.5 6.4 4.3 2.5 10.3 7.7 13.0 7.5 2.9 -15.4 2.6 Ireland 13.9 9.7 15.1 20.0 12.6 17.6 23.1 15.6 20.2 8.6 5.2 0.6 7.5 5.2 5.1 8.6 -1.0 -3.4 1.2 Greece 10.0 -2.6 7.4 3.0 3.5 20.0 5.2 18.1 14.1 0.0 -8.4 2.9 17.4 2.4 5.3 5.8 4.0 -11.8 2.7 Spain 7.5 7.8 16.7 9.4 10.3 15.0 8.0 7.5 10.2 4.2 2.0 3.7 4.2 2.5 6.7 6.6 -1.0 -13.0 1.3 France 5.8 0.2 8.1 8.4 3.7 12.9 8.2 4.6 12.4 2.5 1. 5 -1.0 4.0 3.1 4.8 2.6 -0.2 -10.9 2.8 Italy 6.8 8.7 9.6 12.4 1.5 5.1 2.5 -0.4 11.9 2.6 -2.9 -2.0 4.9 1.01 6.2 4.6 -3.7 -20.2 1.6 Luxemburg 2.7 4.8 7.7 4.6 2.3 11.4 11.2 14.2 12.6 4.5 2.1 6.8 11.1 4.5 13.3 8.8 1.5 -10.0 1.8 Netherlands 2.9 4.0 8.7 9.2 14.4 10.9 6.8 8.7 13.5 1.9 0.9 1.5 7.9 6.0 7.3 6.7 2.7 -10.8 1.9 Austria 1.3 -2.4 5.7 7.2 4.6 11.8 8.3 6.1 13.4 6.2 3.9 1.5 10.1 7.4 7.5 9.4 0.8 -13.7 2.1 Finland 9.5 16.4 13.6 8.5 5.9 14.0 9.2 11.3 17.2 2.1 2.8 -1.7 8.6 7.0 11.8 8.1 7.3 -25.3 4.6 Sweden 2.0 8.3 13.5 11.3 4.1 13.6 8.7 7.1 11.5 0.8 1.3 4.0 11.0 6.6 8.9 5.8 1.8 -14.4 1.9 UK 4.2 4.5 9.2 9.4 8.8 8.1 3.1 3.7 9.1 3.0 1.0 1.8 5.0 7.9 11.3 -2.8 1.0 -11.5 1.8 USA 6.9 3.3 8.7 10.1 8.3 11.9 2.3 4.4 8.6 -5.6 -2.0 1.6 9.5 6.7 9.0 8.7 5.4 -10.9 7.7 Japan 4.4 0.4 3.9 4.2 5.9 11.1 -2.7 1.9 12.7 -6.9 7.5 9.2 13.9 7.0 9.7 8.4 1.8 -26.6 7.9 Canada 7.2 10.8 12.7 8.5 5.6 8.3 9.1 10.7 8.9 -3.0 1.2 -2.3 5.0 1. 8 0.6 1.0 -4.4 -14.8 5.0 Korea 12.2 12.2 16.3 24.4 12.2 21.6 12.7 14.6 19.1 -3.4 12.1 14.5 19.7 7.8 11.4 12.6 5.7 -13.4 8.2 Australia 6.9 10.0 5.1 10.0 11.0 4.2 2.2 8.5 7.6 -1.0 -0.4 32.1 3.1 2.2 3.8 4.5 6.6 2.4 5.0 New Zealand 3.2 6.9 8.5 2.3 4.7 3.9 2.9 7.4 6.3 3.0 7.8 0.9 4.6 0.0 3.1 2.9 -0.7 -0.5 3.3 Source: Database AMECO of DG ECFIN European Commission, March 2010
(f) forecast
(1) 1992 was chosen as starting date in order to have figures for unified Germany
The comparison of GDP drops in table 4 and the real exports flow in table 5 go a long way
in explaining the severity of the recession, especially when we recall the large increase in the
de-gree of openness: Practically all industrialized countries registered double digit negative rates in
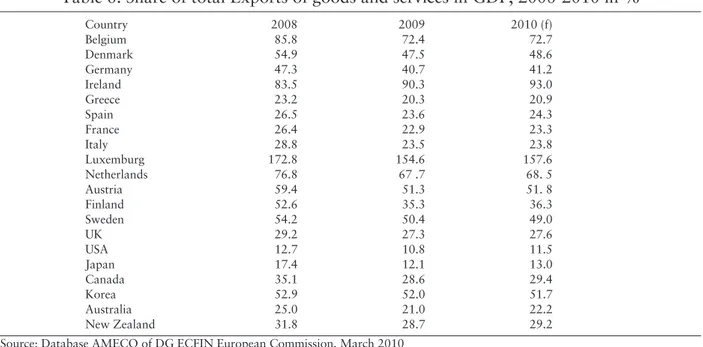
2009 and indeed the share of exports in GDP fell everywhere by significant amounts, as shown
in table 6. Thus, a fall in domestic demand caused a greater switch in demand growth for
im-ported products, which increased the severity of the recession in exporting countries.
This of course is also a blessing in disguise since it reduces slightly the vulnerability of these
economies to a reduction in demand from the others…
Table 6. Share of total Exports of goods and services in GDP, 2008-2010 in %
Country 2008 2009 2010 (f) Belgium 85.8 72.4 72.7 Denmark 54.9 47.5 48.6 Germany 47.3 40.7 41.2 Ireland 83.5 90.3 93.0 Greece 23.2 20.3 20.9 Spain 26.5 23.6 24.3 France 26.4 22.9 23.3 Italy 28.8 23.5 23.8 Luxemburg 172.8 154.6 157.6 Netherlands 76.8 67 .7 68. 5 Austria 59.4 51.3 51. 8 Finland 52.6 35.3 36.3 Sweden 54.2 50.4 49.0 UK 29.2 27.3 27.6 USA 12.7 10.8 11.5 Japan 17.4 12.1 13.0 Canada 35.1 28.6 29.4 Korea 52.9 52.0 51.7 Australia 25.0 21.0 22.2 New Zealand 31.8 28.7 29.2
Source: Database AMECO of DG ECFIN European Commission, March 2010 (f) forecast
is globalisation increasing the depth of growth recession?
9
4. The impact of financial linkages.
Although the recession started BEFORE the financial turmoil, the latter undoubtedly
contribut-ed to the severity of the former.
The US financial crisis, triggered by the deep fall in the value of subprime mortgages and
their titularisation, diffused throughout the world and, due to the freedom of capital movements,
these corrupted financial instruments were diffused among investors who did not fully
under-stand what they really represented.
In fact, in the fourth quarter of 2008, foreign investors owned almost nine times the
amount of US market credit instruments as they did in 1990.
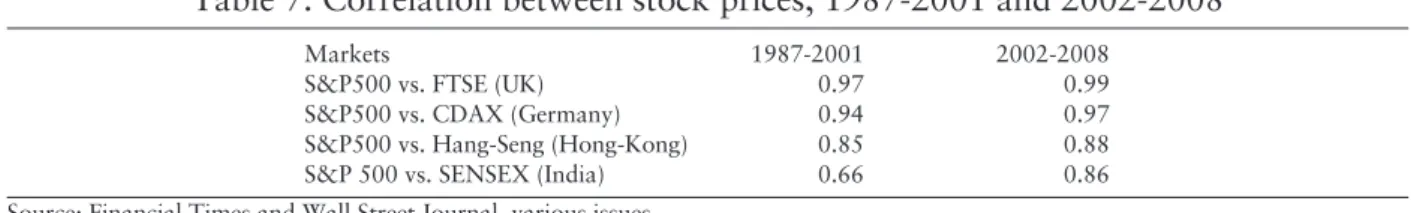
The strength of the financial linkages may be measured by correlation
6between the
vari-ous stock exchanges in the world and the S&P500 in the US as presented in table 7 below.
7Table 7. Correlation between stock prices, 1987-2001 and 2002-2008
Markets 1987-2001 2002-2008
S&P500 vs. FTSE (UK) 0.97 0.99
S&P500 vs. CDAX (Germany) 0.94 0.97
S&P500 vs. Hang-Seng (Hong-Kong) 0.85 0.88
S&P 500 vs. SENSEX (India) 0.66 0.86
Source: Financial Times and Wall Street Journal, various issues.