Contents lists available atScienceDirect
Socio-Economic Planning Sciences
journal homepage:www.elsevier.com/locate/sepsEfficiency analysis of emergency departments in metropolitan areas
Can Akkan
a,∗, Melis Almula Karadayi
b, Yeliz Ekinci
c, Füsun Ülengin
a, Nimet Uray
d,
Elif Karaosmanoğlu
eaSchool of Management, Sabanci University, Tuzla, Istanbul, 34945, Turkey
bDepartment of Industrial Engineering, Istanbul Medipol University, Beykoz, Istanbul, 34810, Turkey cDepartment of Business Administration, Istanbul Bilgi University, Eyüp, Istanbul, 34060, Turkey dDepartment of Business Administration, Kadir Has University, Cibali, Istanbul, 34083, Turkey eDepartment of Management Engineering, Istanbul Technical University, Macka, Istanbul, 34367, Turkey
A R T I C L E I N F O Keywords:
Efficiency analysis Data envelopment analysis Emergency departments Turkey
A B S T R A C T
The demand in the healthcare industry is increasing exponentially due to aging population of the world and this is leading to a rapid increase in the cost of healthcare. The emergency departments of the hospitals are the frontline of health care systems and play an additional critical role in providing an efficient and high-quality response for patients. The overcrowding at the emergency departments due to growing demand results in a situation where the demand for ED services exceeds the ability to provide care in a reasonable amount of time. This has led countries to reconsider their health policies in a way to increase their efficiency in their healthcare systems in general and in emergency departments, in particular. As in many countries, there has been a steady and significant increase in the number of patients that seek health services at the emergency departments of state hospitals of Turkey, due to the significant structural reforms in health services since 2003. While meeting this increasing demand, it is ever more important to provide these critical health services efficiently. Therefore, the efficiency of the emergency departments of seven general hospitals run by Istanbul's Beyoglu State Hospitals Association have been analyzed using categorical Data Envelopment Analysis (DEA) models. The analysis of DEA results is supported by a set of statistical methods to make it easier for the hospital administrators to interpret the analysis and draw conclusions. The analysis shows that less-equipped EDs are supported by better equipped, larger EDs, resulting in a hub-and-spoke type of structure among the EDs where “satellite” EDs serve an im-portant referral function and thus evaluating their efficiency without taking the interoperability among these units into account would not be an accurate assessment of their performance.
1. Introduction
According to the OECD health report,1in 2016, the healthcare ex-penditures in the world showed the greatest increase rate of the last seven years with an average of 3.4% and is expected to increase even further in the near future. Although this increase has been the highest one since 2009, the level before crisis is still not reached. The average health expenditures showed an average of 4–6% increase rate and were greater than the economic growth before 2009. But since 2012, the health expenditures more closely follow the economic growth. During the financial crisis, especially European countries made important re-ductions in their health expenditures. As a result; in 2017 the per capita
health expenditure in Greece was 30% below its 2009 level (with 2010 prices), and Portugal, Italy and Spain have just reached their levels before the crisis.
In the crisis period, although a similar reduction in the growth of health expenditures was also experienced outside Europe, it managed to stay at least at a positive level. In Korea, the health expenditures con-tinue to increase by 6% since 2009 and the per capita health ex-penditure in 2017 is 55% higher than its 2009 level. However, Australia, Canada, and United States showed continuous growth of health expenditure and their per capita health expenditures is currently 10–20% higher than their 2009 levels.2On the other hand, China spent 20%, while India and Indonesia spent 10% below the OECD average.
https://doi.org/10.1016/j.seps.2019.01.001
Received 2 May 2018; Received in revised form 10 November 2018; Accepted 13 January 2019
∗Corresponding author.
E-mail addresses:[email protected](C. Akkan),[email protected](M.A. Karadayi),[email protected](Y. Ekinci), [email protected](F. Ülengin),[email protected](N. Uray),[email protected](E. Karaosmanoğlu).
1www.oecd.org/health.
2http://www.oecd.org/health/health-data.htm.
Available online 22 January 2019
0038-0121/ © 2019 Elsevier Ltd. All rights reserved.
In 2016, the per capita health expenditure of United States was almost three times higher than that of 35 OECD countries, and was 25% higher than Sweden's, which was second-ranked [1]. When compared with the G7 countries, United States spend 80% more on health than Germany and two times more than the per capita expenditure of Ca-nada. Health spending in OECD countries is now 9% of GDP on average ranging from 4.3% in Turkey to 17.2% in the United States. The OECD countries spending half or even less of the OECD average expenditure consist of countries such as Poland, Chile and Estonia, the lowest per capita expenditure belonging to Mexico and Turkey. The latter coun-tries show similarity to Russian Federation, South Africa and Brazil in this respect.
In Turkey, the health expenditures showed a consistent growth of 10% since 2009 and reached 105 billion TL in 2015 [2]. However, despite this growth, in 2017 the health expenditures of the country were 4.2% of the GDP, 8.9% below the OECD average [1]. In Turkey, the elder and high-risk age groups grow at a higher rate than the other age groups. As a result, the chronical diseases increase at a faster rate and showed a potential increase in health care demand [2].
Higher health spending is not necessarily a problem when the benefits exceed costs but there is ample evidence of inequities and in-efficiencies in health care. At least half of the world's population cannot obtain essential health services, according to a new report from the World Bank and the World Health Organization [3].
On the other hand, emergency departments (ED) of the hospitals are the frontline of health care systems and play a critical role in providing an efficient and high-quality response for patients. A growing demand for emergency care, however, results with an overcrowding experience referring to a situation where the demand for ED services exceeds the ability to provide care in a reasonable amount of time. There has been a dramatic increase in the number of patients visiting the EDs in almost all OECD countries. According to a research (Bercher, 2015), in 2011, the number of patients coming to ED departments in OECD countries constituted 31% of the population. With its 70% of the total population, Portugal has the highest number of ED visit/patient. In Spain, Canada, Greece and United States, the number of ED visit/patient constitute 40% of the population and is, in fact, much higher than the OECD average. In OECD countries, the number of patients visiting OECD countries experienced a growth rate of 2.4% between 2001 and 2011. The highest growth rate was seen in Germany, Belgium, England and New Zealand [4]. The patients visiting ED generally consist of very young and very old persons. The aging population in all OECD countries resulted in an increase in the number of patient visiting EDs.
In Turkey, as in other OECD countries, the increase in the number patients in EDs generally results with low satisfaction level of the pa-tients and increases the importance of measuring the performance ef-ficiency of these departments. Despite being the 17th biggest economy in the world in terms of nominal GDP [5], Turkey faces profound social and economic inequalities, too [6,7]. To solve the problems caused by inequality, governments make reforms, including those in health care. In Turkey, the major health care initiative of the recent years, the Health Transformation Program (HTP), was launched in 2003, which mostly aimed to make health care services more affordable for dis-advantaged social groups. As part of HTP, healthcare coverage was increased through the General Health Insurance System, 2021 new hospitals were opened in nine years and there was 74% increase in public health expenses. Accordingly, for Turkey, healthcare expenses as percent of GDP has increased from 2.5% in 1995 to 5.4% in 2014 [5]. One of the major improvement programs has been in the accessi-bility of emergency services and the expansion of 112 Emergency ser-vices (ambulance serser-vices), which increased the ratio of emergency services in the health expenditures to 1.8% from 0.3% in 8 years [8]. In addition to those patients being in critical condition, patients who should normally be treated in polyclinics (outpatients) tend to go to emergency services to accelerate their treatment process and reduce the fees they pay. This reduces the limited capacity of the emergency
services even further and makes the analysis of these units more crucial. As shown inFig. 1[9], the number of patients that apply to the EDs increase faster than the other departments in Turkey. The ratio of the emergency patients to all patients increased from 16.79% in 2002 to 31.76% in 2013 [9]. According to a news article that appeared in the Turkish newspaper Hürriyet, the number of visits to the emergency units per 100 persons is 130 in Turkey, compared to 45.1 in the US [10].
Administration of the state hospitals in Turkey is done by regional administrative associations (“Kamu Hastaneleri Birliği”) that are charged with ensuring the state-owned hospitals of the region provide effective and efficient healthcare services to the citizens. These regional associations, in turn, are organized under the National State Hospitals Administration (Türkiye Kamu Hastaneleri Kurumu). Beyoglu State Hospitals Association (BSHA) is the administrative association that oversees 11 hospitals in central Istanbul.Table 1provides a list of the selected hospitals, along with statistics on the number of patients (ex-cluded ones are specialized ones, such as a dental hospital). BSHA hospitals, due to the region's geographic centrality in Istanbul, in-cluding the main business districts of the city, attract patients that re-side outre-side the region as well. For instance, in 2013, 19% of the emergency patients in Istanbul were treated by BSHA hospitals; among these patients, 18% of them reside outside the region.
The aim of this study is to identify the most crucial input and output indicators and to develop models for measuring efficiency in emergency Fig. 1. Annual increase in the number of patients that apply to the EDs and other departments in Turkey (2003–2014) [9].
Table 1
Statistics on the number of patients (2014) at selected BSHA Hospitals. Hospital Acronym All Patients Emergency Patients Research and Teaching Hospitals
Okmeydanı OKRTH 2,255,969 248,287
Şişli Hamidiye Etfal SERTH 1,814,717 760,237 Gaziosmanpaşa Taksim GTRTH 1,210,677 145,476 State Hospitals
Eyüp EYSH 898,567 100,932
Kağıthane KASH 680,335 172,823
Sarıyer İstinye ISSH 618,454 30,177
services. It empirically tests, using Data Envelopment Analysis (DEA), which of these indicators are the most suitable input/output variables to assess the efficiency and generates models that could be used for further assessment and hence ranking of state hospitals based on their efficiency levels. Being the first study (to the best of our knowledge) that has employed DEA to measure emergency service efficiency, the models offered by this study can yield insights for hospital adminis-trators.
Our main contribution in this paper is the identification of practical and effective input-output variables for measuring efficiencies of EDs. In most practical situations, the administrators would need to analyze the efficiency of EDs in similar environmental conditions (such as same city, similar socio-economic environments), this would limit the number of EDs to be analyzed in an efficiency analysis. Hence, for an effective use of DEA, it is inevitable to have a rather restricted number of input and output variables. Our work has specifically shown that categorical DEA which employs a well-defined level category system for EDs is a viable approach to efficiency measurement. Furthermore, our fieldwork supported with the DEA analysis has shown that referrals from one ED to another is an important output of some EDs, which led us to the conclusion that, a hub and spoke system is a good strategy to provide effective emergency services. In such a hub-and-spoke system, less equipped smaller satellite EDs are supported by better equipped “hub” EDs.
The rest of the paper is organized as follows. Section2provides the literature review on the efficiency measurement in emergency services and emphasizes the reason for selecting Data Envelopment model to analyze the efficiency of emergency departments in this research. It also highlights the inputs/outputs variables used in the data envelopment models developed so far. Section3explains the methodology used in this research. Section4provides information about the proposed ca-tegorical DEA framework. Section 5interprets the model results and uses ALSCAL and principal component analysis to select the best DEA model for this study. Finally; conclusions and further suggestions are given.
2. Efficiency measurement in emergency services and the use of DEA
Generally, efficiency in the healthcare sector is analyzed using ei-ther parametric (e.g. a regression-based Stochastic Frontier Analysis, SFA) or non-parametric methods (e.g. Data Envelopment Analysis, DEA). Although there are several conceptual and practical differences between SFA and DEA analysis; the basic difference is the number of outputs being restricted to one in SFA. On the other hand, SFA allows for the calculation of errors and necessitates to find the functional form of the data. Despite the fact that SFA is the most widely used method in the healthcare sector, in recent years, there has been an increase in the use DEA together with parametric methods such as regression analysis [11]. The main reason of this is that DEA can handle effectively mul-tiple outputs in the transformation process. Moreover, DEA does not require knowledge of the functional form that links inputs to outputs, allows identification of efficiency targets for performance improvement of inefficient Decision Making Units (DMUs) and provides more de-tailed feedback on areas of inefficiency. The main idea behind DEA is to provide a methodology whereby, within a set of comparable DMUs, those exhibiting best practice can be identified, and will form an effi-cient frontier. In a given instance with n DMUs, where each DMU uses varying amounts of m different inputs to produce s different outputs, the relative efficiency of a DMU is computed as the ratio of its total weighted output to its total weighted input. DEA evaluates the relative efficiency of one DMU at a time over all other DMUs by determining the most favorable weights from the viewpoint of that, “target”, DMU. In DEA models there are two possible orientations to efficiency analysis: (1) input-oriented, where one targets to minimize the input used to produce given output levels for each DMU and (2) output-oriented,
where one targets to produce the highest possible output levels for a given input usage for each DMU. Furthermore, another differentiator of DEA models is whether they assume constant returns to scale (CRS) or variable returns to scale (VRS). The most well-known version of the CRS models is so-called CCR [12] model, and the most well-known version of the VRS models is the BCC [13] model.
In this study, DEA is selected over alternative techniques not only because DEA is used more widely, but also DEA is more appropriate for the analysis of efficiency in the health industry since the DEA frame-work provides an analytical tool for the determination of effective and ineffective performance of DMUs producing several types of services (outputs) using several inputs [14–20]. DEA provides the distances between non-efficient units and the use of frontier based on efficient units permits the assessment of a productive efficiency using multiple inputs and outputs, when production factors operate with both variable returns to scale (VRS) or constant returns to scale (CRS) [11,15].
Earlier studies that have used DEA for efficiency assessment in healthcare do not generally focus on EDs. To the best of our knowledge, quantitative efficiency analysis research done on the emergency units of hospitals is very scarce [21]. This is despite the fact that in both some developed economies such as the U.S. [22] and developing economies such as Turkey (see Fig. 1) the number of patients applying to the emergency departments (EDs) has been increasing. Kang et al. [21] analyze the data of 976 EDs in the US. They use a two-stage DEA ap-proach to look into both scale efficiency and technical efficiency and use a multivariate logistic regression model to identify exogenous fac-tors affecting the technical efficiency of EDs. Their model uses three input (number of beds, physician and nurse working hours per day) and three output (number of patient visits per day, reciprocal of the rate of left before treatment complete, and the number of EKG procedures per 100 patients) variables. They use the classical CCR and BCC models. They identify which exogenous variables (such as type, location, trauma level) have an impact on efficiency.
Most of the DEA-based research conducted so far focus on the overall hospital efficiency and there are only a few studies which concentrate on a specific department (e.g. Ref. [23] – primary care units [24]; – trauma facilities [25]; – gynecology departments). Another common feature of the existing studies is that they use yearly data for the analysis. However, there can be some seasonal effects on the effi-ciencies of the hospitals/departments.
In Turkey, research on the use of DEA to analyze the efficiency of hospitals is limited. Ersoy et al. [26] performs an efficiency analysis of 573 state hospitals, based on 1994 data, and using input-oriented DEA. Sahin & Ozcan [14] compares the efficiency of hospitals operating in different cities and analyze the reasons behind the inefficiency issues. Temür & Bakırcı [27] analyze and compare the performance of 846 public hospitals in 81 cities for the 2003–2006 period. Cakmak et al. [25] investigate the efficiency of 43 gynecology departments of Turkish hospitals using DEA. Bayraktutan et al. [28] use the same method to analyze the efficiency of 21 chest diseases hospitals. Sahin et al. [29] analyzes the efficiency of 352 public hospitals for the 2005–2008 period using fixed and variable return to scale DEA. Ozgen & Sahin [30] uses cross-sectional data from the 2008 Turkish Statistical Yearbook of Dialysis to analyze the efficiency of the dialysis sector in Turkey using DEA. Bilsel & Davutyan [31] tests the operational efficiencies of 202 hospitals in Turkey using DEA with “directional distance” approach to identify improvement in both input and outputs.
This study differs from the existing studies in two ways. Firstly, it focuses on a specific department. Secondly, it conducts the analysis seasonally. Furthermore, in terms of methodology, we have utilized a regression-based residual analysis to identify statistically significant deviations in different DEA models' ranking of DMUs. With this ap-proach, we were able to identify the importance of including the re-ferrals (from one ED to another hospital's ED) as an output variable.
Since the DEA analysis allows multiple outputs as well as multiple inputs, we have reviewed the literature on DEA modeling done for
hospitals between 1984 and 2016, to see the input and output variables commonly used. We grouped the variables into general variable cate-gories; this taxonomy reveals the complexity and the importance of efficiency measurement in health services. We limited our attention to those with at most eight input/output variables, as this would be a more relevant benchmark for our study in emergency units with limited data availability. In this taxonomy study of DEA-based hospital technical efficiency studies, we used the input/output categories proposed by O'Neill et al. [32]. We used O'Neill et al. [32] since it is the most comprehensive review which categorizes the input/output variables used in DEA models for evaluating the efficiency of hospitals. The most recent review of efficiency measurement in healthcare [109], only re-views the methodologies used and does not show which study uses which variables (input-output) in detail. We based our review on O'Neill et al.'s [32] study to define more aggregate categories and complemented this study by adding publications done between 2004 and 2016, adding quality measures as a new category and pooling all other unaccounted variables into the others category, resulting in 9 input and 10 output categories (it should be noted that we will not consider quality as a category in this study, as DEA considers in prin-ciple the incorporation of physical measures to evaluate the economic perspective). In Web of Science database, we searched for articles published between 2004 and 2016 (the years between 1984 and 2004 were earlier analyzed by O'Neill et al. [32] using the keywords “hos-pital, healthcare, efficiency, DEA”. Moreover, we limited our attention to those with at most eight input/output variables, as this would be a more relevant benchmark for our study in emergency units with limited data availability. For the surveyed articles,Table 2provides summary statistics on the number of the input/output variable categories used per DEA model. Based on these statistics, one could argue that having 3 input and 3 output variables is quite typical for hospital DEA analysis. Table 3provides the number and percentage of the reviewed articles (out of a total of 71 articles) that use a specific input/output variable category in their DEA model (seeAppendix 1-A and 1-Bfor a complete list with a detailed breakdown of categories used in the model of each article). This table shows that most common input variable category used for hospitals is the number of beds, and the second group of cate-gories is the number of staff (physicians, nurses, clinical and non-clinical
staff). Number of beds is commonly accepted as a very strong indicator of
hospital size and the number of the staff represents the medical labor capacity of the hospital. The third group of variable categories includes the cost-based variables. The most common output variable category used for hospitals is the number of medical visits. The other variables frequently used are about the number of patients served (inpatient days, discharges, surgeries for inpatients; number of visits, emergency services etc. for outpatients). The outputs used in this study are total
number of emergency patients and total number of referrals from the ED;
which is consistent with the literature. On the other hand, the inputs used in the study are the number of beds in the ED and MoH level classification of the EDs. As discussed in the following sections in more detail, level classification is a good proxy measure for capacity and capabilities of ED. From this perspective, the number and the nature of input and output variables we have used are consistent with the lit-erature review, especially considering that we are considering only one hospital unit; namely ED. The total number of referrals from the ED comes
from the field study conducted in Istanbul. The input variables chosen for the study will be presented in the next session along with the rea-sons for their choices.
3. Methodology
Our research was carried out for the hospitals of Beyoglu State Hospitals Association (BSHA) in Istanbul. The flowchart summarizing the main steps of our research process is depicted inFig. 2.
Due to the nature of the analysis unit, seasonality characteristic of the study and the requirements of DEA, it was necessary to determine the most critical input and output variables which are relevant across all the hospitals in the study and for which the related data can easily be collected without any missing value. Because of the limited number of hospitals, a field research including a few stages was planned as the early stage of the research process. First, an extensive literature survey that mostly focuses on empirical studies on the effectiveness of hospi-tals in general, and EDs in particular, was carried out to accomplish the objective cited above. A list of fifty indicators of the efficiency that are relevant in the health industry was derived from the literature. Because of the inadequate number of studies on the efficiency of EDs in the literature as well as the need for discovering the most crucial and country-specific indicators, an in-depth interview with the Head of Business Development Unit of BSHA was also conducted. This in-depth interview indicated that the recent report of the study on the issue of efficiency prepared for the Ministry of Health and related institutions including BSHA consist of six main categories of efficiency indicators. These are medical; administrative; financial; quality, satisfaction,
Table 2
Summary statistics on the number of input/output variable categories in DEA models.
# Input Var. Cat. # Output Var. Cat. Tot. # Var. Cat.
Average 3.48 2.86 6.34
Median 3 3 6
Min 1 1 4
Max 6 6 9
Table 3
Usage frequency of main hospital variables in DEA models. Input Variables Nbr (%) of
articles Output Variables Nbr (%) ofarticles No. beds 61 (86%) No. medical visits 55 (77%) No. physicians 39 (55%) No. cases 3 (4%) No. nurses 27 (38%) No. patients 16 (23%) No. clinical staff 29 (41%) No. surgeries 25 (35%) No. non-clinical staff 24 (34%) No. inpatient days 31 (44%) Capital invest. & op. exp. 30 (42%) No. admissions 6 (8%) Labor costs 5 (7%) No. discharges 22 (31%) Supply & non-labor costs 10 (14%) No. services 12 (17%)
Other 16 (23%) Quality measures 3 (4%)
Other 15 (21%)
personnel, and patient security; training and finally evaluation of ob-servers. The in-depth interview which lasted almost two hours put forward that each of these dimensions of effectiveness includes at least several indicators and almost 40 input variables in total can be con-sidered in the effectiveness of ED in a health system similar to Turkey. This in-depth interview was also an opportunity to get information from one of the experienced industry experts about the perceived importance of those indicators.
Due to the diversions of the dimensions and both the type and number of indicators considered to measure efficiency in the industry from the literature, a focus group discussion with nine administrators of BSHA for two and a half hours was carried out in order to reach a consensus. A list of 60 indicators as variables by combining both those in the literature and those discussed in the in-depth interview was evaluated in this process. Five categories which are mostly used in the literature were given as the framework to the participants. During the focus group discussion, experts' opinions were inquired regarding the appropriateness of using these indicators in the context of emergency units, and the availability and reliability of the data related to these indicators. We also asked the experts about the relevance and im-portance of using the variables as inputs/outputs in the context of measurement of efficiency. Furthermore, the focus group session also gave an opportunity to discuss and reallocate the indicators in the more meaningful dimensions or categories.
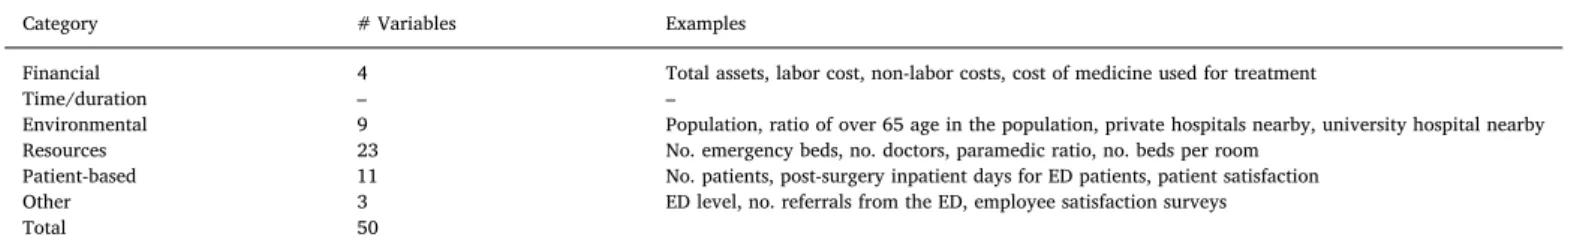
Table 4 indicates five categories and number of appropriate in-dicators allocated to each category. It is interesting to note that al-though the category of time/duration is relevant in the literature, it was not found significant and valid in the focus group. On the other hand, almost all the members agreed that resources, patient-based category and “other” category of indicators are perceived as the most crucial categories of efficiency measurement of ED.
As a summary, the result of the focus group discussion, 50 of total 60 indicators were found meaningful and significant to take into con-sideration for efficiency measurement of ED. However, these 50 in-dicators differ from each other in terms of their importance in the role of measurement of the efficiency of ED.
After the two-stage comprehensive qualitative field research, we identified four variables which are the most critical and related data available that could be used to evaluate efficiency of the EDs. These were ED level certified by the Ministry of Health (MoH), total number of beds in the ED, the total number of emergency patients, and the total number of referrals from the ED. Among these, the level of EDs is probably the most important variable because, as discussed in the next section, its use affected the type of DEA model used and distinguished our model from most of the other models in the literature. Turkish MoH categorizes the EDs of hospitals depending on their medical compe-tencies and capabilities, and the infrastructural characteristics [33]. Level 1 EDs are those that satisfy the minimum requirements. To be a Level 2 ED, a department would need to have special medical imaging facilities, decontamination rooms, etc. To be further classified as a Level 3, a department would have to have an emergency lab dedicated to the ED, a special trauma room, etc. There are also requirements on the number of medical personnel (doctors and nurses) assigned to the de-partments, medical services available to the ED (e.g. surgeons available
24 h of the day within the hospital), security services in the EDs, characteristics of the resuscitation room, the medicines/drugs to be available at the department. In addition, there are physical character-istics that determine the level of a department. Among these, we have the location/accessibility characteristics, the size of the medical/treat-ment areas (in square meters), and the number of beds. Children's emergency (pediatric EDs/departments) are also evaluated and as-signed a level. These level assignments are done by a commission which does a site visit. In total there are 43 items under the physical char-acteristics heading, 39 items under the personnel and services heading, 16 sub-categories in the medical equipment and hardware heading, 15 sub-categories under the resuscitation room heading, and 30 sub-cate-gories under the medicines/drugs heading. Thus, ED level is strongly related to the number of staff and costs (including capital ex-penditures). For example; for level 1; the size of the medical/treatment area should be at most 400 m2, whereas for level 3 this is at least
800 m2. Similarly, to be a level 3 ED, the unit must have a dedicated
intensive care unit; and the number of physicians should be at most 2 for a level 1 unit while at least 4 for a level 3 unit.
One of the challenges of empirical research in healthcare services is access to sufficient and reliable data. In the context of Turkish state hospitals, hierarchical classification of the EDs is both very reliable and strongly related to some key characteristics of these units that define their capabilities and capacities. Similar hierarchical classification systems exist in other healthcare systems as well. Therefore, the mod-eling approach developed here could prove to be beneficial in such systems, too.
As discussed in Section2, for hospital efficiency analysis the most common input categories are number of beds, number staff, and costs (including capital expenditures). This is consistent with the variables used in our model, namely number of beds and ED level, since ED level is strongly related to the number of staff and costs (including capital ex-penditures).
4. Proposed categorical DEA framework
As discussed in the previous section with our field research it be-came evident that the level of the ED was a reliable and comprehensive indicator of the capacity and capability of the EDs. The ED level was mapped to the values of the categorical variable as follows: the cate-gorical variable was set to 1 and 2 for ED Level 1 and Level 2, re-spectively. When ED Level is 3, the categorical variable was set to 3 if the ED had a Level 2 pediatric emergency and it was set to 4 when it had a Level 3 pediatric emergency. The number of beds in each ED showed significant variation among hospitals with the same level, and thus it was decided to include that as an input as well.
When some of the variables are categorical, Categorical DEA models [34] are used. In this context, DMUs are divided into sub-groups based on the categorical variables. If there are L (1, 2, …, L) levels of a ca-tegorical input variable, these L values divide the DMUs into subgroups such that D={1,2, , }n =D1 D2 DL where
=
Dk { |i i D and input value is k} and Dk Dj= for j k. Each
DMU in category k is evaluated based on the envelopment surface which is defined by the DMUs that are in categories1, ,k([34,35]). Table 4
Efficiency indicators discussed in the focus group process.
Category # Variables Examples
Financial 4 Total assets, labor cost, non-labor costs, cost of medicine used for treatment
Time/duration – –
Environmental 9 Population, ratio of over 65 age in the population, private hospitals nearby, university hospital nearby Resources 23 No. emergency beds, no. doctors, paramedic ratio, no. beds per room
Patient-based 11 No. patients, post-surgery inpatient days for ED patients, patient satisfaction Other 3 ED level, no. referrals from the ED, employee satisfaction surveys
Level designations provided by the Ministry of Health makes the categorical DEA models an appropriate approach to measuring effi-ciencies of the EDs. [34], in their development of categorical DEA models, propose that “when some factors in an efficiency analysis are 0–1 variables, we have to use a method for insuring that the composite reference members be constructed from DMUs which are in the same category or possibly from those in a category which is deemed to be operating in an even more difficult or unfavorable situation”. In this regard, we employ four different categorical DEA models as listed below [35]:
•
Input Oriented CCR Model with Categorical Variables (CAT-I-C)•
Output Oriented CCR Model with Categorical Variables (CAT-O-C)•
Input Oriented BCC Model with Categorical Variables (CAT-I-V)•
Output Oriented BCC Model with Categorical Variables (CAT-O-V) Two variables were tested as outputs: (1) the total number of pa-tients served, and (2) the total number of referrals. Other than these inputs and outputs, we had three other potential inputs (number of doctors, number of interns/assistants, number of operating rooms in the ED) and one other output (number of operations done in the ED's op-erating rooms) in the short list, which we decided not to use. Upon our discussions with the administrators at BSHA, the number doctors in the hospital was not deemed to influence the chosen outputs. It could have been used as a measure of hospital size, but it was decided that ED level and the number of beds in the ED provided enough information re-garding the size of the hospital. On the other hand, the number of operations in the EDs was often equal to 0, thus we decided not to use this variable (both because of the positivity assumption of DEAs and was judged to be a small fraction of the workload that the EDs faced). BSHA provided us monthly data and we aggregated this into sea-sonal data and treat each ED for each season as a single DMU (seasons were defined as four tri-monthly periods, starting with December, March, June, and September). There were two reasons for making this choice. First, we wanted to see whether there was any seasonal pattern in efficiency. Second, since the scope of the study was limited to seven hospitals, using seasonal data allowed us to have a sufficiently large number of DMUs to have a reliable DEA analysis. It is well known that for ensuring good discriminatory power out of the CCR and BCC models, there must be a minimum number of DMUs [36] establish a rule that the number of units should be at least twice the number of inputs and outputs considered).To find the most appropriate input-output set, two different variable sets, VARSET 1 and VARSET 2 were used (seeTable 5). Generally, CRS model is widely used for performance analysis in the healthcare field [36]. However [37], states that efficiencies of DMUs could be evaluated both using CRS and VRS assumptions. Therefore, both CRS and VRS assumptions are tested in this study. These models were solved using DEA-SOLVER-V8 to obtain the results discussed next in Section5. 5. Analysis of the results
5.1. Multi-dimensional analysis
One of the crucial points in DEA studies is to select the appropriate input-output combination. For this purpose, we first used two
methodologies, namely ALSCAL and Principal Component Analysis (PCA) (see Refs. [38,39]). Scaling models measure the proximity be-tween pairs of objects. Proximities are calculated bebe-tween models in our study in order to cluster a variety of DEA specifications. Similarly, PCA reduces the dimensions of the data used. Both ALSCAL and PCA permit the joint graphical representation of models and DMUs [39].
We clustered 8 different DEA models (generated by using different input-output combinations and different DEA methodology assump-tions as given inTable 6) and 28 DMUs, using ALSCAL and PCA. Since we have 28 × 8 efficiency scores, clustering was done to help us to differentiate the models; and hence the input/output combinations and DMUs. The aim of using both methods was to clarify the relationship between models and DMUs. To identify the most appropriate model, we used the efficiency scores of various DEA models (see Appendix 2), which are denoted by acronyms defined inTable 7using the notation (codes) defined inTable 6.
5.1.1. ALSCAL
ALSCAL is a Multidimensional Scaling (MDS) technique. ALSCAL is a flexible technique which can produce metric and nonmetric scaling with or without individual differences models. After analyzing the data given inAppendix IIwe got a stress measure of 0.00458 (very good fit) and an R-square of 0.999 (illustrating that 99.9% of variance in the model is explained by the two dimensions). S-stress is a measure of fit ranging from 1 (worst possible fit) to 0 (perfect fit). This fit shows that we can group the variables into two dimensions. The stimulant co-ordinates inTable 7is the weights each model has in each dimension. There are two dimensions that pull apart these variables. For example, AB12VO is strong on dimension 1 while the strongest models on di-mension 2 (AB1CI and AB1CO) do not take very high values.
As can be seen inFig. 3CRS models are on the right side of the y-coordinate and VRS models are on the left side. This result shows that ALSCAL model differentiates eight DEA models based on whether they use constant or variable returns to scale. Furthermore, AB12VO seems to be very much alone and AB1CI and AB1CO are clumping models. AB12CI and AB12CO are also clumping. This result reveals that for CRS, input and output-oriented models do not discriminate. The basic
Table 5
Data models tested.
Variables VARSET 1 VARSET 2
ED Level Category Input Input
Total number of emergency patients Output Output Total number of beds in the ED Input Input Total number of referrals from the ED N/A Output
Table 6
Notation for model characteristics.
Description Code
Input Variables
Level of ED (X1) ED Level Category A
Number of beds (X2) Total number of beds in the ED B Output Variables
Number of patients (Y1) Total number of emergency patients 1 Number of Referrals (Y2) Total number of referrals from the ED 2 Models
CRS Constant Returns to Scale C
VRS Variable Returns to Scale V
Input Oriented Input Oriented DEA Model I Output Oriented Output Oriented DEA Model O
Table 7
Stimulus Coordinates (ALSCAL results). Stimulus Number Dimension
Stimulus Name 1 2 1 AB1CI 1,5502 -,3689 2 AB1CO 1,5502 -,3689 3 AB1VI -,9692 -,3186 4 AB1VO −1,5540 -,0948 5 AB12CI 1,1452 ,5035 6 AB12CO 1,1452 ,5035 7 AB12VI −1,1503 -,0769 8 AB12VO −1,7172 ,2211
differentiation is obtained through the returns to scale assumption.
5.2. Principal component analysis
Principal Component Analysis (PCA) is a data reduction technique [40], which reduces the dimensions of the data used. As in ALSCAL, PCA permits the joint graphical representation of models and DMUs [39].
Table 8shows the component loadings which have been derived by using Varimax with Kaiser Normalization [41]. The results reveal that eight models have positive loadings in both principal components. Two components explain the variance of the data since the cumulative loading of the first two components has cumulative variance of 94.99%. Therefore, the first two components provide an adequate representation for the data. The first principal component is related to constant returns to scale assumption of DEA model, while the second principal compo-nent is related to variable returns to scale assumption. This is consistent with the main finding from the ALSCAL model.
For each DMU, component scores for the first and second principal components have been calculated and plotted in a graph (seeFig. 4). The DMUs that achieve efficiency scores close to 100% are to be found at the extreme right-hand-side of the first principal component and these high-efficiency scores are obtained by CRS models. These DMUs are SERTH (spring) and SASH (all seasons). At the other extreme of the second principal component, we find DMU SERTH (summer, fall, and winter) which have very low-efficiency scores and they are obtained by VRS models. Looking into the results inAppendix II, we see that these DMUs achieve low efficiencies under all models.
The results of both ALSCAL and PCA analysis reveal that the dominant factor that discriminates the various DEA models in this study
is the assumption of constant or variable returns to scale.
5.3. Analysis of appropriate input-output configuration
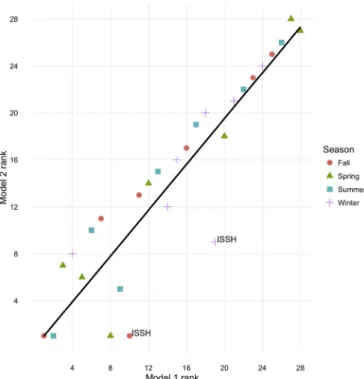
To identify the most appropriate variables, we used the rankings of the efficiency scores rather than the efficiency scores since these rankings are less sensitive to small deviations in the data and the hos-pital association administrators were more interested in the relative ranking of the hospitals. We compared the rankings of the efficiency scores of the DMUs obtained by VARSAT 1 (along x-axis, denoted as Model 1) versus by VARSAT 2 (along y-axis, denoted as Model 2) using a scatter plot, where each marker corresponds to a DMU and color coding is used to distinguish DMUs corresponding to different seasons (Fig. 5throughFig. 10).
5.3.1. CRS model results
Figs. 5and6present the rankings for both CAT-O-C and CAT-I-C models for 2014 and 2013, respectively, since these two models yielded the same efficiency scores.Fig. 5shows that VARSET 1 and VARSET 2 provide, for the most part, a consistent ranking of the hospitals in 2014. Only ISSH shows inconsistent results in VARSET 1 and 2 ((23,10) for fall and (17,8) for summer), being significantly more efficient in VARSET 2. Studentized residual analysis for regression models was used to identify statistically significant outliers. It is generally accepted that if the absolute value of the studentized residual is close to or greater than 3, the corresponding data point is an outlier. For instance, in CAT-I-C and CAT-O-C 2014 the studentized residual values were −2.99 for fall season and −2.1 for summer season of ISSH. The main character-istic of ISSH is that it is relatively small “neighborhood” hospital with level 2 ED; hence it must make a lot of referrals. These two DMUs (ISSH fall and summer) become fully efficient with VARSET 2, because VARSET 2 takes referrals as an output.
Fig. 6shows that for 2013, VARSET 1 and VARSET 2 provide con-sistent rankings, as they did for 2014 data. ISSH is again significantly more efficient in VARSET 2 compared to VARSET 1 in two of the four seasons (points (19,9) and point (10,1) with studentized residual values equal to −2.71 and −2.57, respectively). We should also note that the effect of using VARSET 2 on the ranking of ISSH is consistent in both years.
5.3.2. VRS model results
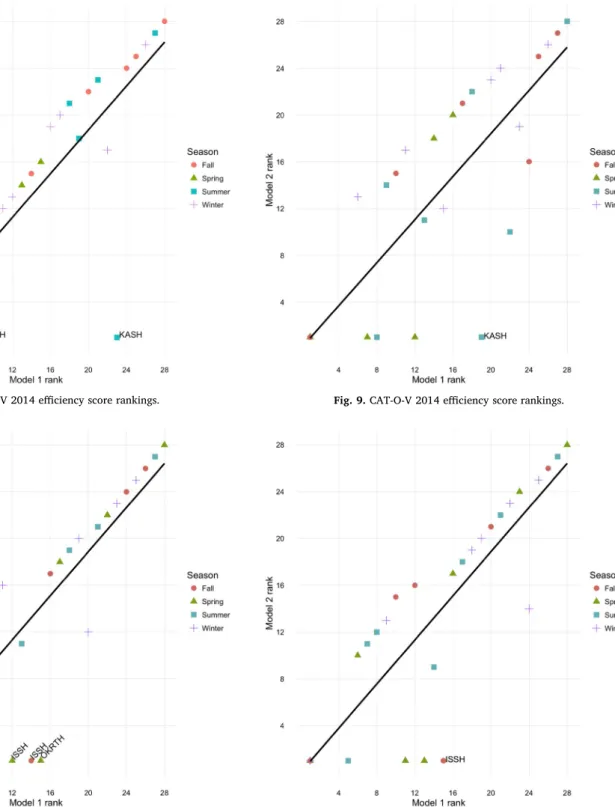
As was the case for the CRS models,Fig. 7shows that CAT-I-V model for 2014 provides consistent rankings of the hospitals for VARSET 1 and VARSET 2 with two outliers (points (9,1) and (23,1)). The studentized residual value for KASH is −4.28; since this is a strong outlier, after omitting this data point and running the studentized residual analysis again the studentized residual for ISSH-Spring is found to be −2.75. KASH, like ISSH, is a “neighborhood” hospital.
For 2013 we see a very similar picture inFig. 8. VARSET 1 and VARSET 2 provide a consistent ranking of the hospitals with a few outliers. Okmeydanı RTH (OKRTH) became fully efficient in 2013 spring (point (15,1)) and ISSH became fully efficient in fall (point (14,1)) and spring (point (12,1)) when we use VARSET 2. The stu-dentized residual values for OKRTH-spring, ISSH-fall, and ISSH-spring are −2.63, −2.45, −2.08, respectively. OKRTH case is due to the Gezi Park protests in late May 2013, which lead to violent clashes between the police and the protesters in Okmeydanı neighborhood and OKRTH was flooded with wounded people some of whom had to be referred to other hospitals. We see that VRS model CAT-I-V captured the effect of Gezi Park protests, whereas, CRS models did not. Considering the im-portance and magnitude of Gezi Park protests, we can conclude that VRS model could be more appropriate for evaluating the relative effi-ciency of the EDs of the hospitals of BSHA.
Like the other DEA models, Fig. 9 shows that CAT-O-V models provide consistent rankings of the hospitals for 2014. The outlier (19,1) corresponds to KASH, becoming fully efficient with VARSET 2 Fig. 3. ALSCAL-common map.
Table 8 Component loadings. Component 1 2 AB1CI 0,924 0292 AB1CO 0,924 0292 AB12CI 0,92 0,3 AB12CO 0,92 0,3 AB1VI 0,393 0896 AB12VI 0,365 0913 AB12VO 0,26 0,936 AB1VO 0,224 0965
(studentized residual is −2.82). 2013 data (Fig. 10) provides a similar picture to that of 2014 with the exception that ISSH in fall appears as a significant outlier, becoming fully efficient in VARSET 2 whereas it ranked 15th in VARSET 1 (Studentized Residual = −2.64).
Fig. 5throughFig. 10show that seasons do not have a strong effect on efficiency rankings as high and low rankings are more or less evenly distributed across seasons for all models in both years. Considering the model results and interpretations above, we decided to test the null hypothesis which claims that the VARSET 1 and VARSET 2 efficiency scores for the small neighborhood or “satellite” hospitals are equal. The reason we develop this hypothesis is that ISSH and KASH usually be-come fully efficient in VARSET 2. The p-values for the two-tailed t-test for the differences of VARSET 1 and 2 for CAT-I-V, CAT-O-V, CAT-I-C, CAT-O-C (using the efficiency scores of all four seasons for both years)
were found to be 0.00827, 0.004911, 0.00194, 0.00194 respectively. The results show that the efficiency scores in VARSET 1 and 2 are significantly different for ISSH and KASH. This means that for satellite hospitals such as ISSH and KASH, the number of referrals makes an important impact on efficiency scores.
6. Conclusions and further suggestions
In this research, we developed a methodology to test the appro-priateness of a set of DEA models to measure the efficiency of some of the busiest emergency departments in Istanbul. Our methodology, built on a set of easy to interpret graphical analysis and multivariate statis-tical techniques, helped us determine the most appropriate set of inputs and DEA model to analyze the efficiency of these EDs. These techniques Fig. 4. Component scores for the first and second principal components.
showed that VRS/CRS distinction was the most significant determinant of the performance differences in the DEA models tested. In fact; VRS models have been suggested by previous studies on hospital efficiency (Dash et al. [42]; Mark et al. [43]; Ozcan et al. [44]; Ketabi [45]; Gautam et al. [46]; Prakash and Annapoorni [47] and our results show that VRS models would be better for EDs as well. On the other hand, to determine whether using only a single output (number of emergency patients) or two outputs (number of emergency patients and number of referrals) made a significant difference in the efficiency rankings of the hospitals, we employed a novel approach utilizing outlier detection with regression.
The results revealed that for two hospitals (KASH and ISSH) in-cluding the referral count is necessary to accurately evaluate their ef-ficiencies. Evaluating their efficiency without taking this into account would not be a fair and accurate assessment of their performance. This conclusion provided by our models is validated by the field work which revealed that these hospitals serve a “satellite hospital” mission by re-ferring some of the emergency cases to better-equipped training and research hospitals. We believe, for densely populated cities such as Istanbul, this outcome points to an effective policy of designing EDs in a hub-and-spoke system, where smaller and less-equipped EDs are sup-ported by larger and better-equipped hospitals (“hubs”). In this two-Fig. 7. CAT-I-V 2014 efficiency score rankings.
Fig. 8. CAT-I-V 2013 efficiency score rankings.
Fig. 9. CAT-O-V 2014 efficiency score rankings.
tiered emergency care system design, the lower-tiered units that have limited capabilities and capacities would serve a more local population within the city and higher-tier units that have extensive capabilities would serve a wider region, making it a cost-effective approach. If such a system is further supported by an integrated information system, it could prove both highly effective and economically viable.
In terms of the developed methodology, we believe its visual aspect is likely to increase the chance of the hospital administrators to accept the approach and the recommended model. Another advantage of the proposed model is that due to the use of categorical DEA and the level categories of the EDs (which is reliable and trusted by the adminis-trators) reduces the input requirements. Our model can be seen as a proof-of-concept application of categorical DEA models as a practical approach, especially when there is a limited number of DMUs (in this case EDs). Since the categories are defined by the level designations of the MoH which encapsulates many critical characteristics of EDs, the category variable in the DEA models could be effectively used to replace a large number of input variables. We believe these characteristics of the methodology make it easily applicable to the emergency service units of other hospital regions.
The two main policy implications derived from this study can be summarized as follows. Firstly, hospital administrators should consider a hub and spoke system while developing EDs in metropolitan cities
(such as Istanbul). Secondly, we suggest hospital administrators to de-velop if they have not already done so, a level classification system for EDs, which encompass infrastructure and size characteristics of the EDs. Doing so, as shown here, will enable them to carry out efficiency ana-lysis even when there is a small number of EDs under their adminis-tration.
The fact that a small number of hospitals has been used in this re-search, could be seen as one of its main weaknesses. We would like to see researchers testing categorical DEA approaches on other EDs to our conclusions. For the group EDs we have studied there was no data on the case-mix (relative medical complexity of the health services deliv-ered). This could be an important element in modeling the output of EDs and thus another direction of improvement for the models studied here.
Acknowledgments
This work was supported by TÜBITAK 1001 under Grant 216M026. The authors would like to express their sincere gratitude to the Prof. Erol Kısmet and Asst. Prof. Güven Bektemür from Istanbul's Beyoglu State Hospitals Association, (BSHA), Prof. Cevdet Erdöl from Sağlık Bilimleri University and Dr. Nurgül Osmanbeyoğlu Bektemür from Ümraniye Training and Research Hospital.
Appendix 1-A. Summary of input and output categories
Study (citation number) [4] [5] [14] [15] [16] [24] [34] [37] [42] [44] [50] [22] [27] [28] [32] [33] [35] [50]
Inputs Nbr. of beds 1 1 1 1 1 1 1 1 1 1 1 1 1 1 1 1
Nbr. of physians 1 1 1 2 1 1 1 1
Nbr. of nurses 1 1 1 1
Nbr. of clinical staff 1 1 1 1 1 1 1
Nbr. of non-clinical staff 1 1 1 2 1
Cap. invest. & op. exp. 1 2 1 1 1 1 1 1
Labor costs 1 1 1 1 3
Supply & non-labor costs 1 1 1 1
Other 1 2 1
Outputs Nbr. of medical visits 1 1 1 1 1 1 1 1 1 1 1 1 1
Nbr. of cases Nbr. of patients 1 1 Nbr. of surgeries 1 1 1 1 1 Nbr. of inpatient days 3 1 1 1 3 1 2 3 2 2 1 1 3 Nbr. of admissions 1 Nbr. of discharges 1 1 1 1 1 1 1 Nbr. of services 1 Quality measures Other 1 1 1
Study (citation number) [54] [55] [57] [58] [59] [60] [61] [63] [65] [72] [75] [77] [78] [100] [101] [102] [103] [104]
Inputs Nbr. of beds 1 1 1 1 1 1 1 1 1 1 1 1 1 1
Nbr. of physians 1 1 1 2 1 1 1
Nbr. of nurses 1 1 2 2
Nbr. of clinical staff 1 1 1 1 1 1 1 1 1 1
Nbr. of non-clinical staff 1 2 1 1
Cap. invest. & op. exp. 1 1 1 1 1 1 1 1 1 1 1 1 1 1
Labor costs
Supply & non-labor costs 1
Other 1 2 1 1 1 1 1 1 1 1 1
Outputs Nbr. of medical visits 1 1 1 1 1 1 1 1 1 1 1 1 2 1 2
Nbr. of cases Nbr. of patients 2 Nbr. of surgeries 1 2 1 1 Nbr. of inpatient days 3 1 1 2 2 1 1 1 Nbr. of admissions 1 Nbr. of discharges 2 1 1 1 1 1 1 1 1 Nbr. of services 1 1 Quality measures Other 1 1 1 1 1 2 1 3
Study (citation number) [105] [106] [107] [108] [109] [110] [111] [112] [113] [114] [115] [116] [117] [118] [119] [120] [121] [122] Inputs Nbr. of beds 1 1 1 2 1 1 1 1 1 1 1 1 1 1 1 1 1 Nbr. of physians 1 1 1 1 2 1 1 1 1 1 1 Nbr. of nurses 1 1 3 1 1 1 1 Nbr. of clinical staff 1 1 1 1 1 1 1 Nbr. of non-clinical staff 1 1 1 1 1 1
Cap. invest. & op. exp. 1 1 1 1 1
Labor costs
Supply & non-labor costs 1 1 1
Other 1
Outputs Nbr. of medical visits 1 2 1 2 1 1 1 1 1 2 1 1 1 1 1
Nbr. of cases Nbr. of patients 1 1 1 1 1 1 1 1 Nbr. of surgeries 2 1 1 1 1 1 1 1 1 Nbr. of inpatient days 1 1 1 1 Nbr. of admissions 1 1 1 Nbr. of discharges 1 1 1 1 Nbr. of services 2 2 1 Quality measures 3 1 Other 1 1
Study (citation number) [123] [124] [125] [126] [127] [128] [129] [130] [131] [132] [133] [134] [135] [136] [137] [138] [139]
Inputs Nbr. of beds 1 1 1 1 1 1 1 1 1 1 1 1 1 1
Nbr. of physians 2 1 1 1 2 1 1 1 1 1 1 1 1
Nbr. of nurses 1 2 1 1 1 1 1 1 1 1 1 1
Nbr. of clinical staff 1 2 1 1 1
Nbr. of non-clinical staff 1 1 1 1 1 1 1 2 1
Cap. invest. & op. exp. 1 1 1
Labor costs
Supply & non-labor costs 1 2
Other 1
Outputs Nbr. of medical visits 1 2 1 1 1 1 1 1 1 1 1 1
Nbr. of cases 1 1 1 Nbr. of patients 1 1 1 1 1 Nbr. of surgeries 1 2 1 1 2 1 1 Nbr. of inpatient days 1 1 4 1 1 1 Nbr. of admissions 2 Nbr. of discharges 2 1 Nbr. of services 1 1 1 1 1 1 Quality measures 1 Other 2 1
Appendix 1-B. References for Appendix 1-A
Note: In order to facilitate easier comparison, the numbers next to each reference, up to and including 78 are the numbers the same as those used in Ref. [32].
[4] [48] [101] [49] [129] [50] [5] [51] [102] [52] [130] [53] [14] [54] [103] [55] [131] [56] [15] [57] [104] [58] [132] [59] [16] [60] [105] [61] [133] [62] [22] [26] [106] [63] [134] [47] [24] [64] [107] [65] [135] [66] [27] [67] [108] [43] [136] [68] [28] [69] [109] [70] [137] [71] [32] [72] [110] [73] [138] [19] [33] [74] [111] [75] [139] [76] [34] [77] [112] [78] [35] [79] [113] [80] [50] [81] [114] [82] [54] [83] [115] [84] [55] [85] [116] [86] [57] [87] [117] [88] [58] [89] [118] [29] [59] [90] [119] [91] [60] [92] [120] [93] [61] [94] [121] [95] [63] [96] [122] [97] [65] [98] [123] [99] [72] [100] [124] [101] [75] [102] [125] [103] [77] [104] [126] [105] [78] [106] [127] [17] [100] [107] [128] [108]
Appendix 2
A1. DEA Efficiencies for DMU under the 8 DEA Models-2014.
No DMU AB1CI AB1CO AB1VI AB1VO AB12CI AB12CO AB12VI AB12VO
1 ISSH (spring) 0.437 0.437 0.939 0.964 1.000 1.000 1.000 1.000 2 EYSH (spring) 0.392 0.392 1.000 1.000 0.447 0.447 1.000 1.000 3 GTRH (spring) 0.374 0.374 0.891 0.927 0.456 0.456 0.896 0.930 4 KASH (spring) 0.412 0.412 0.849 0.910 0.423 0.423 0.849 0.910 5 OKRTH (spring) 0.327 0.327 1.000 1.000 0.327 0.327 1.000 1.000 6 SASH (spring) 0.937 0.937 1.000 0.937 1.000 1.000 1.000 1.000 7 SERTH (spring) 1.000 1.000 1.000 1.000 1.000 1.000 1.000 1.000 8 ISSH (summer) 0.336 0.336 0.751 0.833 0.680 0.680 0.787 0.994 9 EYSH (summer) 0.314 0.314 0.756 0.889 0.354 0.354 0.756 0.889 10 GTRH (summer) 0.371 0.371 0.907 0.936 0.520 0.520 0.919 0.992 11 KASH (summer) 0.296 0.296 0.629 0.868 0.315 0.315 1.000 1.000 12 OKRTH (summer) 0.227 0.227 0.692 0.963 0.227 0.227 0.692 0.963 13 SASH (summer) 0.964 0.964 1.000 0.964 1.000 1.000 1.000 1.000 14 SERTH (summer) 0.169 0.169 0.176 0.376 0.169 0.169 0.176 0.376 15 ISSH (fall) 0.240 0.240 0.527 0.764 0.463 0.463 0.550 0.947 16 EYSH (fall) 0.302 0.302 0.732 0.899 0.334 0.334 0.732 0.899 17 GTRH (fall) 0.348 0.348 0.870 0.960 0.348 0.348 0.870 0.960 18 KASH (fall) 0.341 0.341 1.000 1.000 0.353 0.353 1.000 1.000 19 OKRTH (fall) 0.142 0.142 0.417 0.658 0.142 0.142 0.417 0.671 20 SASH (fall) 1.000 1.000 1.000 1.000 1.000 1.000 1.000 1.000 21 SERTH (fall) 0.110 0.110 0.112 0.385 0.110 0.110 0.112 0.403 22 ISSH (winter) 0.348 0.348 0.686 0.803 0.812 0.812 0.827 0.914 23 EYSH (winter) 0.360 0.360 0.904 0.968 0.399 0.399 0.904 0.968 24 GTRH (winter) 0.338 0.338 0.786 0.853 0.360 0.360 0.786 0.853 25 KASH (winter) 0.428 0.428 0.906 0.944 0.432 0.432 0.906 0.944 26 OKRTH (winter) 0.253 0.253 0.764 0.860 0.253 0.253 0.764 0.865 27 SASH (winter) 0.924 0.924 1.000 0.924 0.977 0.977 1.000 0.977 28 SERTH (winter) 0.199 0.199 0.206 0.436 0.218 0.218 0.223 0.515 References
[1] OECD. Health at a Glance 2017: OECD Indicators. Paris: OECD Publishing; 2017https://doi.org/10.1787/health_glance-2017-en.
[2] TOBB. A General Look at Turkey's Health Sector (in Turkish) (Sağlık Kurumları Meclisi: Türk Sağlık Sektörüne. 2017.
[3] World Bank. Tracking universal health coverage: 2017 global monitoring report (English). Washington, D.C.: World Bank Group; 2017.
[4] Berchet C. Emergency Care Services: Trends, Drivers and Interventions to Manage the Demand. Paris: OECD Publishing; 2015. OECD Health Working Papers, No. 83
https://doi.org/10.1787/5jrts344crns-en.
[5] World Bank. GDP rankings. 2017. Retrieved March 1, 2018, fromhttps:// datacatalog.worldbank.org/dataset/gdp-ranking.
[6] Buğra A, Yılmaz V, Birelma A, Gürsoy B, Taşkın Y, Dodurka ZB, Akkan BE, Göçmen İ. Inequalities in Turkey: An Overview. UNDP Regional Human Development; 2016.
[7] Torul O, Öztunalı O. On income and wealth inequality in Turkey. Central Bank Review; 2018.
[8] Akdag R. Turkey Health Transformation Program - Evaluation Report. 2011. p. 2003–10.
[9] Bektemür G, Osmanbeyoğlu N, Cander B. Acil Hizmetler Raporu. Eurasian J Emerg Med 2015;14. Retrieved fromhttp://www.eajem.com/sayilar/244/buyuk/ EAJEM-Ozel-Sayi.pdf.
[10] Hürriyet. Acilleri “acil” olmayanlar meşgul ediyor... Trabzon’da acile günde 3 binden fazla kişi gidiyor. 2018. Retrieved March 1, 2018, fromhttp://www. hurriyet.com.tr/acilleri-acil-olmayanlar-mesgul-ediyor-trabzonda-acile-gunde-3-binden-fazla-kisi-gidiyor-40724663.
[11] Hollingsworth B. The measurement of efficiency and productivity of health care delivery. Health Econ 2008;17:1107–28https://doi.org/10.1002/hec. [12] Charnes A, Cooper WW, Rhodes E. Measuring the efficiency of decision making
units. Eur J Oper Res 1978;2(6):429–44https://doi.org/10.1016/0377-2217(78) 90138-8.
[13] Banker RD, Charnes A, Cooper WW. Some models for estimating technical and scale inefficiencies in data envelopment analysis. Manag Sci 1984;30(9):1078–92. [14] Sahin I, Ozcan YA. Public sector hospital efficiency for provincial markets in
Turkey. J Med Syst 2000;24(6):307–20https://doi.org/10.1023/ A:1005576009257.
[15] Campos MS, Fern-andez-Montez A, Gavilan JM, Velasco F. Public resource usage in health systems: a data envelopment analysis of the efficiency of health systems of autonomous communities in Spain. Publ Health 2016;138:33–40.
[16] Hadad S, Hadad Y, Simon-Tuval. Determinants of healthcare system's efficiency in OECD countries. Eur J Health Econ 2013;14:253 https://doi.org/10.1007/s10198-011-0366-3.
[17] Mitropoulos P, Mitropoulos I, Sissouras A. Managing for efficiency in health care: The case of Greek public hospitals. Eur J Health Econ 2013;14(6):929–38https:// doi.org/10.1007/s10198-012-0437-0.
[18] Oikonomou N, Tountas Y, Mariolis A, Souliotis K. Measuring the efficiency of the Greek rural primary health care using a restricted DEA model; the case of southern and western Greece. Health Care Manag Sci 2016;19:313–25.
[19] Chowdhury H, Zelenyuk V. Performance of hospital services in Ontario: DEA with truncated regression approach. Omega 2016;63:111–22https://doi.org/10.1016/j. omega.2015.10.007.
[20] Mousa W, Aldehayyat JS. Regional efficiency of healthcare services in Saudi Arabia. Middle East Dev J 2018;10(1):152–74.https://doi.org/10.1080/ 17938120.2018.1443607.
[21] Kang H, Nembhard H, DeFlitch C, Pasupathy K. Assessment of emergency de-partment efficiency using data envelopment analysis. IISE Trans Healthc Systems Eng 2017;7(4):236–46.
[22] Kellerman AL. Crisis in the Emergency Department. N Engl J Med 2006;355:1300–3.
[23] Cordero JM, Alonso-Morán E, Nuño-Solinis R, Orueta JF, Arce RS. Efficiency as-sessment of primary care providers: A conditional nonparametric approach. Eur J Oper Res 2015;240(1):235–44https://doi.org/10.1016/j.ejor.2014.06.040. [24] Helton JR, Langabeer JR. Longitudinal changes in the operating efficiency of
public safety-net hospitals. J Healthc Manag 2012;57(3):214–26.
[25] Cakmak M, Öktem MK, Ömürgönülsen U. The Efficiency Problem of Turkish Public Hospitals: The Measurement of Technical Efficiency of Maternity Hospitals by Data Envelopment Analysis. Hacet J Health Adm 2009;12(1):1–36.
[26] Ersoy K, Kavuncubasi S, Ozcan YA, Harris JM. Technical efficiencies of Turkish hospitals: DEA approach. J Med Syst 1997;21(2):67–74https://doi.org/10.1023/ A:1022801222540.
[27] Temür Y, Bakırcı F. An analysis of the health organization in Turkey: A DEA ap-plication. Sos Bilimler Derg 2008;10(3):261–81.
[28] Bayraktutan Y, Arslan I, Bal V. The evaluation of the effects of health ınformation systems to the performance of hospitals by data enveloping analysis: An applica-tion in the thoracic medicine hospitals. Gaziantep Med J 2010;16(3):13–8. [29] Sahin I, Ozcan YA, Ozgen H. Assessment of hospital efficiency under health
transformation program in Turkey. Cent Eur J Oper Res 2011;19:19–37https:// doi.org/10.1007/s10100-009-0121-3.
[30] Ozgen H, Sahin I. Measurement of efficiency of the dialysis sector in Turkey using data envelopment analysis. Health Policy 2010;95(2–3):185–93https://doi.org/
10.1016/j.healthpol.2009.11.020.
[31] Bilsel M, Davutyan N. Hospital efficiency with risk adjusted mortality as un-desirable output: the Turkish case. Ann Oper Res 2014;221(1):73–88https://doi. org/10.1007/s10479-011-0951-y.
[32] O'Neill L, Rauner M, Heidenberger K, Kraus M. A cross-national comparison and taxonomy of DEA-based hospital efficiency studies. Soc Econ Plann Sci 2008;42(3):158–89https://doi.org/10.1016/j.seps.2007.03.001. [33] Offical Gazette of Turkish Republic, No: 27378, 2009.
[34] Banker RD, Morey RC. Efficiency analysis for exogenously fixed inputs and out-puts. Oper Res 1986;34(4):513–21https://doi.org/10.1287/opre.34.4.513. [35] Tasköprü V. Comparative Analysis of classical data envelopment analysis and
ca-tegorical data envelopment analysis models for energy efficiency. Mimar Sinan Fine Arts University; 2014.
[36] Golany B, Roll Y. An application procedure for DEA. Omega 1989;17(3):237–50. [37] Cooper WW, Seiford LM, Tone K. Data Envelopment Analysis: A Comprehensive
Text with Models, Applications, References and DEA-Solver Software. second ed. Boston, MA: Springer Science+Business Media, LLC; 2007.
[38] Cinca CS, Molinero CM. Selecting DEA specifications and ranking units via PCA. J Oper Res Soc 2004;55(5):521–8.
[39] Sagarra M, Mar-Molinero C, Agasisti T. Exploring the efficiency of Mexican uni-versities: Integrating Data Envelopment Analysis and Multidimensional Scaling. Omega (United Kingdom) 2017;67:123–33https://doi.org/10.1016/j.omega. 2016.04.006.
[40] Schiffman SS, Reynolds ML, Young FW. Introduction to multidimensional scaling: Theory, methods and applications. London: Academic Press Inc; 1981. [41] Hair JF, Black JW, Babib BJ, Anderson RE. Multivariate Data Analysis. seventh ed.
Pearson; 2014.
[42] Dash U, Vaishnavi SD, Muraleedharan VR, Acharya D. Benchmarking the perfor-mance of public hospitals in Tamil Nadu: An application of data envelopment analysis. J Health Manag 2007;9:59–74.
[43] Mark BA, Jones CB, Lindley L, Ozcan YA. An examination of technical efficiency, quality, and patient safety in acute care nursing units. Pol Polit Nurs Pract 2009;10(3):180–6https://doi.org/10.1177/1527154409346322.
[44] Ozcan YA, Lins ME, Stella M, Lobo C, Da Silva ACM, Fiszman R, Pereira BB. Evaluating the performance of Brazilian university hospitals. Ann Oper Res 2010;178:247–61.
[45] Ketabi S. Efficiency measurement of cardiac care units of Isfahan hospitals in Iran. J Med Syst 2011;35:143–50.
[46] Gautam S, Hicks L, Johnson T, Mishra B. Measuring the performance of critical access hospitals in Missouri using data envelopment analysis. J Rural Health 2013;29:150–8.
[47] Prakash V, Annapoorni D. Performance Evaluation of Public Hospitals in Tamil Nadu: DEA Approach. J Health Manag 2015;17(4):417–24https://doi.org/10. 1177/0972063415606267.
[48] Banker RD, Conrad RF, Strauss RP. A comparative application of data envelopment analysis and translog methods: an illustrative study of hospital production. Manag Sci 1986;32(1):30–44.
[49] Ferrier GD, Rosko MD, Valdmanis VG. Analysis of uncompensated hospital care using a DEA model of output congestion. Health Care Manag Sci
2006;9(2):181–8https://doi.org/10.1007/s10729-006-7665-8.
[50] Audibert M, Mathonnat J, Pelissier A, Huang XX, Ma A. Health insurance reform and efficiency of township hospitals in rural China: An analysis from survey data. China Econ Rev 2013;27:326–38https://doi.org/10.1016/j.chieco.2013.01.004. [51] Bannick RR, Ozcan YA. Efficiency analysis of federally funded hospitals:
Comparison of DoD and VA hospitals using data envelopment analysis. Health Serv Manag Res 1995;8(2):73–85https://doi.org/10.1177/095148489500800201. [52] Linna M, Häkkinen U, Magnussen J. Comparing hospital cost efficiency between
Norway and Finland. Health Policy 2006;77(3):268–78https://doi.org/10.1016/j. healthpol.2005.07.019.
[53] Leleu H, Moises J, Valdmanis VG. How do payer mix and technical inefficiency affect hospital profit? A weighted DEA approach. Oper Res Health Care 2014;3(4):231–7https://doi.org/10.1016/j.orhc.2014.06.002.
[54] Chang H. Determinants of Hospital Efficiency: the Case of Central Government-owned Hospitals in Taiwan. Omega 1998;26(2):307–17https://doi.org/10.1016/ S0305-0483(98)00014-0.
[55] Wang R, Yu M. Evaluating the Efficiency of Hospital's Departments Using DEA. IEEE International Conference on Service Operations and Logistics, and Informatics. 2006. p. 1167–70. Shanghaihttps://doi.org/10.1109/SOLI.2006. 328916.
[56] Du J, Wang J, Chen Y, Chou S-Y, Zhu J. Incorporating health outcomes in Pennsylvania hospital efficiency: an additive super-efficiency DEA approach. Ann Oper Res 2014;221(1):161–72https://doi.org/10.1007/s10479-011-0838-y. [57] Chern JY, Wan TTH. The impact of the prospective payment system on the
tech-nical efficiency of hospitals. J Med Syst 2000;24(3):159–72https://doi.org/10. 1023/A:1005542324990.
[58] Bates LJ, Mukherjee K, Santerre RE. Market structure and technical efficiency in the hospital services industry: A DEA approach. Med Care Res Rev
2006;63(4):499–524https://doi.org/10.1177/1077558706288842.
[59] Applanaidu SD, Samsudin S, Ali J, Dash U, Chik AR. Technical and Scale Efficiency of Public District Hospitals in Kedah, Malaysia: A Data Envelopment Analysis (DEA). J Health Manag 2014;16(3):327–35https://doi.org/10.1177/ 0972063414539595.
[60] Chirikos TN, Sear AM. Technical efficiency and the competitive behavior of hos-pitals. Soc Econ Plann Sci 1994;28(4):219–27 https://doi.org/10.1016/0038-0121(94)90027-2.
[61] Zere E, Mbeeli T, Shangula K, Mandlhate C, Mutirua K, Tjivambi B, Kapenambili
W. Technical efficiency of district hospitals: Evidence from Namibia using data envelopment analysis. Cost Eff Resour Allocation 2006;4:1–9https://doi.org/10. 1186/1478-7547-4-5.
[62] Yang J, Zeng W. The trade-offs between efficiency and quality in the hospital production: some evidence from Shenzhen, China. China Econ Rev 2014;31:166–84https://doi.org/10.1016/j.chieco.2014.09.005.
[63] Hajialiafzali H, Moss JR, Mahmood M a. Efficiency measurement for hospitals owned by the Iranian social security organisation. J Med Syst
2007;31(3):166–72https://doi.org/10.1007/s10916-007-9051-6.
[64] Ferrier G, Valdmanis V. Rural hospital performance and its correlates. J Prod Anal 1996;80:63–80.
[65] Masiye F. Investigating health system performance: An application of data en-velopment analysis to Zambian hospitals. BMC Health Serv Res
2007;7:1–11https://doi.org/10.1186/1472-6963-7-58.
[66] Karagiannis R. A system-of-equations two-stage DEA approach for explaining ca-pacity utilization and technical efficiency. Ann Oper Res
2015;227(1):25–43https://doi.org/10.1007/s10479-013-1367-7.
[67] Grosskopf S, Valdmanis VG. Measuring hospital performance. A non-parametric approach. J Health Econ 1987;6:89–107https://doi.org/10.1016/0167-6296(87) 90001-4.
[68] Mitropoulos P, Talias MA, Mitropoulos I. Combining stochastic DEA with Bayesian analysis to obtain statistical properties of the efficiency scores: An application to Greek public hospitals. Eur J Oper Res 2015;243(1):302–11https://doi.org/10. 1016/j.ejor.2014.11.012.
[69] Grosskopf S, Valdmanis V. Evaluating hospital performance with case-mix-ad-justed outputs. Med Care 1993;31(6):525–32.
[70] Zhong J. Comparative study on performance assessment of hospitals in various regions of China through comprehensive variable DEA and traditional DEA. Proceedings - 2009 2nd IEEE International Conference on Computer Science and Information Technology, ICCSIT 2009. 2009. p. 423–7https://doi.org/10.1109/ ICCSIT.2009.5235015.
[71] Lindlbauer I, Schreyögg J, Winter V. Changes in technical efficiency after quality management certification: A DEA approach using difference-in-difference estima-tion with genetic matching in the hospital industry. Eur J Oper Res
2016;250(3):1026–36https://doi.org/10.1016/j.ejor.2015.10.029. [72] Gruca TS, Nath D. The technical efficiency of hospitals under a single payer
system: the case of Ontario community hospitals. Health Care Manag Sci 2001;4(2):91–101https://doi.org/10.1023/A:1011401510010.
[73] Sengupta A, Mondal SK. Efficiency and financing in catering primary health care to the poors: A study of rural health services in India. J Health Manag
2009;11(3):501–26https://doi.org/10.1177/097206340901100304.
[74] Hao SHS, Pegels CC. Evaluating relative efficiencies of Veterans Affairs medical centers using data envelopment, ratio, and multiple regression analysis. J Med Syst 1994;18(2):55–67https://doi.org/10.1007/BF00999452.
[75] Kazley AS, Ozcan YA. Electronic medical record use and efficiency: A DEA and windows analysis of hospitals. Soc Econ Plann Sci 2009;43(3):209–16https://doi. org/10.1016/j.seps.2008.10.001.
[76] Toloo M, Jalili R. LU Decomposition in DEA with an Application to Hospitals. Comput Econ 2016;47(3):473–88https://doi.org/10.1007/s10614-015-9501-z. [77] Harris J, Ozgen H, Ozcan Y. Do mergers enhance the performance of hospital
ef-ficiency? J Oper Res Soc 2000;51(7):801–11https://doi.org/10.1057/palgrave. jors.2600869.
[78] Sikka V, Luke RD, Ozcan YA. The efficiency of hospital-based clusters: Evaluating system performance using data envelopment analysis. Health Care Manag Rev 2009;34(3):251–61https://doi.org/10.1097/HMR.0b013e3181a16ba7. [79] Hofmarcher MM, Paterson I, Riedel M. Measuring hospital efficiency in Austria–a
DEA approach. Health Care Manag Sci 2002;5(1):7–14https://doi.org/10.1023/ A:1013292801100.
[80] Caballer-Tarazona M, Moya-Clemente I, Vivas-Consuelo D, Barrachina-Martínez I. A model to measure the efficiency of hospital performance. Math Comput Model 2010;52(7–8):1095–102https://doi.org/10.1016/j.mcm.2010.03.006.
[81] Mobley LR, Magnussen J. An international comparison of hospital efficiency: does institutional environment matter? Appl Econ 1998;30:1089–100https://doi.org/ 10.1023/A:1005542324990.
[82] Chuang C-L, Chang P-C, Lin R-H. An Efficiency Data Envelopment Analysis Model Reinforced by Classification and Regression Tree for Hospital Performance Evaluation. J Med Syst 2011;35(5):1075–83 https://doi.org/10.1007/s10916-010-9598-5.
[83] Nunamaker T. Measuring routine nursing service efficiency: a comparison of cost per patient day and data envelopment analysis models. Health Serv Res 1983;18(2):183–205.
[84] Tlotlego N, Nonvignon J, Sambo LG, Asbu EZ, Kirigia JM. Assessment of pro-ductivity of hospitals in Botswana: A DEA application. Int Arch Med 2010;3(1):27https://doi.org/10.1186/1755-7682-3-27.
[85] O'Neill L. Multifactor efficiency in data envelopment analysis with an application to urban hospitals. Health Care Manag Sci 1998;1:19–27.
[86] Dash U, Vaishnavi SD, Muraleedharan VR. Technical efficiency and scale efficiency of district hospitals: A case study. J Health Manag 2010;12(3):231–48https://doi. org/10.1177/097206341001200302.
[87] Ozcan YA. Efficiency of Hospital-Service Production in Local Markets - the Balance-Sheet of Us Medical Armament. Soc Econ Plann Sci
1995;29(2):139–50https://doi.org/10.1016/0038-0121(95)00006-8.
[88] Wei CK, Chen LC, Li RK, Tsai CH. Exploration of efficiency underestimation of CCR model: Based on medical sectors with DEA-R model. Expert Syst Appl 2011;38(4):3155–60https://doi.org/10.1016/j.eswa.2010.08.108.

![Table 8 shows the component loadings which have been derived by using Varimax with Kaiser Normalization [41]](https://thumb-eu.123doks.com/thumbv2/9libnet/5443569.104518/7.892.60.432.92.379/table-shows-component-loadings-derived-varimax-kaiser-normalization.webp)