T.C.
BAHÇEŞEHĐR ÜNĐVERSĐTESĐ
COMPUTER BASED TESTING
Evaluation of Question Classification for Computer
Adaptive Testing
Master Thesis
BETÜL ERDOĞDU
T.C.
BAHÇEŞEHĐR ÜNĐVERSĐTESĐ
FEN BĐLĐMLERĐ ENSTĐTÜSÜ BĐLGĐSAYAR MÜHENDĐSLĐĞĐ
COMPUTER BASED TESTING
Evaluation of Question Classification for Computer
Adaptive Testing
Master Thesis
BETÜL ERDOĞDU
Supervisor: ASSOC. DR. ADEM KARAHOCA
ii
T.C.
BAHÇEŞEHĐR ÜNĐVERSĐTESĐ
The Graduate School of Natural and Applied Sciences Computer Engineering
Name of the thesis : COMPUTER BASED TESTING
Evaluation of Question Classification for Computer Adaptive Testing
Name/Last Name of the Student : Betül Erdoğdu Date of Thesis Defense : 12/06/2009
The thesis has been approved by the Graduate School of Natural and Applied Sciences
Signature
Director
Prof. Dr. A. Bülent ÖZGÜLER
This is to certify that we have read this thesis and that we find it fully adequate in scope, quality and content, as a thesis for the degree of Master of Science.
Examining Committee Members Signature
Assoc. Prof. Dr. Adem KARAHOCA ____________________ Prof. Dr. Nizamettin AYDIN ____________________ Asst. Prof. Dr. Yalçın ÇEKĐÇ ____________________
iii
ACKNOWLEDGEMENTS
I first wish to thank to my family and friends for their unlimited support and love in every stage of my life. I am sure that they patiently waited to see the steps in my academic career and I am very happy to make their dreams come true.
I also wish to thank Assoc. Prof. Dr. Adem KARAHOCA and Dilek KARAHOCA for their encouragement and assistance in every field related with the project. I cannot forget their support in this project and they have a great role in my success.
In addition to these, Prof. Dr. Şenay YALÇIN, Prof. Dr. Ali GÜNGÖR and Y.Doç.Dr. Ahmet BEŞKESE are the names that I cannot forget in my life because of their endless support in every stage of my life.
Last but not least, I wish to thank to all instructors of Bahçeşehir University and my friends for their patience, support and love.
iv
ÖZET
BĐLGĐSAYAR DESTEKLĐ SINAV
Bilgisayar Uyarlamalı Sınav için Soru Sınıflandırma Değerlendirmesi Erdoğdu, Betül
Yüksek Lisans, Bilgisayar Mühendisliği Bölümü Tez Yöneticisi: Doç. Dr. Adem Karahoca
Haziran 2009, 65 sayfa
Bu çalışmanın amacı kullancının bir soruya verdiği cevaba göre sınavdaki bir sonraki soruyu tespit edecek bilgisayar destekli bir sınav sisteminde kullanılmak üzere hazırlanan soruların zorluk derecesini en iyi şekilde belirlemektir Kullanıcının bir soruya verdiği cevaba göre bir sonraki soruyu seçen bilgisayar destekli sınavlara bilgisayar uyarlamalı sınav denir. Öncelikle hazırlanan soruların zorluklarını belirleyebilmek için bu soruları kullanıcıya bilgisayar üzerinden aktaracak bir uygulama geliştirilmiştir. Kullanıcıların geliştirilen uygulama üzerinden verdikleri cevaplar farklı istatistiksel yöntemlerle değerlendirilerek soruların zorlukları belirlenmiştir. Buna bağlı olarak soru zorluğunu en iyi tespit eden yöntem bulunmuştur. Soru zorlukları en iyi tespit eden yöntem bulunduktan sonra, hazırlanan sorular RRT yöntemi ile sınıflandırılmıştır. Bu sınıfandırma bu çalışmanın gelecekteki yolunu çizmiştir. Đlki bilgisayar uyarlamalı sınav yazılımlarında soruları sınıflandırmak için en iyi yöntemin ne olduğudur. Đkinci sonuç ise soru sınıflandırmalarında soru havuzunun büyüklüğünün önemidir.
Bunlara ek olarak, bu tez daha önce yapılmış bilgisayar uyarlamalı test uygulamalarını, bilgisayar destekli ve bilgisayar uyarlamalı testler arasındaki farkı, bu çalışmanın bilgisayar uyarlamalı test yazılımı geliştirmek için nasıl kullanılacağını da özetler.
v
Anahtar Kelimeler: Soru Analizi, Bilgisayar Destekli Test, Bilgisayar Uyarlamalı
vi
ABSTRACT
COMPUTER BASED TESTING
Evaluation of Question Classification for Computer Adaptive Testing Erdoğdu, Betül
M.S. Department of Computer Engineering Supervisor: Assoc. Prof. Dr. Adem KARAHOCA
June 2009, 65 pages
The objective of this thesis is to determine the item difficulties in a test that are going to be used on Computer Adaptive Testing (CAT). Computer Based Testing (CBT) software has been developed to collect user responses to sample items. According to these user responses, item difficulties have been found using different approaches. Consequently, best approach to find item difficulty has been determined by a simple classification tool. Since using this classification tool, the best method to find item difficulties is determined, items have been classified using RRT algorithm. This classification ended up with two different results that define the future work of this study. First one tries to reveal which algorithm is the best method for classifying the questions for CAT software; and the second one has determined whether the size of item pool is important for question classification.
In addition, this thesis outlines the previous work about CAT software, differences between CAT and CBT, how the current work will be used to further to implement CAT software. Finally, the benefits and potential limitations of this research are also presented here.
Keywords: Item Analysis, Computer Based Testing, Computer Adaptive Testing, Data
vii
TABLE of CONTENTS
ACKNOWLEDGEMENTS ... ii
ÖZET ... iv
Abstract ... vi
Table of contents ... vii
List of tables ... ix
List of figures ... x
Abbreviations ... xi
1. INTRODUCTION ... 1
2. Literature survey ... 5
2.1 Historical Evolution of Testing ... 5
2.2 Sample Computer Based Testing Applications around the World ... 7
2.2.1 Test of English as a Foreign Language (TOEFL) CBT ... 7
2.2.2 Armed Services Vocational Aptitude Battery (ASVAB) CAT ... 8
2.2.3 Graduate Record Examination (GRE) CAT ... 9
3. DIFFERENT APPROACHES FOR TESTING WITH COMPUTERS ... 11
3.1 Introduction to Computer Based Testing (CBT) & Computer Adaptive Testing (CAT) ... 11
3.1.1 Visualization ... 12
3.1.2 Audition ... 13
3.1.3 Interaction ... 13
3.2 Administration of Computer Based Tests ... 14
3.3 Computer Based Testing (CBT) ... 15
3.4 Computer Adaptive Testing (CAT) ... 16
3.5 Comparison between CAT & CBT ... 18
4. CBT DEVELOPMENT ... 20
4.1 The Need for Developing a CBT Application ... 20
4.2 Developing the Testing Application ... 21
5. QUESTION CLASSIFICATION FOR COMPUTER ADAPTIVE TESTING ... 23
viii
5.2 Methods to Find Item Difficulty ... 24
5.2.1 p – value ... 24
5.2.2 Norm-Referenced Item Analysis ... 26
5.2.3 Item Response Theory ... 30
5.2.4 Selecting the Best Algorithm for Determining Item Difficulties ... 32
6. CONCLUSIONS AND FUTURE WORKs ... 35
References ... 38
Appendices ... 43
Appendix – A... 43
Appendix – B ... 50
ix
LIST of TABLES
Table 5-1 Nominal question levels ... 23
Table 5-2 c, n, p and nominal question levels for the Midterm exam using p-value method ... 25
Table 5-3 Mean and Standard Deviation of Item Difficulties found by p-value Method for Midterm and Final Exams ... 25
Table 5-4 c, n, p and Nominal Question Levels for the Final Exam using p-value Method ... 26
Table 5-5 Lp, Up, a and p and Nominal Question Levels ... 28
Table 5-6 Mean and Standard Deviation of Item Difficulties found by Norm-Referenced Item Analysis Method for Midterm and Final Exams ... 28
Table 5-7 Lp, Up, a and p and Nominal Question Levels for the Final Exam using ... 29
Table 5-8 Recommended Difficulty Index for Various Test Items ... 30
Table 5-9 MSCA, ID and Nominal Question Levels for the Midterm Exam using IRT 31 Table 5-10 Mean, Standard Deviation and Minimum of Item Difficulties found by IRT for Midterm and Final Exams ... 31
Table 5-11 MSCA, ID and Nominal Question Levels for the Final Exam using IRT ... 32
Table 5-12 Classification Results for p-value, Norm-Referenced Item Analysis according to RRT ... 33
Table 5-13 Classification Results for p-value, Norm-Referenced Item Analysis on Nominal Data according to RRT ... 33
Table B-1 Classification Results for p-value according to RRT ... 50
Table B-2 Statistical Results for p-value according to RRT ... 50
Table B-3 Classification Results for Norm - Referenced Item Analysis according to RRT ... 51
Table B-4 Statistical Results Norm - Referenced Item Analysis according to RRT ... 51
Table B-5 Classification Results for IRT according to RRT ... 51
x
LIST OF FIGURES
Figure 2-1 This graph shows how the test keeps a running score of your performance as you take the test. The student's running score goes up when he gets the first three questions right (blue) and the score goes down when the test taker gets questions wrong
(red) ... 10
Figure 2-2 The blue graph shows a student who got the first 8 questions right and the remainder wrong and the red graph show a student who got the first 8 questions wrong and the remainder right. The blue student scores much higher, despite answering fewer questions ... 10
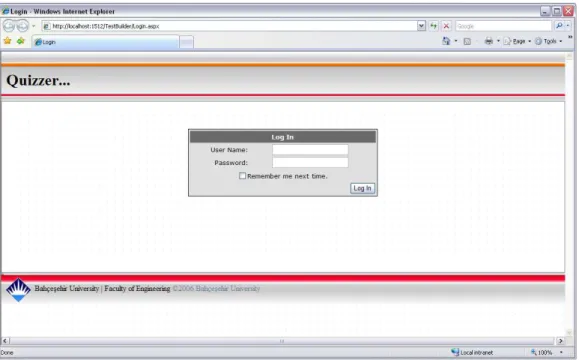
Figure 0-1 Login screen ... 21
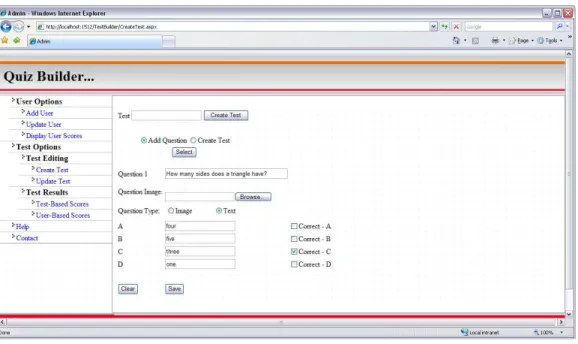
Figure 0-2 Question entry screen ... 22
Figure A-1 Login screen ... 43
Figure A-2 Test creation screen ... 44
Figure A-3 Test creation screen after a question addition ... 44
Figure A-4 Test selection screen ... 45
Figure A-5 Test editing screen ... 45
Figure A-6 User home page screen ... 46
Figure A-7 User test selection screen ... 46
Figure A-8 User test selection warning screen ... 47
Figure A-9 Text based question displaying screen ... 47
Figure A-10 Picture including question displaying screen ... 48
Figure A-11 Multiple picture choice question displaying screen ... 48
xi
ABBREVIATIONS
ASVAB : Armed Services Vocational Aptitude Battery CAT : Computer Adaptive Testing
CBT : Computer Based Testing GRE : Graduate Record Examination ID : Item Difficulty
IRT : Item Response Theory
MSCA : Minimum Sum of Correct Answers NRT : Norm-Referenced Test
PC : Personal Computer
RRT : Rapidly-exploring Random Tree
SCAE : Sum of Correct Answers of Each Question TOEFL : Test of English as a Foreign Language
1
1.
INTRODUCTION
Computer technologies are becoming an important part of the foundation for improved education delivery. So implementation, standardization and regulation of computers, computer based education and computer assisted assessments are becoming more and more popular each day.
The potential of computers to create a better training environment is a widely discussed issue in education today. Now many organizations and experts are trying to find answers to questions like: What are the benefits of using computers in teaching and testing students? What are the flexibility issues of using computers rather than traditionally linear-structured information delivery? What is the proper period and way to use computers in education? How can the course content or tests be delivered to the students by text, images or icons? How should the user interfaces be?
As explained above, in education computers can be used to deliver the course content or to measure the success rate of the course. This thesis dwells upon the assessment techniques in education via computers. The British Standards Institution estimates that approximately 1000 computer-assisted assessments are performed each day in the United Kingdom (British Standards Institution, 2001). In addition, a number of studies relating to the use of computers in student assessment within British Higher Education have been published in recent years, some examples being Towse and Garside (1998), Harvey and Mogey (1999), Doubleday (2000), Kleeman, Keech, and Wright (2001), Conole and Bull (2002) and Sclater and Howie (2003). These studies covered a wide range of computer-delivered assessments, and this thesis study focuses on two specific delivery methods: computer-based test (CBT) and computer-adaptive test (CAT). As others (Mason, Patry, and Bernstein, 2001; De Angelis 2000; Harvey, and Mogey 1999; Pritchett 1999) have reported numerous benefits of the CBT approach over the standard paper-and-pencil one. These benefits ranged from the automation of marking and subsequent reduction in marking workload to the opportunity to provide students with immediate feedback on their performance (Lilley, Barker, Britton, 2004).Due to
2
the limitations of traditional success measuring rates, the contribution to the understanding of students’ knowledge about a subject is little. The use of CBTs is an attempt to overcome these limitations and go some way to making course and assessments more interesting and useful processes for both teachers and students. Computer-based testing has been developing quickly since then as new question formats, alternative models of measurement, improvements in test administration, immediate feedback to test takers, and more efficient information gathering are possible through using computers (Mills, 2002; Wise & Plake, 1990; Akdemir & Oguz, 2008). A growing trend among organizations and test developers is increasingly moving their paper-and- pencil tests to computer-based tests (Mills, 2002). So, instead of persuading educators to use traditional teaching techniques, information system specialists should develop software that assist them in teaching and measuring the success level of a course.
Notwithstanding these benefits, previous work by others (Carlson 1994; Wainer 1990; Freedle, and Duran 1987; Lord 1980) suggested that CBTs have often being viewed as unsatisfactory in terms of efficiency. The reason for this inefficiency is that the questions administered during a given CBT session are not tailored for the specific ability of an individual student. In a typical CBT, the same predefined set of questions is presented to all students participating in the assessment session, regardless of their ability (Lilley, Barker, Britton, 2004).The questions within this fixed set are typically selected in such a way that a broad range of ability levels, from low to advanced, is catered for (Pritchett, N. 1994). In this scenario, it is accepted that high-performance students are presented with one or more questions that are below their level of ability. Similarly, low-performance students are presented with questions that are above their level of ability (Lilley, Barker, Britton, 2004).
The underlying idea of a CAT is to offer each student a set of questions that is appropriate to their level of ability (Lilley, Barker, Britton, 2004). Generally, a CAT initiates with a random question with an average difficulty. A more difficult question follows if the student answers the question correctly. Conversely, if the response provided is incorrect, an easier question that is suitable for this new lower estimate is presented next Lilley and Barker (2003, 2002).
3
The use of CAT has been increasing and indeed replacing traditional CBTs in some areas of education and training (Lilley, Barker, Britton, 2004). Usually this replacement is associated with the need for higher efficiency when assessing large numbers, for example, in online training. The replacement of CBTs with CATs in examinations such as the Graduate Management Admission Test1, Test of English as a Foreign Language2 and Microsoft Certified Professional3 are evidence of this trend.
The study presented here focuses on the evaluation of determining item difficulties for CAT software. Accordingly, a brief explanation of item classification according to difficulties is followed by the study that reveals the best classification algorithm. Furthermore, previous work on testing, different testing approaches and the pedagogical aspects of these approaches, the future directions of the research within computer adaptive testing are discussed along with our perceptions on the benefits and limitations of these classification methods.
This study launched with the development of a simple CBT application designed by using .NET platform to investigate the power of computer based testing for a course of university students. Then some items from the CBT application were classified to determine the item difficulties. For this classification, Weka and Rapidminer were used. To produce the CBT application, Visual Studio .NET 2005 and SQL Server 2005 were used since both are convenient and popular for applications that need to combine user interfaces with database. Developing a testing application using .NET platform is reviewed in Chapter 4 and use of .NET for application development is being discussed in Chapter 3. The second part (Chapter 2) is devoted to computer based testing techniques and their comparison. Chapter 5 focuses on the evaluation of determining item difficulties for CAT software. In this section of this study, there is a brief explanation of item classification according to difficulties followed by the study that reveals the best algorithm that determines item difficulties.
1 www.mba.com/mba/TaketheGMAT/TheEssentials/WhatIstheGMAT/ComputerAdaptiveFormat.htm
2007
2 www.toefl.org/educator/edcomptest.html 2007
4
In the last part (Chapter 6) of the thesis, the results within computer adaptive testing obtained from this study are being discussed along with perceptions on the benefits and limitations of these evaluation methods. This chapter concludes with the further suggestions and tips on the subject.
5
2.
LITERATURE SURVEY
There is lots of academicals and commercial work done on computer based testing applications. The need of speed, time flexibility, low-cost, fair scoring and besides the unceasingly increasing information technology makes the computer based testing applications essential. In recent years many researches has been done on this issue and below the historical evolution and some examples are explained.
2.1 HISTORICAL EVOLUTION OF TESTING
For a long time, educational testing has focused mainly on paper and-pencil tests and performance assessments. Since the late 1980s, when the large-scale dissemination of personal computers (PCs) in education began, these testing formats have been rapidly extended to formats suitable for delivery by computer. Computer-based delivery of tests has several advantages. For example, it allows for testing on demand, that is, whenever and wherever an examinee is ready to take the test. Also, the enormous power of modern PCs as well as their ability to control multiple media can be used to create innovative item formats and more realistic testing environments. Furthermore, computers can be used to increase the statistical accuracy of test scores using computerized adaptive testing (CAT). Instead of giving each examinee the same fixed test, CAT item selection adapts to the ability level of individual examinees. After each response the examinee’s ability estimate is updated and the subsequent item is selected to have optimal properties at the new estimate.
The idea of adapting the selection of the items to the examinee is certainly not new. In the Binet-Simon (1905) intelligence test, the items were classified according to mental age, and the examiner was instructed to infer the mental age of the examinee from the earlier responses to the items and to adapt the selection of the subsequent items to his or her estimate until the correct age could be identified with sufficient certainty. In fact, the idea of adaptive testing is even as old as the practice of oral examinations. Good oral
6
examiners have always known to tailor their questions to their impression of the examinees’ knowledge level.
The development of item response theory (IRT) in the middle of the last century has provided a sound psychometric footing for CAT. The key feature of IRT is its modeling of response behavior with distinct parameters for the examinee’s ability and the characteristics of the items. Due to this parameter separation, the question of optimal item parameter values for the estimation of examinee ability became relevant. The main answer to this question was given by Birnbaum (1968) who proved that, unless guessing is possible, the optimal item is the one with the highest value for the item discrimination parameter and a value for the difficulty parameter equal to the ability of the examinee. The further development and fine tuning of the psychometric techniques needed to implement CAT took several decades. Because the first computers were slow and did not allow for ability estimation in real time, early research was almost exclusively directed at finding approximations or alternative formats that could be implemented in a traditional paper-and-pencil environment. Examples include the two stage testing format (Cronbach & Gleser, 1965), Bayesian item selection with an approximation to the posterior distribution of the ability parameter (Owen, 1969), the up-and-down method of item selection (Lord, 1970), the Robbins-Monro algorithm (Lord, 1971a), the flexi level test (Lord, 1971b), the stradaptive test (Weiss, 1973), and pyramidal adaptive testing (Larkin & Weiss, 1975).
With the advent of more powerful computers, application of CAT in large-scale high-stakes testing programs became feasible. A pioneer in this field was the US Department of Defense with its Armed Services Vocational Aptitude Battery (ASVAB). After a developmental phase, which began in 1979, the first CAT version of the ASVAB became operational in the mid 1980s. However, the migration from paper-and-pencil testing to CAT truly began when the National Council of State Boards of Nursing launched a CAT version of its licensing exam (NCLEX/ CAT) and was followed with a CAT version of the Graduate Record Examination (GRE). Ever since, many other large-scale tests like the Test of English as a Foreign Language (TOEFL), State Farm Insurance's selection test programs have followed. It seems safe to state that at the
7
moment the majority of large-scale testing programs either has already been computerized or are in the process of becoming so.
2.2 SAMPLE COMPUTER BASED TESTING APPLICATIONS AROUND THE WORLD
2.2.1 Test of English as a Foreign Language (TOEFL) CBT
In 1998 TOEFL began switching from a paper-based test to a computer-based test (CBT). The TOEFL CBT has four sections: Listening, Structure, Reading, and Writing. While the Structure section on the TOEFL CBT features the same types of questions as the paper-based version, the Listening and Reading sections use some new and innovative types of questions as well as the traditional multiple-choice questions. The Listening and Structure sections are adaptive. But the reading and writing sections are not.
In computer-adaptive sections, questions are chosen from a very large pool of questions that are categorized by difficulty and content. The questions are chosen by the computer, based on how you answer the previous questions. For instance, the first question you receive in a computer- adaptive section will be of average difficulty. The question you receive next will generally be one that best fits your performance. In these sections, you will be able to change your answers as often as you like until you have made your final choice, confirmed your answer, and moved on to the next question. Your answers to all previous questions help determine the difficulty level of the next question you will be given.
The Reading section similar to that of the paper-based test in that you will be given passages and accompanying sets of questions. Because the selection of these passages and questions will not be based on your performance, you will be allowed to omit items or go back to previous questions.
8
In the writing section you will be assigned a topic selected by the computer from a pool of topics. You will be given the choice of handwriting your response or typing it on computer.
The test design for both paper and computer assures that all test takers will be tested on similar skills (e.g. comprehension of main idea, understanding of inferences) and subject matter (a variety of topics for lectures and passages). The scores of all test takers, at all ability levels, are based on the same number of questions. Pretest questions, used for research purposes, may be included in the test, but your answers to these questions are not scored.
2.2.2 Armed Services Vocational Aptitude Battery (ASVAB) CAT
The Armed Services Vocational Aptitude Battery (ASVAB) is a series of tests developed by the Department of Defense in the 1960s. The test consists of 9 individual tests of the following subjects: Word Knowledge, Paragraph Comprehension, Arithmetic Reasoning, Mathematics Knowledge, General Science, Auto & Shop Information, Mechanical Comprehension, Electronics Information, and Assembling Objects.
There are currently three versions of the ASVAB. Results from any one of them can be used for military recruiting purposes.
High School Version: The "High School Version" is officially called "Form 18/19." It's
a paper-based ASVAB commonly given to juniors and seniors in high school through a cooperative program between the Department of Defense and the Department of Education. The test is offered at more than 13,000 high schools and post secondary schools in the United States. The primary purpose of this test is not for enlistment in the military (although the test scores can be used for military enlistment). The primary purpose of this test is to help school counselors and students discover where a student's basic aptitude lies. Approximately 900,000 students take Form 18/19 ASVAB each year.
9
Paper ASVAB for Recruiting: The paper version of the ASVAB used for military
recruiting is officially known as "Forms 20-22." This version is given by the Armed Forces for enlistment purposes only. While the questions on the high school version and the recruiting version are different, they are equal in difficulty. Few people take the paper recruiting version of the ASVAB these days because most folks interested in joining the military take the computerized version of the ASVAB at the Military Entrance Processing Station (MEPS).
CAT-ASVAB: The third version of the test is the CAT-ASVAB, which is a
computerized version of the Forms 20-22 ASVAB. As each question is answered on the computer screen, the computer automatically selects the next question. Most people find that they score better on the CAT-ASVAB than they do on the paper-versions. This is because, for overall ASVAB score calculation (not individual line scores), the mathematics knowledge (MK) and arithmetic reasoning (AR) questions on the ASVAB are "weighted," with harder questions worth more points than easier questions. On the CAT-ASVAB, when one gets an answer right, the computer automatically selects a more difficult question (worth more points). If one gets a question wrong, the computer selects an easier question for the next question.
2.2.3 Graduate Record Examination (GRE) CAT
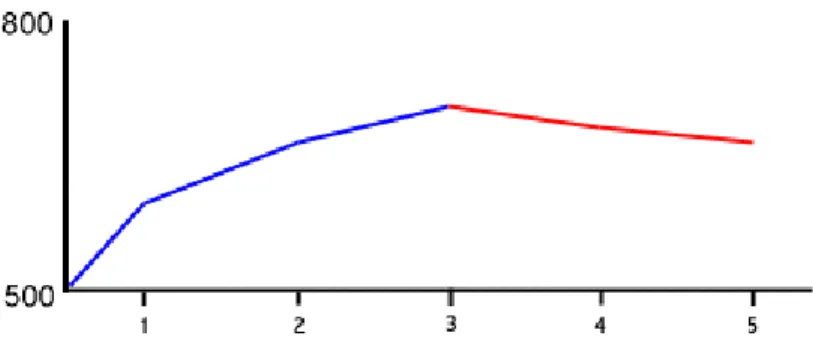
The computer based GRE is a test in which the computer actually adapts to your performance as you're taking the test. Here is how it works: instead of having a pre-determined mixture of easy, medium, and hard questions, the computer will select questions for you based on how well you are doing. The first question will be of medium difficulty (500 level questions are half-way between 200 and 800). If you get it right, the second question will be selected from a large group of questions that are a little harder; if you get the first question wrong, the second will be a little easier. The result is that the test is self-adjusting and self-correcting to your skill level.
10
Figure 2-1 This graph shows how the test keeps a running score of your performance as you take the test. The student's running score goes up when he gets the first three questions right (blue) and
the score goes down when the test taker gets questions wrong (red)
A result of the CAT format is that the harder problems count more than easier ones. If one student does twenty easy questions, half of which he gets right and half of which he gets wrong, and then another student does twenty very difficult questions, half of which he gets right and half of which he gets wrong, the second student will get a higher score. The student who answered ten out of twenty very difficult questions incorrectly would still get a very high score on the GMAT CAT because the harder questions are more heavily weighted. Simpler questions might be easier to answer, but they count much less.
The CAT puts much more value on the earlier questions than the later questions. The computer has to make large jumps in the estimation of your score for each of the first few questions. The later questions are used to fine-tune your score.
Figure 2-2 The blue graph shows a student who got the first 8 questions right and the remainder wrong and the red graph show a student who got the first 8 questions wrong and the remainder
11
3.
DIFFERENT APPROACHES FOR TESTING WITH
COMPUTERS
3.1 INTRODUCTION TO COMPUTER BASED TESTING (CBT) & COMPUTER ADAPTIVE TESTING (CAT)
Since the 1970s there has been a tremendous amount of research on CAT and CBT. Countless psychometrician years of effort were required to produce a test that could be used seamlessly with the paper-based tests. Many other testing programs have also devoted great effort to computerizing their assessment instruments. The efforts devoted to CAT and CBT in the past two decades are reminiscent of the growth of large-scale standardized paper-based testing in the 1940s and 1950s. This growth led to extensive research by psychometricians to ensure that examinees received scores that were fair and equitable. For example, multiple test forms were needed by these large assessment programs so that practice effects and cheating were not an issue. However, the use of multiple test forms creates the problem of placing all examinees' scores on the same scale; thus began the field of test equating.
CBT is having analogous growth today. This growth is creating new technical problems for psychometricians that must be solved for testing programs to operate smoothly. Issues include developing and calibrating large numbers of items, constructing item pools for operational tests, limiting exposure of items to ensure security, designing procedures for scoring tests, and selecting models for characterizing item responses. Furthermore, numerous basic issues have not been adequately studied such as under what conditions should the fundamental unit of analysis be an item or a set of items (i. e., a "testlet").
It is important to maintain one's perspective in the face of the numerous technical challenges to CAT and CBT. Computerization enables a much broader range of measurement advances than just adaptive administration of traditional multiple-choice items. The first is visualization. True color images can be presented with remarkable resolution. Moreover, it is possible to allow users to pan in and out, as well as rotate
12
objects in space. Audition provides a second improvement. Simulations of phone conversations, such as those made to call centers, can also be used to glean information about examinees. What might be called interaction constitutes the third area: Full motion video can be presented by the computer and thus it is possible to develop assessments of skills related to human interactions. Computerization greatly increases the variety of stimulus materials that can be presented to examinees. As noted previously, we can use the terms visualization, audition, and interaction to classify new assessment tools.
3.1.1 Visualization
Computer monitors are rapidly converging to a true color standard that allows 16 million colors to be presented; this represents the maximum number of colors that can be discriminated by the human eye. Moreover, the cost of monitors has fallen rapidly so that the new generation of large monitors can be purchased by many testing programs. Large screen sizes, true color, and high resolution allow high fidelity displays of images.
Ackerman et al. (1999) exploited these features as they developed a dermatological disorder examination for medical students. Various skin disorders are presented with nearly photographic clarity; examinees can pan in and out to view the disorder. Some information about the case history is also presented, and the student must choose the disorder from a long list.
Assessments in many other domains can benefit from improved visualization.
For example, the University of Illinois dendrology course uses visual presentations to test students' abilities to identify trees and woody plants. Identification of rocks in a geology course, paintings in an art course, and molecules in a chemistry course could all benefit from this type of visualization.
13
3.1.2 Audition
It is theoretically possible to present examinees with high-quality color images in a paper-based exam (but panning and rotation are not possible), but it is prohibitively expensive. Audition is even less feasible for paper-based tests. For computerized assessment, however, examinees can put on headphones and "press enter to begin." Vispoel's (1999) musical aptitude test provides a good example of the use of audition. Musical sequences of varying complexity are presented, and the examinee must identify a matching sequence.
Again, the use of audition facilitates the assessment of a wide variety of skills. For example, telephone service centers are becoming an increasingly important means of providing service to customers. Simulations of interactions with customers can be presented to job applicants or trainees, and important diagnostic information can be quickly collected.
3.1.3 Interaction
Paper-based assessments of social and interpersonal skills have been difficult to construct. Stevens and Campion's (1994) test of teamwork skills, for example, has been found to be highly correlated with verbal aptitude following correction for unreliability. This high correlation raises serious questions about the construct validity of the teamwork skills assessment. Nonetheless, research on assessment centers (Gaugler, Rosenthal, Thornton, and Bentson, 1987) suggests that social skills are important in the workplace.
Full-motion video provides an assessment medium with much lower cognitive demands than paper-based tests. Olson-Buchanan et al. (1998 ; Drasgow et al., 1999) used full-motion video to develop an assessment that predicts managers' abilities to deal with conflict in the workplace but is almost perfectly uncorrelated with cognitive ability. Similarly, Donovan et al. (1998) developed an assessment of leadership skills that predicts job performance of managers but is unrelated to cognitive ability. Note that low correlations between cognitive ability and interpersonal skills provides evidence of
14
discriminant validity for the new assessments and provides insights into the structure of human abilities.
The variety of social skills needed by children to interact with their peers seems substantial. Adults also need many disparate social skills to function effectively in the workplace and with their families. Full-motion video presented by a computer seems to be the right way to develop standardized assessments at reasonable costs.
What kinds of psychometric models will adequately characterize responses to assessments using visualization, audition, and interaction? It is not clear that latent trait models are preferable to latent class models for some of the skills that can be assessed in these modalities. Creative work on appropriate models is needed.
3.2 ADMINISTRATION OF COMPUTER BASED TESTS
Currently, large scale testing programs generally administer their tests to large groups of examinees on a relatively infrequently basis. Computer administered tests are impractical for large group administrations simply because it is difficult to have large numbers of computers in one place at one time.
Freeing the test administration model from the large group format has resulted in a wide variety of new options.
Perhaps the most appealing of the many alternatives is individually scheduled testing available on a daily basis. Here examinees reserve a seat in front of a computer for a particular time and take the test at that time. Thus, the test is administered at the convenience of the examinee rather than the convenience of the test publisher. Obviously, examinees find this alternative very attractive.
Individually scheduled testing presents significant challenges for test publishers. In this context, maintaining test security becomes a critical issue because examinees take the test serially. Individuals already tested may describe items that they were presented to as-yet-untested examinees.
15
If these latter examinees encounter any of the described items, it is clear that they are provided an unfair advantage. To counter this threat, several methods for exposure control have been developed to minimize the overlap between items selected for administration to different examinees from a given item pool.
Numerous other administration models can be conceived to address security concerns. These include less frequent test administration, multiple item pools, and specific disclosure test dates. Some of these administration models will be more convenient for the examinee than others. It is possible that disclosure legislation will encourage administration models that are less preferred by examinees. Some of these effects of legislation are likely to be unanticipated, but may be a major concern to examinees that are inconvenienced by the administrative models.
3.3 COMPUTER BASED TESTING (CBT)
The decade of the 1990s has been one of significant change for the measurement profession. Much of the change has been driven by the rapid expansion of computer-based testing (CBT). Although CBTs have been administered for many years, improvements in the speed and power of computers coupled with reductions in their cost have made large-scale computer delivery of tests feasible. CBT is now a common form of test delivery for licensure, certification, and admissions tests. Many large-scale, high-stakes testing programs have introduced CBT either as an option or as the sole means of test delivery. The move to CBT has been, to a great extent, successful. It has not, however, been without problems. As CBT gained in popularity, questions were raised about access to CBT testing centers, the security of CBTs, the reliability of test-delivery systems, the psychometric quality of the tests, and the adequacy of the theoretical models that support them. Traditional concerns about testing, such as item and test bias, continue to be raised with respect to CBTs and have been expanded to include issues such as whether access to technology affects test performance differentially for members of different groups. CBT has been expensive and has placed new demands on test developers to produce more items more rapidly to maintain
16
security in a continuous testing environment. In contrast to these concerns, many measurement professionals have noted that CBT may have the potential to provide a richer understanding of examinee performance and capabilities. Data that is not available in paper-and-pencil testing programs (e. g., time spent per item) may provide new information to inform the interpretation of performance. In addition, there is some evidence that computer processes may supplement or replace manual processes for test development and the scoring of complex responses and, as a result, render certain forms of testing more economical than has been the case in the past. CBT also allows for substantial reductions in the time between test administration and score reporting, a significant benefit in the eyes of many. Finally, test sponsors are free to offer their tests more frequently, a convenience that many examinees find appealing.
CBT is already a major vehicle for test delivery and, in fact, become the dominant form of test delivery. Both the difficulties and the opportunities associated with CBT offer challenges to the measurement profession. Advances in psychometrics are required to ensure that those who rely on test results can have at least the same confidence in CBTs as they have in traditional forms of assessment.
3.4 COMPUTER ADAPTIVE TESTING (CAT)
There are a number of important ways in which CATs and other computerized tests differ from paper-and-pencil tests. First, for paper-and-pencil tests, there is a clearly defined component called a "test form." This is the set of items in a test booklet that counts toward an examinee's reported score. Each year, large testing programs produce several test forms composed of mostly unique test items. It is easy to determine how many items a test form uses, and all items on the form are used the same number of times as the form as a whole.
CATs do not have test forms of the sort encountered with paper-and pencil testing. Instead, items are drawn from the CAT item pool by the item selection algorithm so that items are of appropriate difficulty for each individual examinee. The CAT item pool
17
contains a large number of calibrated items; the item pool may include a few hundred to several thousand items. The items have varying difficulties that assess the material specified in a test's blueprint. Calibrating an item involves first administering it to a large representative sample of examinees under non-operational conditions. Then a statistical analysis is performed to determine characteristics of the item such as its difficulty. Following calibration, items are placed in the CAT item pool; this includes the item's text, the classification of the item vis-à-vis the test blueprint, and the estimated item parameters (including item difficulty).
The item selection algorithm incorporates sophisticated methods derived from item response theory (IRT) to choose items to administer to a particular examinee so that (1) the test is of appropriate difficulty (the item selection algorithm chooses more difficult items if an examinee answers items correctly and easier items if an examinee answers incorrectly); (2) the test provides precise measurement; and (3) all examinees are administered items that span the same test content. Because the test for each individual is created during the process of test administration, there is not a test form in the sense of a conventional paper-and-pencil test.
It has been suggested that the set of items administered to an individual might be considered as a test form. Using this definition, a single CAT item pool would produce hundreds or thousands of different test forms annually. The testing literature has not considered in detail what would constitute the definition of a test form for a CAT or whether the notion of latest form is useful in the context of CAT.
CATs select items from a large collection of items called an item pool. The characteristics of an item pool are critical for a CAT, and the item pool must be constructed very carefully. Also the manner in which the CAT item pool is revised has important implications.
Some of the reasons to switch to computerized test administration were: (1) CAT makes it possible for students to schedule tests at their convenience; (2) tests are taken in a more comfortable setting and with fewer people around than in large-scale paper-and-pencil administrations; (3) electronic processing of test data and reporting of scores is faster; and (4) wider ranges of questions and test content can be put to use.
18
In the current CAT programs, these advantages have certainly been realized and appreciated by the examinees. When offered the choice between a paper-and-pencil and a CAT version of the same test, typically most examinees choose the CAT version. However, the first experiences with actual CAT have also given rise to a host of new questions. For example, in high-stakes testing programs, item security quickly became a problem. The capability of examinees to memorize test items as well as their tendency to share them with future examinees appeared to be much higher than anticipated. As a consequence, the need arose for effective methods to control for item-exposure as well as to detect items that have been compromised.
Also, the question of how to align test content with the test specifications and balance content across test administrations appeared to be more complicated than anticipated. This question has led to a search for new testing algorithms as well as the introduction of a variety of new forms such as testlet-based adaptive testing. Furthermore, items now have to be calibrated on line, and the feasibility of efficient methods of item calibration, using background information on the examinee and employing optimal design techniques, are currently investigated.
3.5 COMPARISON BETWEEN CAT & CBT
Harvey and Mogey (1999) and others (e.g., De Angelis, 2000; Mason, Patry, & Bernstein, 2001;Pritchett, 1999) have stated various advantages of the CBT approach over the standard paper and pencil one. These advantages ranged from the automation of marking and subsequent reduction in marking workload to the opportunity to provide students with immediate feedback on their performance. In spite of these advantages, previous work by Lord (1980), Freedle and Duran (1987), Wainer (1990) and Carlson (1994) showed that CBTs are not satisfactory enough in terms of efficiency. Because the questions delivered during a CBT session are not developed for an ability of a specific student. During a CBT session, the same previously developed questions are delivered to all students without considering their ability. In this condition, students
19
with higher performance are answering questions that are below their ability. And vice versa counts for students with low performance.
Offering each student a set of questions that is appropriate to their level of ability is the reason for CAT. In CAT, questions are dynamically selected for each student according to his/her performance to previous questions. In general terms, a CAT session starts with a random question of average difficulty. If the student answers the question correctly, the estimate of his or her ability is increased. Consequently, it is logically decided that he/she can answer a more difficult question. And a harder question according to this new estimate is asked. If the response is incorrect, a converse manner is used to select the new question for the student.
Asking an easy question to a high ability student would not provide true information about his/her ability even the answer is correct. Likewise, a difficult question answered wrongly by a less successful student would not show the real ability level of this student. By selecting and administering questions that match the individual student’s estimated level of ability, questions that present a low value information are avoided (Lilley & Barker, 2002, 2003). In doing so, the test length can be reduced up to 50% without jeopardising test validity and reliability (Carlson, 1994; Jacobson, 1993; Microsoft Corporation, 2002).
Low performance student might be disappointed and confused, high performance students might be bored and tired of questions with inappropriate levels of difficulty. So it can be stated that in addition to increasing efficiency, CATs also increase the level of interaction and motivation of the student.
20
4.
CBT DEVELOPMENT
The study presented here involves an application of a sample problem from education delivery area by the representation of the test delivery tool developed by using Microsoft .NET platform and item classification techniques applied by Weka and Rapidminer. From this point of view, current study deeply involves in investigation of computer based and computer adaptive testing techniques, development of an application using Microsoft .NET platform, previously developed computer based testing tool applications and classification algorithms and tools.
The problem taken from the education delivery is based on an application that represents measuring proficiency on a course via testing by using database models, question selecting algorithms, developing test items and designing user interfaces run on .NET framework. The approach gives a mean bind to computer based testing problems via database connection to relate and solve those problems since both the application and algorithm parts are considered deeply.
From this study, it is observed that selecting the proper algorithm for question classification can make test delivery for measuring the proficiency level of a course makes test delivery faster and error free.
4.1 THE NEED FOR DEVELOPING A CBT APPLICATION
Firstly a CBT application has been developed. A web-based application that displays questions in a regular or random order – not according to their weights – has been developed in .NET. Afterwards a CBT session weight of each question used in the test was determined. Afterwards, a CAT application will be developed to use these question weights.
21
4.2 DEVELOPING THE TESTING APPLICATION
A small .NET web application has been created for CBT. Same interface has also been used in CAT model with a difference in selecting questions, in other words selecting questions in adaptive manner rather than in a regular or random order.
The application offers different procedures for two different roles; administrator and user. Some interfaces of the application are displayed below, others can be found in Appendix A.
The user enters the system from the below web page. According to the username system checks whether the user is an administrator or an ordinary user. To provide this property, the system checks if the user name is available or not so that the user names are unique.
22
Below screenshot shows a sample question entering process.
23
5.
QUESTION CLASSIFICATION FOR COMPUTER ADAPTIVE
TESTING
5.1 DATA GATHERING AND PREPROCESSING
The dataset introduced here consists of a midterm exam taken by 368 students and a final exam taken by 356 students during the first semester of History of Civilization course. In the midterm exam, there were 13 multiple choice questions with 4 choices and in the final exam, there were 30 multiple choice questions with 4 choices. Questions were delivered via a CBT system to the students using separate computers. CBT system was a web application running on Intranet backbone. Questions delivered during the midterm and final exams were taken into consideration for classification purpose. The reason for classifying these questions is to convert the CBT system to a Computer Adaptive Testing (CAT) system. In CAT, items are drawn from the item pool by a simple item selection algorithm so for each individual examinee, appropriate items are delivered. All items in the CAT item pool range in difficulty values. If an examinee gets an item right, an item having a greater difficulty is selected from the item pool and delivered to the examinee as the next question of the test. If he/she gets it wrong, then an item having a smaller difficulty is selected from the item pool and delivered to the examinee as the next question of the test.
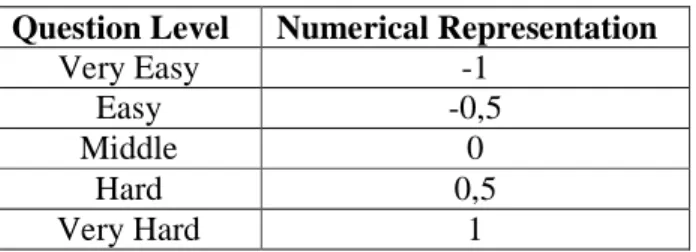
Table 5-1 Nominal question levels
The aim of this section is to determine the initial item difficulties of the questions using the appropriate algorithm so that a CAT application can be developed using these initial item difficulties and the algorithm.
Question Level Numerical Representation
Very Easy -1
Easy -0,5
Middle 0
Hard 0,5
24
In a classification problem, in addition to calculating the item difficulties, output classes have to be determined to create a model. Questions are classified in 5 different classes as very easy, easy, middle, hard and very hard as listed in above table1 (Karahoca, Gökçeli, Güngör et al. 2007).
The problem here is to determine the item difficulties and place them into right nominal question levels.
5.2 METHODS TO FIND ITEM DIFFICULTY
5.2.1 p – value
In many educational and psychological measurement situations, the easiest way is to determine the item difficulty from the proportion of the total group selecting the correct answer to that question. The following formula may be used to calculate the item difficulty factor (called the p-value):
p = c / n
Where c is the number of students who selected the correct answer and n is the total number of respondents.
As seen from Table2 and Table4, p-value is indirectly proportional to the item difficulty. For instance, the 13th question of the midterm exam is answered by 137 test takers among 368 test takers. The p-value of this question is 0,372, which shows that the probability of getting this question is about 37%. With this probability 13th question is the most difficult among the midterm exam questions.
With this information in mind, let’s position the midterm and final questions into the pre-determined Nominal Question Levels in above table.
25
Table 5-2 c, n, p and nominal question levels for the Midterm exam using p-value method
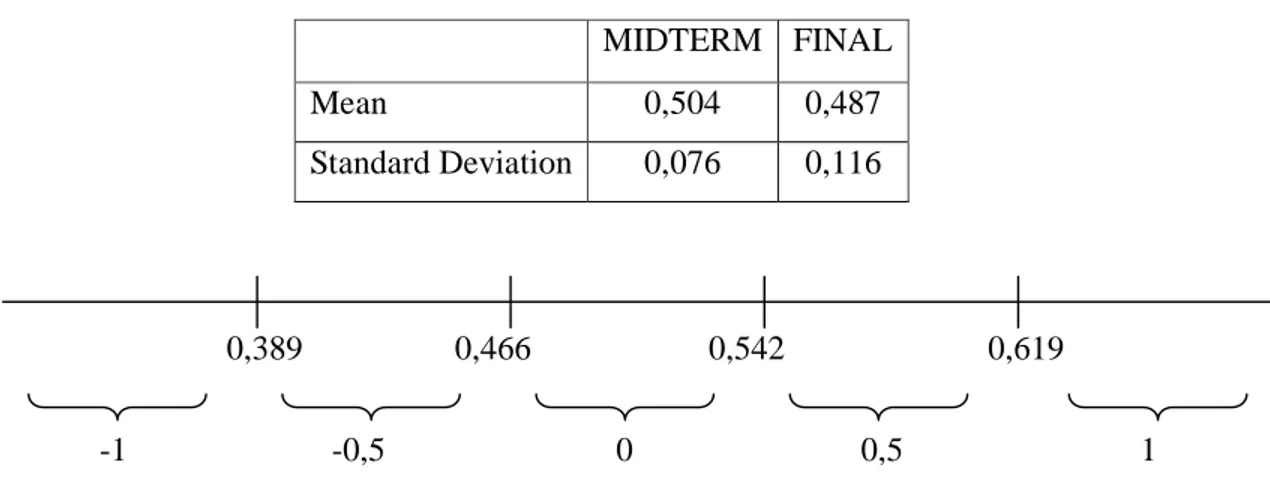
For the items in Table2, the mean and standard deviation is calculated using p values as shown in Table3. According to these mean and standard deviation values, a scale, shown in Figure1, is designed for placing items into nominal question levels. And all items are placed into related nominal question level as shown in below table.
Table 5-3 Mean and Standard Deviation of Item Difficulties found by p-value Method for Midterm and Final Exams
MIDTERM FINAL
Mean 0,504 0,487
Standard Deviation 0,076 0,116
Figure 5-1 Midterm Exam Nominal Question Level vs. Item Difficulty Scale
MIDTERM
Item ID c n p Nominal Question Levels
1 194 368 0,527 0 2 193 368 0,524 0 3 235 368 0,639 -1 4 186 368 0,505 0 5 202 368 0,549 -0,5 6 219 368 0,595 -0,5 7 168 368 0,457 0,5 8 150 368 0,408 0,5 9 207 368 0,563 -0,5 10 172 368 0,467 0 11 194 368 0,527 0 12 156 368 0,424 0,5 13 137 368 0,372 1 -1 -0,5 0 0,5 1 0,389 0,466 0,542 0,619
26
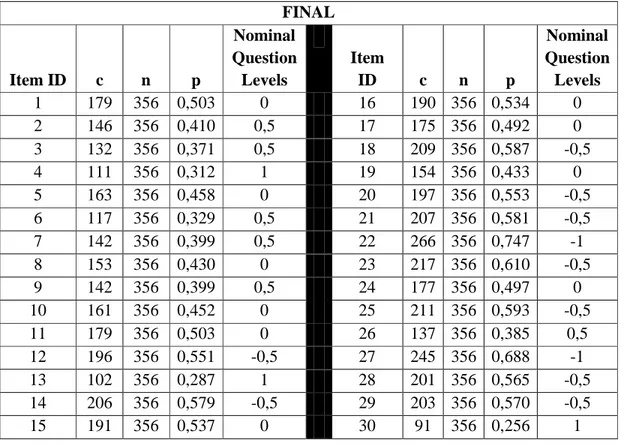
Same procedure is also applied to the final exam items. And nominal distributions found after the procedure are shown in below table.
Table 5-4 c, n, p and Nominal Question Levels for the Final Exam using p-value Method
5.2.2 Norm-Referenced Item Analysis
A norm-referenced test (NRT) is a type of test, assessment, or evaluation in which the tested individual is compared to a sample of his or her peers (referred to as a "normative sample") (By the Numbers, Terry Bergesn). The term "normative assessment" refers to the process of comparing one test-taker to his or her peers.
In NRT, the goal is usually to rank the entire set of individuals in order to make comparisons of their performances relative to one another. In this paper, students’ performances will be analyzed on choice tests. Well-constructed multiple-choice items can be used to diagnose student difficulties if the incorrect options are designed to reveal common misconceptions, and they can provide a more comprehensive sampling of the subject material because more questions can be asked. In addition, they are often more valid and reliable than essay tests because
FINAL Item ID c n p Nominal Question Levels Item ID c n p Nominal Question Levels 1 179 356 0,503 0 16 190 356 0,534 0 2 146 356 0,410 0,5 17 175 356 0,492 0 3 132 356 0,371 0,5 18 209 356 0,587 -0,5 4 111 356 0,312 1 19 154 356 0,433 0 5 163 356 0,458 0 20 197 356 0,553 -0,5 6 117 356 0,329 0,5 21 207 356 0,581 -0,5 7 142 356 0,399 0,5 22 266 356 0,747 -1 8 153 356 0,430 0 23 217 356 0,610 -0,5 9 142 356 0,399 0,5 24 177 356 0,497 0 10 161 356 0,452 0 25 211 356 0,593 -0,5 11 179 356 0,503 0 26 137 356 0,385 0,5 12 196 356 0,551 -0,5 27 245 356 0,688 -1 13 102 356 0,287 1 28 201 356 0,565 -0,5 14 206 356 0,579 -0,5 29 203 356 0,570 -0,5 15 191 356 0,537 0 30 91 356 0,256 1
27
(a) They sample material more broadly; (b) discrimination between performance levels is easier to determine; and (c) scoring consistency is virtually guaranteed when carried out by machine.
The validity of multiple-choice tests depends upon a systematic selection of items with regard to both content and level of learning. Although most teachers try to select items that sample the range of content covered in class, they often fail to consider the level of discrimination and level of difficulty of the items they use.
Item discrimination and item difficulty can be calculated by evaluating the test takers as in norm-referenced item analysis supposed by Brown, J. D (1995, pp. 40-47). Item difficulty is a measure of overall difficulty (p) of the test item. The lower the p, the more difficult a particular item is. Whereas, item discrimination tells us how good a question is for separating high and low performers. It is more important for an item to be discriminable than it is to be difficult.
For norm-referenced item analysis, test takers should be sorted in descending order first. Then two things must be specified: number of people in high and low groups and number of people in high and low groups who get a particular answer right. Using these two groups, item discrimination index and item difficulty index can be calculated using the below formulas:
Item Discrimination Index: a = (Up / U) – (Lp / L)
Item Difficulty Index: p = (Up + Lp) / (U + L) Where,
Up = Number of high performers who got question right
Lp = Number of low performers who got question right
U = Number of high performers L = Number of Low performers
28
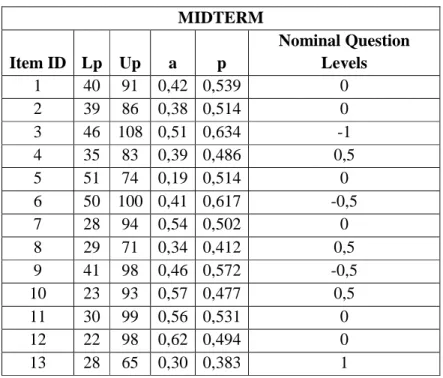
Table 5-5 Lp, Up, a and p and Nominal Question Levels
In Table 5.5 and Table 5.7 are the a and p values for 13 midterm and 30 final questions calculated by the above formulas respectively.
Nominal question levels are found using the same scaling technique in p-value section.
Table 5-6 Mean and Standard Deviation of Item Difficulties found by Norm-Referenced Item Analysis Method for Midterm and Final Exams
MIDTERM Item ID Lp Up a p Nominal Question Levels 1 40 91 0,42 0,539 0 2 39 86 0,38 0,514 0 3 46 108 0,51 0,634 -1 4 35 83 0,39 0,486 0,5 5 51 74 0,19 0,514 0 6 50 100 0,41 0,617 -0,5 7 28 94 0,54 0,502 0 8 29 71 0,34 0,412 0,5 9 41 98 0,46 0,572 -0,5 10 23 93 0,57 0,477 0,5 11 30 99 0,56 0,531 0 12 22 98 0,62 0,494 0 13 28 65 0,30 0,383 1 MIDTERM FINAL Mean 0,513 0,507 Standard Deviation 0,070 0,116
29
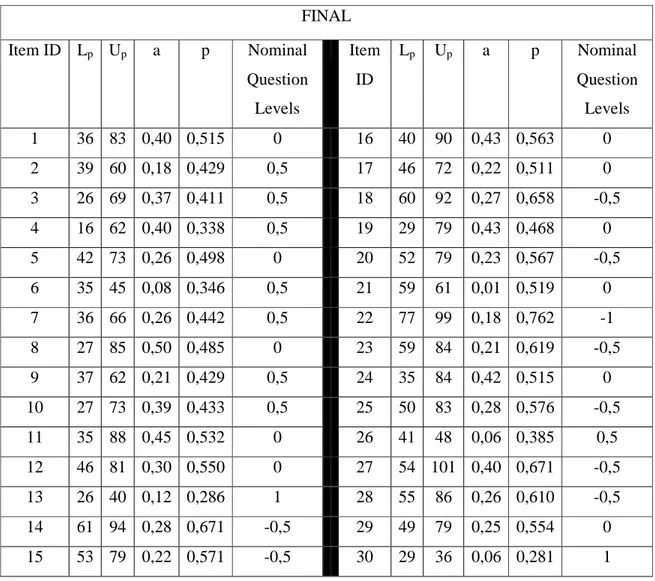
Table 5-7 Lp, Up, a and p and Nominal Question Levels for the Final Exam using
FINAL Item ID Lp Up a p Nominal Question Levels Item ID Lp Up a p Nominal Question Levels 1 36 83 0,40 0,515 0 16 40 90 0,43 0,563 0 2 39 60 0,18 0,429 0,5 17 46 72 0,22 0,511 0 3 26 69 0,37 0,411 0,5 18 60 92 0,27 0,658 -0,5 4 16 62 0,40 0,338 0,5 19 29 79 0,43 0,468 0 5 42 73 0,26 0,498 0 20 52 79 0,23 0,567 -0,5 6 35 45 0,08 0,346 0,5 21 59 61 0,01 0,519 0 7 36 66 0,26 0,442 0,5 22 77 99 0,18 0,762 -1 8 27 85 0,50 0,485 0 23 59 84 0,21 0,619 -0,5 9 37 62 0,21 0,429 0,5 24 35 84 0,42 0,515 0 10 27 73 0,39 0,433 0,5 25 50 83 0,28 0,576 -0,5 11 35 88 0,45 0,532 0 26 41 48 0,06 0,385 0,5 12 46 81 0,30 0,550 0 27 54 101 0,40 0,671 -0,5 13 26 40 0,12 0,286 1 28 55 86 0,26 0,610 -0,5 14 61 94 0,28 0,671 -0,5 29 49 79 0,25 0,554 0 15 53 79 0,22 0,571 -0,5 30 29 36 0,06 0,281 1
The higher the value of a (up to 1), the better the item is capable of separating high and low performance. If a = 1, this means the entire high performance group and none in the lower performance group get a particular question right. Since this is not a frequently seen situation, a rarely (if ever) = 1
An item has an acceptable level of discrimination if a >= 0,30 p and a are not independent probabilities. Discrimination indexes less than 0,30 are sometimes acceptable if we have a very high p value.
From Table5 And Table7, it is observed that 100% of midterm questions and 93,33% of final questions have acceptable level of discrimination. However, none of them are close to the optimum difficulty level. Considering the optimum difficulty index for
30
multiple choice questions with 4 options from Table8, both tests can be termed as easy. But yet, taking student success into consideration yields presented nominal question levels.
Table 5-8 Recommended Difficulty Index for Various Test Items
5.2.3 Item Response Theory
Item difficulty can be determined by using another IRT approach which uses the formula below [15]:
ID = MSCA/SCAE Where,
ID = item difficulty
MSCA = Minimum Sum of Correct Answers SCAE = Sum of Correct Answers of Each Question
Among the midterm questions, the least answered one is the 13th question. So it has the greatest ID. With this information in mind, let’s position the midterm and final questions into the pre-determined Nominal Question Levels in Table1.
For the items in Table9 the mean and standard deviation is calculated using ID values as shown in Table9. The standard deviation value for the midterm exam is used to place items into related nominal question level. Same procedure is also applied to find the levels of the final exam items.
Number of Options (k) Optimum Difficulty Index
2 (True-False) 0,85
4 0,74
31
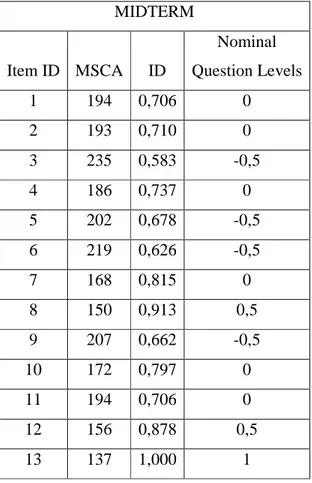
Table 5-9 MSCA, ID and Nominal Question Levels for the Midterm Exam using IRT
According to this algorithm, there is no item tagged as very easy. Forwhy an item can be very easy if and only if converges to zero, in other words the difference between the item having the minimum difficulty and mean must much more than the standard deviation.
Table 5-10 Mean, Standard Deviation and Minimum of Item Difficulties found by IRT for Midterm and Final Exams
MIDTERM FINAL Mean
0,755 0,559 Standard Deviation
0,120 0,155 Minimum item difficulty
0,583 0,342 MIDTERM Item ID MSCA ID Nominal Question Levels 1 194 0,706 0 2 193 0,710 0 3 235 0,583 -0,5 4 186 0,737 0 5 202 0,678 -0,5 6 219 0,626 -0,5 7 168 0,815 0 8 150 0,913 0,5 9 207 0,662 -0,5 10 172 0,797 0 11 194 0,706 0 12 156 0,878 0,5 13 137 1,000 1
32
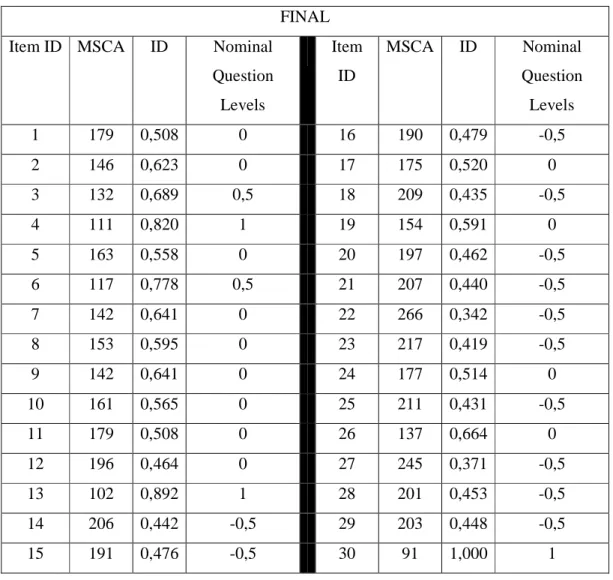
Table 5-11 MSCA, ID and Nominal Question Levels for the Final Exam using IRT
FINAL Item ID MSCA ID Nominal
Question Levels Item ID MSCA ID Nominal Question Levels 1 179 0,508 0 16 190 0,479 -0,5 2 146 0,623 0 17 175 0,520 0 3 132 0,689 0,5 18 209 0,435 -0,5 4 111 0,820 1 19 154 0,591 0 5 163 0,558 0 20 197 0,462 -0,5 6 117 0,778 0,5 21 207 0,440 -0,5 7 142 0,641 0 22 266 0,342 -0,5 8 153 0,595 0 23 217 0,419 -0,5 9 142 0,641 0 24 177 0,514 0 10 161 0,565 0 25 211 0,431 -0,5 11 179 0,508 0 26 137 0,664 0 12 196 0,464 0 27 245 0,371 -0,5 13 102 0,892 1 28 201 0,453 -0,5 14 206 0,442 -0,5 29 203 0,448 -0,5 15 191 0,476 -0,5 30 91 1,000 1
5.2.4 Selecting the Best Algorithm for Determining Item Difficulties
Since item difficulties of both tests are calculated in three different ways, now a classification algorithm called RandomTree is going to be used to determine which of the methods above the best for determining the item difficulty is. For this purpose, final exam data will be used since it has more samples.
A Rapidly-exploring Random Tree (RRT) is a data structure and algorithm designed for efficiently searching non-convex, high-dimensional search spaces. Simply put, the tree
33
is constructed in such a way that any sample in the space is added by connecting it to the closest sample already in the tree (Hambleton, and Swaminathan, (1985)).
According to RRT, classification results for p-value, norm-referenced item analysis and IRT are shown in Table 5-12 and the detailed results are shown in Appendix B:
Table 5-122 Classification Results for p-value, Norm-Referenced Item Analysis according to RRT
Correctly Classified Instances Incorrectly Classified Instances Total Number of Instances Percentage of Correctly Classified Instances Percentage of Incorrectly Classified Instances p – value 6490 4190 10680 60.77 % 39.23 % Norm - Referenced Item Analysis 7052 3628 10680 66.03 % 33.97 % IRT 6343 4337 10680 59.39 % 40.61 %
As seen from the results the questions are not classified perfectly, to correct this problem data is made nominal and RRT is applied to the data again. Using the nominal data, the results are fairer. According to RRT, classification results for p-value, norm-referenced item analysis and IRT on nominal data are shown below in Table 5 - 13:
Table 5-133 Classification Results for p-value, Norm-Referenced Item Analysis on Nominal Data according to RRT Correctly Classified Instances Incorrectly Classified Instances Total Number of Instances Percentage of Correctly Classified Instances Percentage of Incorrectly Classified Instances p – value 9635 1045 10680 90.22 % 9.78 % Norm - Referenced Item Analysis 10252 428 10680 95.99 % 4.01 % IRT 9539 1321 10680 87.63 % 12.37 %
34
Best method to determine the item difficulties is obtained as Norm-Referenced Item Analysis as a consequence of taking both item discrimination and item difficulty into consideration. Another important thing is to make data nominal before trying to run any classification method on it.