MODELING PORTFOLIO FLOWS FOR THE POST-FLOATING TURKISH ECONOMY
Cem SAATÇİOĞLU* Levent KORAP** ABSTRACT
In this paper, a structurally identified vector autoregressive (SVAR) model is constructed to examine the determinants of the portfolio-based capital flows for the Turkish economy. Our estimation results using data from the post-floating period reveal that the “push” factors based on the external developments for the Turkish economy have a dominant role to explain the behavior of the portfolio flows. Furthermore, the domestic real interest rates as a main “pull” factor are found in a negative dynamic relationship with the portfolio flows and such a finding is attributed to that the dynamic course of the portfolio flows should not be related to the excess return possibilities of the real interest structure, but rather they shold be related to the risk considerations of the economic agents, resulted from the negative fundamentals of the economy associated with high risk premiums.
Key Words:Portfolio Flows, SVAR Analysis, Turkish Economy; 1. Introduction
Effects of the capital flows in search of high return possibilities on real or financial assets have been of special interest for the policy makers of both developed and developing countries. The World Economic Outlook published by the International Monetary Fund (2006) reports that the total net private capital flows comprising net direct investment, net portfolio investment, and other long- and short-term net investment flows in emerging markets were about $200 billion for the 1995-97 period, whereas this sum was $337 billion between all the 1998-2004 period. In this period, the net private direct investment indicated a stable long-run path of on average $150 billion per year, but the post-1997 periods of the East Asian financial crisis witnessed that initially a decreasing private portfolio inflows and other capital flows and then an increasing private portfolio and other capital outflows for the 2001-2003 period dominated the emerging markets. But there exists an increase again in
* Associate Professor, Istanbul University, Faculty of Economics, Department of Economics,
**Economist, Marmara University, Institute of Social Sciences, Department of Economics
both the flows of the private direct investment and the portfolio investment for the recent 2004-2006 period yielding about $821 million in total private capital inflows. Thus portfolio investment and other private capital flows have been constituted the most volatile part of the capital flows between developed and developing countries.
The factors that affect the capital flows can be considered in a two different perspectives. The factors that determine the supply of flows to the recipient country are called “push” factors, which emphasize the effects of the external factors on the portfolio flows. On the other side, the “pull” factors are related to the demand for flows by the recipient country. Calvo et al. (1993), Fernandez-Arias (1994), Kim (2000) and Ying and Kim (2001) give support to the “push” factors for both the developed and the developing countries, while Dasgupta and Ratha (2000), Hernández et al. (2001) and Çulha (2006) find the dominance of the “pull” factors over the “push” factors in determining capital flows. Furthermore, Chuhan et al. (1993) and Taylor and Sarno (1997) estimate that both the domestic and the global factors explain the bond and the equity flows to the developing countries.
For the Turkish economy, many empirical papers examine the relationships between the capital flows and the some other main domestic macroeconomic aggregates in different perspectives. Among many others, Agénor et al. (1997) relate the capital flows to the uncovered interest difeentials in the sense that positive shocks to the uncovered interest differentials would lead to the capital inflows, in turn, resulted in appreciation of the real exchange rate. Kirmanoğlu and Özçiçek (1999) try to reveal the effects of the short-term capital flows on the domestic economy. They find that capital inflows appreciates the domestic currency and leads to lower domestic inflation and interest rates and also promotes the domestic growth. Likewise, Celasun et al. (1999) indicates in an extensive paper on the effects of the capital flows experienced by the Turkish economy that capital flows affect the private consumption and investment positively and contributes to the real income growth process. However, the estimation results of Akçoraoğlu (2000) contradicts such an inference and yields no causal relationsips running from the international capital flows to the economic growth for the Turkish economy. Alper and Sağlam (2001) examine the transmission mechanism of the capital outflows considering different perspectives. The results give support to that unanticipated capital outflows give rise to the significant real output loses. Biçer and Yeldan (2002) search for the macroeconomic variables that best explain the behavior of the capital inflows for the Turkish economy. Their empirical results suggest that capital inflows have a significant negative correlation with the
industrial production and trade openness and are positively correlated with the real currency appreciation. They also find that there exists a positive relationship between the stock market and the capital flows. Finally, Çulha (2006) and CBRT (2006) analyze the determinants of the capital flows for the Turkish economy by employing a ‘pull-push’ factors approach. Their empirical findings reveal that the ‘pull’ factors are in general dominant over the ‘push’ factors in determining the capital flows, especially, for the post-2002 period.
In this paper, our aim is to examine the possible determinants of the portfolio-based capital flows based on a wide range of variables for the Turkish economy and to apply a structural vector autoregression model using data from the post-2001 floating exchange rate period1. For this purpose, the preliminary data issues are described in the next section. Section 3 presents unit root test results. Methodological issues are discussed in the fourth section. Section 5 conducts an empirical model for the Turkish economy. The last section summarizes results to conclude the paper.
2. Data
The data for the portfolio flows consist of the sum of the portfolio investments net of assets and liabilities as equity securities and debt securities in millions of US$s. For the “pull” factors, we use the typical country creditworthiness indicators which can be easily observed by the market participants, such as domestic real interest rate, the course of the current account balance and domestic inflation.2 We also included domestic stock return to
compare the stock return differentials between the domestic and the foreign economy in the eyes of the portfolio investors. The domestic real interest rate variable (rdt) represents the difference between the nominal interest rate, which is the maximum rate of interest on the Treasury bills whose maturity are at most twelve months, and the annualized monthly domestic inflation rate based on the consumer price indices (CPI).3 We must note here that we omit the possible data
problems due to using 1987: 100 based price indices for the pre-2003 period and 2003: 100 based price indices for the post-2003 period in calculating the
1 Such a methodology permits us to use a small open economy assumption for the Turkish
economy, so that “pull” factors identified with the domestic macroeconomic aggregates can be affected by the shocks on the “push” based factors as well as by the own shocks, but not vice cersa. For the papers applying to a similar methodology, see Kim (2000) and Çulha (2006).
2 Such a variable specification based on some main creditworthiness indicators can also be
observed in Dasgupta and Ratha (2000), Hernández et al. (2001) and Çulha (2006).
3 For the May 2007, the maturity of the Treasury bond considered is longer than 12-months
monthly inflation rates for the Turkish economy.4 The current account balance
data (curt) in millions of US$s are extracted from the balance of payments statistics. The domestic stock return (eqt) is represented by the monthly logarithmic difference of the Istanbul Stock Exchange ISE-100 National price indices set up for closing prices. For the inflation data (pt) considered by the economic agents, the CPI-based annualized monthly domestic inflation based on past realizations are used. For the “push” factors, the data belong to the US economy and one-year Treasury interest rate (rust), the growth rate of 2002: 100 based industrial production index (indust) and the return on the share price index (equst) are used, for which the latter two variables are assumed as monthly logarithmic difference.
The data indicate seasonally unadjusted values and cover the period from 2001m03 to 2007m06 using monthly frequency observations. The domestic data are taken from the electronic data delivery system of the Central Bank of the Republic of Turkey (CBRT). The US Treasury interest rates and industrial production index data are taken from the electronic data delivery system of the FRB of St. Louis and the US share price index data are from the OECD electronic statistical database. All the variables except the domestic stock return, the growth rate of the US industrial production index and the return on the US share prices are in their linear forms, whereas the latter variables are measured in their natural logarithms.
3. Unıt Root Tests
Following Zivot and Andrews (1992) (henceforth ZA), we apply to the tests for unit roots allowing the data themselves to indicate breakpoints endogenously both in slope and intercept:
k
yt = µ + βt + θDUt(λ) + γDTt*(λ) + αyt-1 +
Σ
cj∆yt-j + εt (1)j=1
Against the alternative hypothesis that any time series yt can be represented by a trend-stationary I(0) process with a breakpoint occuring at some unknown time, the ZA test chooses the breakpoint as the minimum t-value on the autoregressive yt variable, which occurs at time 1 < TB < T leading to λ = TB / T, λ ∈ ⏐0.15, 0.85⏐. In Eq. (1), DUt and DTt are sustained dummy variables capturing a mean shift and a trend shift occuring at the break date respectively, i.e. DUt(λ) = 1 if t > Tλ, and 0 otherwise; DTt*(λ) = t - Tλ if t >
Tλ, and 0 otherwise. ∆ is the difference operator, k is the number of lags determined for each possible breakpoint and εt is assumed to be a stochastic error term with zero mean and constant variance. The ZA method runs a regression for every possible break date sequentially and the time of the structural changes is detected based on the most significant t-ratio for α. To test the unit root hypothesis, the smallest t-values are compared with a set of asymptotic critical values estimated by ZA:
Table 1. Zivot-Andrews unit root test
________________________________________________________________ Variable k min t capt 0 -7.964 rdt 0 -6.844 curt 0 -5.962 eqt 0 -7.458 pt 1 -4.446 rust 1 -3.098 indust 0 -10.768 equst 0 -8.129 ________________________________________________________________
Notes: Estimation with 0.15 trimmed. Lag length is determined by Schwarz’s
Bayesian information criterion. min t is the minimum t-statistic calculated. Critical values for the test are -5.57 (1%) and -5.08 (5%).
The ZA unit root test results in Tab. 1 reject the unit root null hypothesis for all the variables except the domestic inflation and the US Treasury interest rate. Thus, these two variables will be used in the first differenced form while the others will be considered in the level form for modeling purposes.
4. Methodology
Following Blanchard and Quah (1989), consider a structural vector autoregressive (SVAR) model. Ignoring the constant term, assume first the structural form equation below:
B(L)yt = ut (2)
where B(L) is the pth degree matrix polynomial in the lag operator L and p is the number of lagged periods used in the model. B0 is a nonsingular matrix normalised to have ones on the diagonal and summarizes the contemporaneous relationships between the variables in the vector yt. The variance of ut, Λ, is a diagonal matrix where diagonal elements are the variances of structural
disturbances, therefore the structural disturbances are assumed to be mutually uncorrelated. The reduced form VAR with this structural model is:
A(L)yt = εt (3)
where A(L) is a matrix polynomial in the lag operator L, εt is a vector of serially uncorrelated reduced form disturbances, and var(εt) =
Σ
. Considering Eqs. (2) and (3):A(L) = B0-1B(L) = I – A1L – A2L2 - … - APLP (4) and:
εt = B0-1ut (5)
The parameters in the structural form equation and those in the reduced form equation are related by:
A(L) = I – B0-1[B1L – B2L2 - … - BPLP] and
Σ
= B0-1ΛB0-1 (6) The advantage of the SVAR methodology against the unrestricted vector autoregression (UVAR) is to make the researchers cabaple of using theoretical assumptions in empirical models by imposing theoretical as well as atheoretical or auxiliary restrictions to achieve econometric identification issues.5. Results
For empirical purposes, an unrestricted VAR model is constructed upon the Turkish economy, for which the lag length of the model has been estimated as 1 by sequential modified LR statistics employing small sample modification. The model fits well to the data generating process by producing LM(4)=72.46 (probability 0.22), where LM is the 4th order residual serial correlation LM
statistic under the null hypothesis that these exists no serial correlation problem in the model.
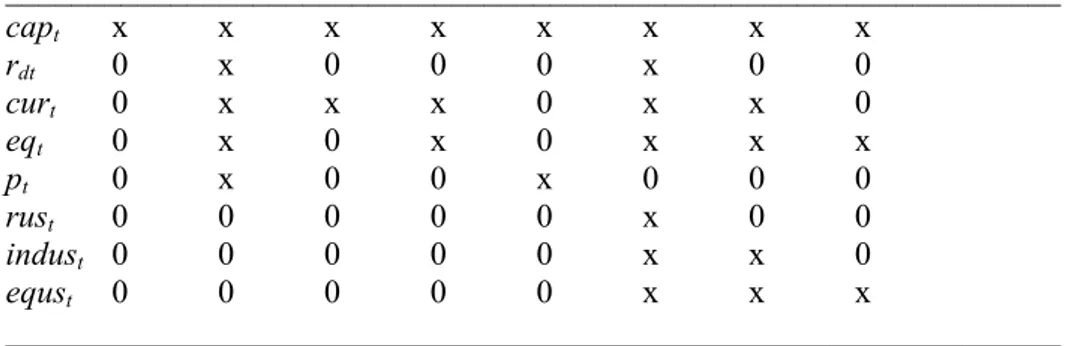
Since the structural shocks cannot be observed directly without imposing identifying restrictions, we apply to the restrictions to identify the “pull” and the “push” based factors following a small open economy assumption for the Turkish economy. In this sense, the US interest rates have been assumed reponsive only to the own shocks leading it to be the most exogenous variable in the system. The growth rate of the US industrial production index is responsive to the US interest rates, while the return on the US share price index is assumed to be affected by the shocks upon the US interest rate and the growth rate of the US industrial production index. The
domestic real interest rate is responsive to the US Treasury interest rate shocks. The current account is assumed to be affected by the shocks upon domestic real interest rate, domestic stock return, the US Treasury interest rate and the growth rate of the US industrial production index. The domestic stock return responds to the shocks upon the domestic real interest rate, the US Treasury interest rate, the growth rate of the US industrial production index and the return on the US share price index. Finally, domestic inflation responds to the domestic real interest shocks. Portfolio flows are assumed to be affected by all the shocks, leading it to be the most endogenous variable in the system. All variables are assumed to be responsive to the own shocks:
Table 2. SVAR long-run response pattern
________________________________________________________________ capt x x x x x x x x rdt 0 x 0 0 0 x 0 0 curt 0 x x x 0 x x 0 eqt 0 x 0 x 0 x x x pt 0 x 0 0 x 0 0 0 rust 0 0 0 0 0 x 0 0 indust 0 0 0 0 0 x x 0 equst 0 0 0 0 0 x x x ________________________________________________________________
Notes: ‘x’ denotes the unrestricted variables.
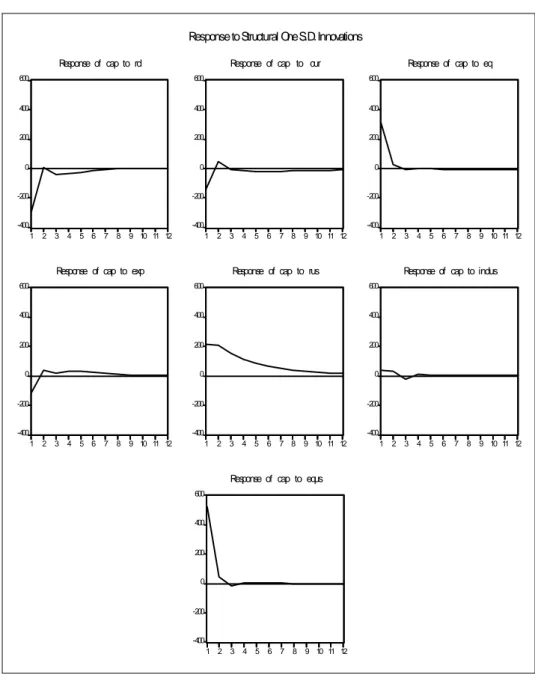
In line with these model construction issues, the impulse-response functions of the portfolio flows are given in Fig. 1 below using 2000 monte carlo repetitions to structural one standard deviation (S.D.) innovations:
-400 -200 0 200 400 600 1 2 3 4 5 6 7 8 9 10 11 12 Response of cap to rd -400 -200 0 200 400 600 1 2 3 4 5 6 7 8 9 10 11 12
Response of cap to cur
-400 -200 0 200 400 600 1 2 3 4 5 6 7 8 9 10 11 12 Response of cap to eq -400 -200 0 200 400 600 1 2 3 4 5 6 7 8 9 10 11 12
Response of cap to exp
-400 -200 0 200 400 600 1 2 3 4 5 6 7 8 9 10 11 12
Response of cap to rus
-400 -200 0 200 400 600 1 2 3 4 5 6 7 8 9 10 11 12
Response of cap to indus
-400 -200 0 200 400 600 1 2 3 4 5 6 7 8 9 10 11 12
Response of cap to equs
Response to Structural One S.D. Innovations
In Fig. 1, we find that the main “pull” based factors that affect the portfolio flows are the domestic real interest rate in a negative way and the domestic stock return in a positive way. A structural one S.D. positive innovation to the domestic real interest rates leads to a nearly $300 million portfolio outflows, while one S.D. positive innovation on the domestic stock return attracts nearly $320 million portfolio inflows. On the other side, both the US Treasury interest rate and the return on the US share prices have significant immediate effects on the dynamic course of the portfolio flows. We find that a one S.D. structurally identified positive shock on the US Treasury interest rate increases the portfolio inflows to the Turkish economy nearly $200 million, and the larger the return on the US share prices, the larger the portfolio flows to the Turkish economy. A structural one S.D. positive innovation to the US share prices leads to a nearly $520 million capital inflow following the shock. The impulse-responses of the other variables take trivial values to affect the portfolio flows. Following the structural factorization of the impulse responses, the variance decomposition results are given below:
Table 3: Variance decomposition of portfolio flows
________________________________________________________________ Percentage of Portflolio Flows Variance due to
Variance capt rdt curt eqt pt rust indust equst Period 1 64.72 5.74 1.28 6.73 0.95 2.97 0.10 17.52 4 61.53 5.53 1.34 6.31 1.04 7.63 0.17 16.44 8 60.79 5.54 1.41 6.24 1.15 8.51 0.18 16.23 12 60.67 5.53 1.44 6.25 1.15 8.58 0.18 16.21 ________________________________________________________________
Variance decomposition analysis indicates that over a period of 12 months, nearly 60% of the forecast error variance of the portfolio flows can be attributed to the own shocks. The results support the impulse response findings in the sense that nearly one-fifth of the forecast error variance of the portfolio flows can be accounted by the shocks on the return of the US share prices, while the US Treasury interest rate explains nearly 9% of the forecast error variance of the portfolio flows after a 12-months forecast horizon. Among the “pull” factors, the domestic real interest rate and the domestic stock return are responsible for nearly 13% of the forecast error variance in a cumulative way. As a result, the “pull” factors explain only 15% of the error variance, however, the “push” based factors are responsible for the 25% of the error variance.
These results reveal the dominant role of the “push” factors over the dynamic course of the portfolio flows. Based on the dynamic impulse response analysis, the course of the portfolio flows should not be attributed to the excess return possibilities of the real interest structure, as frequently emphasized by the commentators of the Turkish economy, but rather they should be related to the risk considerations of the economic agents, resulted from the negative fundamentals of the economy associated with high risk premiums. All in all, the dominance of the “push” factors over the portfolio flows and the negative dynamic relationship between the portfolio flows and the domestic real interest structure will decrease the effectiveness of the discretionary stabilization policies constructed on the domestic macroeconomic aggregates for the Turkish economy.
6. Concludıng Remarks
In this paper, we investigate the roles of the ‘pull’ and the ‘push’ factors on the dynamic course of the portfolio flows experienced by the Turkish economy for the post-floating period. Considering the time period 2001m03-2007m06 with monthly observations, our findings reveal that the “push” factors based on the external developments for the Turkish economy have a dominant role in explaining the behavior of the portfolio flows. Furthermore, the domestic real interest rates as a main “pull” factor are estimated in a negative dynamic relationship with portfolio flows and such a finding is attributed to that the dynamic course of the portfolio flows should not be related to the excess return possibilities of the real interest structure, but rather they shold be related to the risk considerations of the economic agents, resulted from the negative fundamentals of the economy associated with high risk premiums. Of course, complementary papers as a future research should be constructed to examine the sensitivity of the findings obtained in this paper.
ÖZET
DALGALANMA SONRASI TÜRKİYE EKONOMİSİ İÇİN PORTFÖY AKIMLARININ MODELLENMESİ
Bu çalışmada yapısal olarak tanımlanmış bir vektör ardışık bağlanım (SVAR) modeli portföy temelli sermaye akımlarının bileşenlerinin Türkiye ekonomisi için incelenebilmesi amacıyla oluşturulmaya çalışılmıştır. Dalgalanma sonrası döviz kuru döneminden verileri kullanan tahmin sonuçlarımız Türkiye ekonomisi için dışsal gelişmelere dayalı “itici” (push) etkenlerin portföy akımlarının davranışlarının açıklanmasında belirleyici bir işleve sahip olduğunu açığa çıkarmaktadır. Ayrıca,
başlıca “çekici” (pull) bir etken olarak yurt içi reel faiz oranları portföy akımları ile negatif bir devingen ilişki içerisinde bulunmuş ve bu sonuçlar portföy akımlarının devingen yapısının yurt içi reel faiz yapısı tarafından belirlenen aşırı getiri olanaklarından ziyade örneğin yüksek risk primleri ile ilişkilendirilebilecek ekonominin negatif temellerinden kaynaklanan risk algılamaları ile ilişkilendirilmesi gerekliliğine atfedilmiştir.
Anahtar kelimeler: Portfolio Flows; SVAR Analysis; Turkish Economy REFERENCES
AGENOR, P.-R., MCDERMOTT, C.J. and E.M. ÜÇER (1997), “Fiscal
Imbalances, Capital Inflows, and the Real Exchange Rate: The Case of Turkey”, IMF Working Paper, No. 987/1.
AKÇORAOĞLU, A. (2000), “International Capital Movements, External Imbalances and Economic Growth: The Case of Turkey”, Yapı Kredi Economic Review, 11(2), 21-36.
ALPER, C.E. and İ. SAĞLAM (2002), “The Transmission of a Sudden Capital Outflow: Evidence from Turkey”, Eastern European Economics, 39(2), 29-48.
BİÇER, G. and A.E. YELDAN (2002), “Patterns of Financial Capital Flows and Accumulation in the post-1990 Turkish Economy”, Canadian Journal of Development Studies, 24(2), 250-65.
BLANCHARD, O.J. and D. QUAH (1989), “The Dynamic Effects of
Aggregate Demand and Supply Disturbances”, American Economic Review, 79, 655-73.
CALVO, G.A., LEIDERMAN, L. and C.M. REINHART (1993), “Capital Flows and Real Exchange Rate Appreciation in Latin America: The Role of External Factors”, IMF Staff Papers, 40(1), 108-51.
CBRT (2005), Monetary Policy Report, 2005-I. CBRT (2006), Inflation Report, 2006-IV.
CELASUN, O., DENİZER, C., and D. He(1999), “Capital Inflows,
Macroeconomic Management, and the Financial System: The Turkish Case, 1989-97”, World Bank Working Paper, No. 2141.
Flows to Asia and Latin America: The Role of Global and Country Factors”, World Bank Policy Research Working Paper, WPS 1160, July.
ÇULHA, A. (2006), “A Structural VAR Analysis of the Determinants of
Capital Flows into Turkey”, CBRT Research and Monetary Policy Department Working Paper, No. 06/05.
DASGUPTA, D. and D. RATHA (2000), “What Factors Appear to Drive Private Capital Flows to Developing Countries? And How Does Official Lending Respond?”, World Bank Policy Research Working Paper, No. 2392.
FERNANDEZ-ARIAS, E. (1994), “The New Wave of Private Capital Inflows: Push or Pull?”, World Bank Policy Research Working Paper, No. 1312. HERNANDEZ, L., MELLADOI, P. and R. VALDES (2001), “Determinants of
Private Capital Flows in the 1970s and 1990s: Is There Evidence of Contagion?”, IMF Working Paper, 01/64.
INTERNATIONAL MONETARY FUND (2006), World Economic Outlook, September.
KIM, Y. (2000), “Causes of Capital Flows in Developing Countries”, Journal of International Money and Finance, 19, 235-53.
KİRMANOĞLU, H. And Ö. Özçiçek (1999), “The Effect of Short-Term Capital Inflow on the Turkish Economy”, Yapı Kredi Economic Review, 10(1), 27-34.
MISHRA, D., MODY, A., and A.P. Murshid (2001), “Private Capital Flows and Growth”, IMF Finance and Development, 38(2).
TAYLOR, M.P. and L. SARNO (1997), “Capital Flows to Developing
Countries: Long- and Short-term Determinants”, World Bank Economic Review, 11(3), 451-70.
YING, Y.-H. and Y. KIM (2001), “An Empirical Analysis on Capital Flows: The Case of Korea and Mexico”, Southern Economic Journal, 67(4), 954-68.
ZIVOT, E. and D.W.K. ANDREWS (1992), “Further Evidence of Great Crash, the Oil Price Shock and the Unit Root Hypothesis”, Journal of