R.T.
YILDIZ TECHNICAL UNIVERSITY
GRADUATE SCHOOL OF NATURAL AND APPLIED SCIENCES
MONITORING OF LAND SURFACE SUBSIDENCE IN ZONGULDAK COAL
MINING FIELD IN THE NORTHERN TURKEY USING MULTI TEMPORAL SAR
INTERFEROMETRY
SAYGIN ABDİKAN
PHD. THESIS
DEPARTMENT OF GEOMATIC ENGINEERING
PROGRAMME OF REMOTE SENSING AND GIS
SUPERVISOR
ASSIST. PROF. DR. FÜSUN BALIK ŞANLI
R.T.
YILDIZ TECHNICAL UNIVERSITY
GRADUATE SCHOOL OF NATURAL AND APPLIED SCIENCES
MONITORING OF LAND SURFACE SUBSIDENCE IN ZONGULDAK COAL
MINING FIELD AT NORTHERN TURKEY USING MULTI TEMPORAL SAR
INTERFEROMETRY
A thesis submitted by Saygın ABDİKAN in partial fulfillment of the requirements for the degree of DOCTOR OF PHILOSOPHY is approved by the commitee on 26.12.2012 in Geomatics Engineering Department, Remote Sensing and GIS Programme.
Thesis Supervisor
Assist. Prof. Dr. Füsun BALIK ŞANLI Yıldız Technical University
Co- supervisor
Assoc. Prof. Dr. Ziyadin ÇAKIR İstanbul Technical University
Examining Committee Members
Assist. Prof. Dr. Füsun BALIK ŞANLI
Yıldız Technical University _____________________
Prof. Dr. Fatmagül KILIÇ
Yıldız Technical University _____________________
Prof. Dr. Filiz SUNAR
İstanbul Technical University _____________________
Prof. Dr. Zübeyde ALKIŞ
Yıldız Technical University _____________________
Prof. Dr. Cem GAZİOĞLU
The study is supported by Yıldız Technical University in the frame of the Scientific Research Project Coordination with project 28-05-03-02.
FORWORD
This thesis is written in the context of the scientific research project which is supported by Yıldız Technical University to complete the Remote Sensing and GIS PhD program at Geomatics Engineering Department of Yıldız Technical University.
During my research there are many people who have contributed in various ways over the past six years to go further. First and foremost I offer my deepest gratitude to my supervisor Dr. Füsun Balık Şanlı for her valuable comments, perceptive advices and belief during all of the stages. I owe a lot to her being supportive and responsible. Her constant enthusiasm, encouragement and unrequited trust improved me to be a self-confident scientist.
I express my thankfulness to Dr. Ziyadin Çakır for accepting to become my co-supervisor, for the guidance and providing valuable feedback during my research. I wish to thank my colleagues who worked with me at the period of my study at Geomatics Engineering Department of Yıldız Technical University. I also thank to Prof. Dr. Fatmagül Kılıç and Prof. Dr. Filiz Sunar for their advices and encouragement during my study.
I would like to thank Dr. Ramon Hanssen for supervising me and giving me opportunity to make research at the radar group in Delft University of Technology. I am also thankful to Dr. Andy Hooper and the friends from the radar group who gave me thoughtful suggestions during the period of my study at TUDelft.
My special thanks go to Mahmut Arıkan for his supportive advices, sharing his individual experience and giving his time for my unending questions. He always kept me up during my research. I would like to thank NUFFIC Huygens scholarship for supporting me for my research in TUDelft in the Netherlands. I extend thanks to Dr. Hüseyin Kemaldere from Bülent Ecevit University, who shared much information about the study area.
A special thank goes to Asude Arslan Sorensen for her friendship, endless support and presence. She always gave constructive criticism and suggestions to my all complain which kept my motivation up.
I am very grateful to my friends Mustafa Yaşar, Bilgiseven Vurdu, Merve Elma, Gökhan Özen, Mesut Kondu, Duygu Pınar Marçalı Doğru and Petek Tatlı for their friendship,
sharing and presence. I wish to thank Smiljan Grubešić for his understanding, sharing and support.
Last but not least, many thanks to my parents and my sister Saydam who gave me great support, help and understanding during my study.
September, 2012
vi
TABLE OF CONTENTS
Page
LIST OF SYMBOLS ... ix
ABBREVIATIONS ... xi
LIST OF FIGURES ... xiii
LIST OF TABLES ... xvii
ABSTRACT ... xviii
ÖZET ... xxi
CHAPTER 1 ... 1
INTRODUCTION ... 1
1.1 Literature Review ... 1
1.2 Aim of the Thesis ... 5
1.3 Hypothesis ... 6
CHAPTER 2 ... 9
RADAR INTERFEROMETRY: BACKGROUND ... 9
2.1 Synthetic Aperture Radar... 9
2.1.1 Properties of SAR Image ... 13
2.1.2 Distortions in SAR Images ... 16
2.1.3 Satellite Acquisitions ... 17
2.2 InSAR Principles ... 21
2.2.1 InSAR Geometry ... 22
2.3 Deformation Monitoring by DInSAR ... 23
2.3.1 Topographic Phase Contribution ... 24
vii
2.3.3 Orbit ... 25
2.3.4 Surface Deformation ... 25
2.3.5 Sources of Decorrelation in InSAR ... 26
CHAPTER 3 ... 29
METHODOLOGY OF INSAR PROCESSING ... 29
3.1 Multi Temporal Time Series with InsAR Analysis ... 29
3.1.1 Persistent Scatterer Interferometry of StaMPS ... 30
3.1.2 Small Baseline Interferometry of StaMPS ... 32
CHAPTER 4 ... 34
SUBSIDENCE IN ZONGULDAK COAL MINE AREA ... 34
4.1 Study area ... 34
4.1.1 Geological Background ... 37
4.2 Coal Mining Activities in Zonguldak ... 40
4.2.1 Definition of Problem ... 46
4.2.2 Formation of Mining Subsidence ... 52
4.2.3 Prior Subsidence Studies at Zonguldak Mine ... 54
CHAPTER 5 ... 55
MULTI TEMPORAL INSAR OBSERVATIONS RESULTS ... 55
Available SAR Dataset ... 55
5.1 5.1.1 ERS Data Acquisitions ... 57
5.1.2 ENVISAT/ASAR Data Acquisitions ... 57
5.1.3 ALOS/PALSAR Data Acquisitions ... 58
ERS Multi Temporal InSAR Results... 59
5.2 5.2.1 ERS PSI Processing ... 59
5.2.2 ERS SB Processing ... 60
5.2.3 ERS PSI-SB Comparison ... 61
ENVISAT Multi Temporal InSAR Results... 66
5.3 5.3.1 ENVISAT Descending PSI ... 66
5.3.2 ENVISAT Descending SB ... 67
5.3.3 ENVISAT Descending PSI-SB Comparison ... 67
5.3.4 ENVISAT Ascending PSI ... 72
viii
5.3.6 ENVISAT Ascending PSI-SB Comparison ... 73
PALSAR Multi Temporal InSAR Results ... 78
5.4 5.4.1 PALSAR PSI Processing ... 78
5.4.2 PALSAR SB Processing ... 79
5.4.3 PALSAR PSI-SB Comparison... 79
PSI Results Versus SB Results ... 84
5.5 CHAPTER 6 ... 98
RESULTS AND DISCUSSION ... 98
REFERENCES ... 103
APPENDIX-A ... 111
FLOWCHART OF RESEARCH STUDY... 111
APPENDIX-B... 112
INSAR PAIRS GENERATED WITH SB APPROACH ... 112
APPENDIX-C ... 120
STANDARD DEVIATIONS OF RESULTS ... 120
APPENDIX-D ... 122
INTERSECTION OF RESULTS ... 122
APPENDIX-E ... 124
CONTRIBUTION PHASES ... 124
ix
LIST OF SYMBOLS
A1, A2 Amplitudes of two epochs for the same pixel
A12 Interferometric amplitude
B Baseline
Bcrit Critical baseline
Bd Bandwitdh
BDop Doppler bandwidth
Bw Beam width B⊥ Perpendicular baseline B∥ Parallel baseline c Speed of light Cp Complex pixel D Antenna width
DA Amplitude dispersion index
D∆A Amplitude difference dispersion index
fD Doppler frequency
fDC Doppler centroid frequency
h Mean height of surface roughness feature hA Altitude of ambiguity
H Altitude of satellite Hp Height of target P
L RADAR antenna length p,p’ Target points on the ground PD slant range deformation
PN Power of the noise
PS Power of received signal
R Range
R1 Range of first acquisition
R2 Range of second acquisition
Rf Far slant range
Rm Middle slant range
Rn Near slant range
S1 Complexmaster image
S2 Complexslave image
x vs Platform velocity
α Orientation angle of the baseline
βa Width of azimuth beam of the radar antenna
γ Coherence
γDC Doppler centroid decorrelation
γT Thermal decorrelation
ΔAg Ground azimuth resolution
ΔfDC Doppler centroids between master and slave images
ΔR Range difference of two SAR acquisitions ∆Rg Ground range reolution
η Incidence angle
θ Look angle
λ Wavelenght
μA Mean of SAR amplitude images
Topographic slope
σA Standard deviation of the amplitude image
σ∆A Standard deviation of master and slave difference in amplitude
τp Pulse duration Φ Phase difference
Φ1, Φ2 Phase components of two epochs for the same pixel
Φatm Phase delay due to atmosphere
Φdef Phase change due to surface deformation
Φorb Orbital errors
Φn Phase noise
Φtopo Phase contribution of topography
ψ Depression angle ωs Squint angle
xi
ABBREVIATIONS
ALOS Advanced Land Observing Satellite
ASAR Advanced SAR
ASI Agenzia Spaciole Italiana (Italian Space Agency) AVNIR Advanced Visible and Near Infrared Radiometer
COSMO-SkyMed Constellation of small Satellites for Mediterranean basin Observation
CDTI Centro para el Desarrollo Tecnologico Industrial CONAE Comision Nacional de Actividades Espaciales
CSA Canada Space Agency
DEM Digital Elevation Modeling
DInSAR Differential SAR Interferometry
DLR Deutschen Zentrums für Luft- und Raumfahrt
DORIS Delft Object-Oriented Radar Interferometric Software ENVISAT Environmental Satellite
ERS European Remote Sensing
ESA European Space Agency
FDB Fine Dual Beam
FSB Fine Single Beam
GMES Global Monitoring for Environment and Security
GPS Global Positioning System
INSAR Interferometric Synthetic Aperture Radar
JERS Japanese Earth Resources Satellite
JAXA Japan Aerospace Exploration Agency
LOS Line of Sight
MAPSAR Multi Application Purpose SAR
MDA MacDonald, Dettwiler and Associates
MTA Maden Tetkik ve Arama (Mineral Research and Exploration) NASA National Aeronautics and Space Administration
PALSAR Advanced Land Observing Satellite PSI Persistent Scatterers Interferometry RADAR Spaceborne Radio Detecting and Ranging
RAR Real Aperture Radar
ROI_PAC Repeat Orbit Interferometry Package
xii
SB Small Baseline
SBAS Small Baseline Subset
SEOSAR Satélite Español de Observación SAR
SLR Side Looking Radar
SLAR Side Looking Airborne Radar
SLC Single Look Complex
SIR Shuttle Imaging Radar
SRTM Shuttle Radar Topography Mission
StaMPS Stanford Method for Persistent Scatterers
TCBMA Turkey Coal Basin Management Agency
TCE Turkish Coal Enterprises (Türkiye Taşkömürü Kurumu-TTK)
xiii
LIST OF FIGURES
Page
Figure 2. 1 Electromagnetic spectrum (ESA, [39]) ... 9
Figure 2. 2 Geometry of RAR (adapted from Cakir [40] and Wright [41]) ... 10
Figure 2. 3 a)Range resolution, b)Azimuth resolution (adapted from Cakir [40] and Wright [41]) ... 11
Figure 2. 4 SAR geometry (adapted from Cakir [40]) ... 12
Figure 2. 5 Influence of wavelengths on objects (ESA, [45]) ... 15
Figure 2. 6 Geometrical distortions in SAR images where F: Foreshortening, L: Layover, S: Shadow (adapted from Sousa [48]) ... 16
Figure 2. 7 InSAR Geometry ... 22
Figure 2. 8 Repeat-pass DInSAR geometry (adapted from Sousa [48]) ... 25
Figure 3. 1 a) Distributed scatterers that contribute to the phase in one pixel b) dominant PS in one pixel (Hooper [65]) ... 31
Figure 3. 2 a) Flowchart of StaMPS steps (adapted from Sousa [48] and Hooper [66]) . 31
Figure 4. 1 Study area [73] ... 35
Figure 4. 2 Weather conditions of Zonguldak (adapted from Turkish State Meteorological Service [75]) ... 35
Figure 4. 3 DEM of Zonguldak city center ... 36
Figure 4. 4 Slope of the study area... 36
Figure 4. 5 Aspect of the study area ... 37
Figure 4. 6 Stratigraphic section of the study area (adapted from [36], [79], [80]) .. 38
Figure 4. 7 The geological map of the Zonguldak city (adapted from [36]) ... 38
Figure 4. 8 Caves of Zonguldak (Bülent Ecevit University, [83]) ... 39
Figure 4. 9 Zonguldak coal basin (TCE, [73]) ... 40
Figure 4. 10 Coal production of TTK in Zonguldak Province between 1941 and 2011 (TCE,[85])... 41
xiv
Figure 4. 12 Location of mining tunnels at the study area of Zonguldak showed on 20070724 dated panchromatic Landsat-ETM image (15 m ground
resolution)... 44
Figure 4. 13 Mine galleries in Kozlu (Background optical image is GoogleEarth) ... 45
Figure 4. 14 Mine galleries in Karadon (Background optical image is GoogleEarth) 45 Figure 4. 15 Mine galleries in Üzülmez (Background optical image is GoogleEarth) 46 Figure 4. 16 a-Deformations on building (Turer et al. [78]) and b-Deformations on ground (Can et al. [34])... 47
Figure 4. 17 Reserves in Zonguldak center ... 48
Figure 4. 18 a) No of dead per year and coal production, b) No of injures per year and coal production (TCE,[86])... 49
Figure 4. 19 Landslide map of Zonguldak province (Turer et al. [78]) ... 50
Figure 4. 20 Relationship between width of coal seam and the surface subsidence (Bauer [93])... 52
Figure 4. 21 Subsidence at flat coal seam (adapted from Kutoğlu et al [91], Can et al. [94]) ... 53
Figure 4. 22 Subsidence at slopped coal seam (τ1 and τ2 are the slopes of the coal seam, τ0 is the slope where subsidence is maximum) (Adapted from Can et al. [94]) ... 53
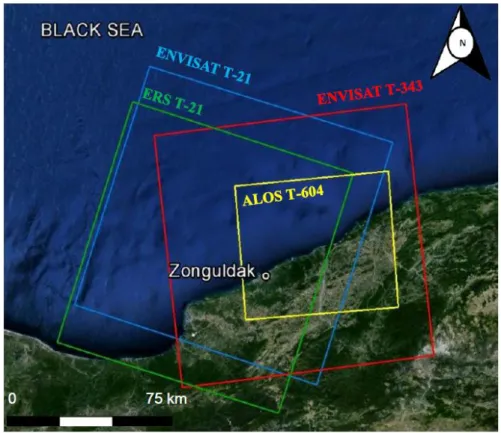
Figure 5. 1 Available SAR data frames which cover the study area Zonguldak ... 56
Figure 5. 2 ERS descending orbit track 21 ... 57
Figure 5. 3 ENVISAT-ASAR descending orbit track 21 ... 58
Figure 5. 4 ENVISAT-ASAR ascending orbit track 343 ... 58
Figure 5. 5 ALOS-PALSAR ascending orbit track 604 ... 59
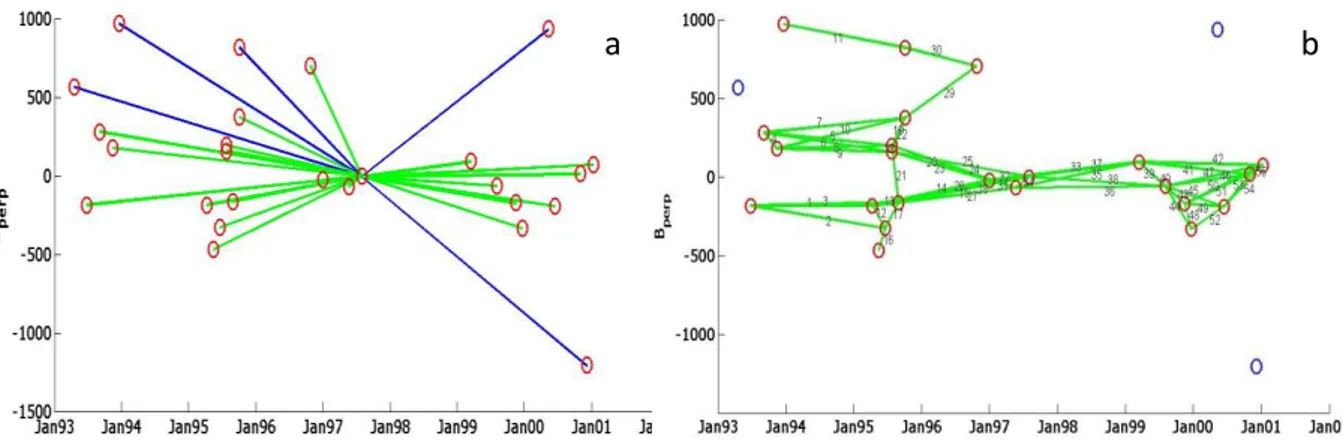
Figure 5. 6 Perpendicular baselines relative to 19970730 of ERS dataset a) PS baselines b) SB baselines ... 61
Figure 5. 7 ERS PSI and SB subsidence results along LOS from 1993 to 2001 ... 62
Figure 5. 8 Profile at Kozlu on ERS a) PS result, b) SB result; at Karadon c) PS result, d) SB result; at Üzülmez e) PS result, f) SB result ... 64
Figure 5. 9 Time series analysis from descending ERS for the regions Kozlu a) PSI results, b) SB results; Karadon c) PSI results, d) SB results; Üzülmez e) PSI results, f) SB results ... 65
Figure 5. 10 Perpendicular baselines relative to 20050817 of ENVISAT descending dataset a) PSI baselines b) SB baselines ... 68
Figure 5. 11 ENVISAT descending track PSI and SB subsidence results along LOS from 2003 to 2010 ... 69
xv
Figure 5. 12 Profile at Kozlu on descending ENVISAT a) PS result, b) SB result; at Karadon c) PS result, d) SB result; at Üzülmez e) PS result, f) SB result 70 Figure 5. 13 Time series analysis from descending ENVISAT for the regions Kozlu a)
PSI results, b) SB results; Karadon c) PSI results, d) SB results ... 71 Figure 5. 14 Time series analysis from descending ENVISAT for the regions Üzülmez a) PSI results, b) SB results; c) Area-1; d) Area-2 ... 72 Figure 5. 15 Perpendicular baselines relative to 20050804 of ENVISAT ascending
dataset a) PSI baselines b) SB baselines ... 73 Figure 5. 16 ENVISAT ascending track PSI and SB subsidence results along LOS from
2004 to 2010 ... 75 Figure 5. 17 Profile at Kozlu on ascending ENVISAT a) PS result, b) SB result ... 75 Figure 5. 18 a) Profile at Karadon on ascending ENVISAT a) PS result, b) SB result; at
Üzülmez c) PS result, d) SB result ... 76 Figure 5. 19 Time series analysis from ascending ENVISAT for the regions Kozlu a)
PSI results, b) SB results; Karadon c) PSI results, d) SB results; Üzülmez e) PSI results, f) results ; g) Area-3; h) Area-4 ... 77 Figure 5. 20 Perpendicular baselines relative to 20080723 of PALSAR ascending
dataset a) PSI baselines b) SB baselines ... 79 Figure 5. 21 PALSAR ascending track PSI and SB subsidence results along LOS from
2007 to 2010 ... 81 Figure 5. 22 Profile at Kozlu on ascending PALSAR a) PS result, b) SB result; at
Karadon c) PS result, d) SB result; at Üzülmez e) PS result, f) SB result 82 Figure 5. 23 Time series analysis from ascending PALSAR for the regions Kozlu a) PSI results, b) SB results; Karadon c) PSI results, d) SB results; Üzülmez e) PSI results; f) SB results; g) Cave ; h) Üzülmez maksimum ... 83 Figure 5. 24 Effects of baselines on ascending PALSAR coherence images ... 85 Figure 5. 25 Relationship between width of coal seam and surface subsidence
(Bauer [93])... 85 Figure 5. 26 Saturated PSI results shows the velocity along LOS direction with
mining galeries on the city of Kozlu: a- Desc. ERS 1-2, b- Desc. ENVISAT, c-Asc. ENVISAT, d- Asc. PALSAR ... 87 Figure 5. 27 Saturated SB results shows the velocity along LOS direction with mining galeries on the city of Kozlu: a- Desc. ERS 1-2, b- Desc. ENVISAT, c-Asc. ENVISAT, d- Asc. PALSAR ... 88 Figure 5. 28 Saturated results shows the velocity along LOS direction with mining
galeries on the Karadon: a) PSI of Asc. PALSAR, b) SB of Asc. PALSAR . 89 Figure 5. 29 Saturated results shows the velocity along LOS direction with mining
xvi
c) PSI of Desc. ENVISAT, d) SB of Desc. ENVISAT, e) PSI of Asc. ENVISAT,
f) SB of Asc. ENVISAT ... 90
Figure 5. 30 Relationship between width of coal seam and surface subsidence (Bauer [93])... 91
Figure 5. 31 Saturated results show the velocity along LOS direction with mining galeries on the Üzülmez : a) PSI of Asc. PALSAR, b) SB of Asc. PALSAR 22 Figure 5. 32 Saturated results shows the velocity along LOS direction on Catalagzi which is located in potential subsidence area: a) PS of Asc. ERS, b) SB of Desc. ERS, c) PSI of Desc. ENVISAT, d) SB of Desc. ENVISAT, e) PSI of Asc. ENVISAT, f) SB of Asc. ENVISAT ... 93
Figure 5. 33 Saturated results shows the velocity along LOS direction on Catalagzi which is located in potential subsidence area: a) PSI of Asc. PALSAR, b) SB of Asc. PALSAR ... 94
Figure 5. 34 Landslide regions acquired from MTA ... 95
Figure 5. 35 Landslide area at Zonguldak city overlaped with C-band results...96
Figure 5. 36 Landslide area at Zonguldak city overlaped with L-band results... 97
Figure 5. 37 Profiles over landslide area from A to B; a) PSI results, b) SB results ... 98
Figure A. 1 Flowchart of research study ... 111
Figure A. 2 Standard deviations; a)ERS PSI result, b) ERS SB result, c) Desc. ENVISAT PSI result, d) Desc. ENVISAT SB result ... 120
Figure A. 3 Standard deviations; a)Asc. ENVISAT PSI result, b) Asc. ENVISAT SB result, c) PALSAR PSI result, d) PALSAR SB result ... 121
Figure A. 4 Common points of PSI and SB results: a) ERS, b) ENVISAT t-343...122
Figure A. 5 Common points of PSI and SB results: a) ENVISAT t-21, b) PALSAR....123
Figure A. 6 DEM error removed from phase; a)ERS PSI result, b) ERS SB result, c) Desc. ENVISAT PSI result, d) Desc. ENVISAT SB result ... 124
Figure A. 7 DEM error removed from phase; a)Asc. ENVISAT PSI result, b) Asc. ENVISAT SB result, c) PALSAR PSI result, d) PALSAR SB result ... 125
Figure A. 8 Atmosphere and orbital error of master image (20080723) which is included in all interferograms in PSI process. ... 125
Figure A. 9 Unwrapped phase of PALSAR images in PSI application... 126
Figure A. 10 Orbit errors of PALSAR images in PSI application ... 126
Figure A. 11 Atmospheric phase of PALSAR images in PSI application ... 127
Figure A. 12 DEM error and orbit phase removed unwrapped phase of PALSAR images in PSI application ... 127
Figure A. 13 DEM error, atmospheric and orbit phase of slave images and master image removed unwrapped phase of PALSAR images in PSI application 128
xvii
LIST OF TABLES
Page Table 1. 1 Summarized studies on deformation monitoring at coal mining using
multi temporal InSAR...4
Table 2. 1 SAR bands with frequency and wavelength [46]... 15
Table 2. 2 Characteristics of SAR missions (adapted from [43], [44], [49], [50], [51], [52], [53])... 19
Table 4. 1 Population growth of Zonguldak and Turkey [76]... 37
Table 4. 2 Reserves of Zonguldak coal basin (tonnes) (TCE, [73])... 43
Table 4. 3 Discharged waste water amounts of mining operations (TCE, [73])... 50
Table 4. 4 Previous subsidence monitoring studies on Zonguldak... 54
Table 5. 1 Specifications of available dataset... 56
Table 5. 2 Specifications of ASAR image swaths (ESA, [98])... 57
Table 5. 3 Specifications of PALSAR image modes... 59
Table 5. 4 ERS data used in PSI approach... 60
Table 5. 5 ENVISAT descending data used in PSI approach... 66
Table 5. 6 ENVISAT ascending data used in PSI approach... 73
Table 5. 7 PALSAR ascending data used in PSI approach... 78
Table 5. 8 Summary of results... 84
Table 5. 9 Maksimum velocities estimated over study area... 86
Table 5. 10 Extracted points in Kozlu... 87
Table 5. 11 Common point list in the processes... 95
Table A. 1 ERS Pairs used in SB approach... 109
Table A. 2 ENVISAT descending pairs used in SB approach...111
Table A. 3 ENVISAT ascending pairs used in SB approach... 113
v
ABSTRACT
MONITORING OF LAND SURFACE SUBSIDENCE IN ZONGULDAK COAL
MINING FIELD IN THE NORTHERN TURKEY USING MULTI TEMPORAL SAR
INTERFEROMETRY
Saygın ABDİKAN
Department of Geomatics Engineering PhD. Thesis
Supervisor: Assist. Prof. Dr. Füsun BALIK SANLI Co- supervisor: Assoc. Prof. Dr. Ziyadin ÇAKIR
This thesis examines the availability of finding out the ground surface deformation which occur in long time period with slow displacements by using multi temporal satellite SAR images. A case study is applied on Zonguldak underground coal mine areas using two techniques as Persistent Scatterers Interferometry (PSI) and Small Baseline (SB). The results of these techniques are compared and discussed.
In Turkey Zonguldak and Bartın provinces are the only mining area that underground hardcoal mine is produced. This mine has a national economy vauable especially for at iron-steel industry and energy production. Mining activities have been started in the mid-19th. Century and is still active at five regions under Turkish Coal Enterprises (Türkiye Taşkömürü Kurumu - TTK) auditing. These mining are namely Kozlu, Karadon, Üzülmez and Armutçuk which are located in Zonguldak province, and Amasra mine region which is located in Bartın province.
In this region mining has been continued more than 150 years and during this period approximately 400 million ton hardcoal is produced. Constant and dense production of coal mine caused subsidence at the surface of mine region. However, settlements and environment are suffered due to mining where urbanization is located on. This
vi
situation effected negatively human life as life losses. It also effected people economically as many buildings became useless and people lost their properties. Furthermore, in this region many landslide hazard is happening and also sinkholes occur resulting from having karstic properties at the geological structure. Additionally these mining activities trigger the natural hazards and increase the vulnerability. In last years the amount of coal mine production has been decreased and due to this fact government aimed to increase the production. New reserve survey was complited up to -1200 m from the surface by TTK. An amount of 1.3 billion tone reserve of coal was disclosured by the end of 2011.
In this study coal mines in Zonguldak city as Kozlu, Karadon and Üzülmez regions are chosen as study area to investigate the deformation which occured in long time period. Kozlu mining is the first mining area and also is the only mine where production is continued under sea. Coal production is processed at different levels under the surface in these three mines. Production is continued under surface level as -630 m, -540 m and -250 m deep in Kozlu, Karadon and Üzülmez respectively.
The investigation is concerned on the behalf of to address these facts:
a) Residential areas are under a significant danger because of constant surface subsidence
b) Long term subsidence phenomena has not been monitored before. Previous techniques are used for short terms and have not been used for all mining areas. It is aimed to find out the deformation which occur both in urban and rural areas.
c) InSAR technique gives a golden opportunity to monitor deformation which happend in long time period and also provide analysis of evolution of displacement in time. For these purposes 33 C-band satellite SAR images of ERS-1 and ERS-2 are acquired between 1993 and 2001 years. Also C-band 29 descending ENVISAT images are acquired between 2003 and 2010, and 17 ascending ENVISAT images are gathered between 2004 and 2010. Moreover, 23 L-band ALOS/PALSAR SAR images are acquired for the long term InSAR analyses between 2007 and 2010. PSI and SB approaches are applied for all these four dataset.
PSI and SB approaches are applied for all these four dataset. For the PSI approach in each data set one image is chosen as master and interferograms are computed with this master image. For the SB processes all images are matched each other to compute interferograms. In SB applications InSAR pairs are computed with a threshold of temporal and geometrical baselines. Deformations are determined as mm/year. As an result it is find out that subsidence pattern at Kozlu is monitored with all ERS, ENVISAT and PALSAR processes. Results have consistency with previous DInSAR results. In the results of ERS and ENVISAT deformation is more clear at urbanized part of Kozlu city over the mine. Also at Karadon and Üzülmez deformation is identified with less dense pattern. PALSAR results gave dense deformation pattern both at urbanized Kozlu and at rural Karadon and Üzülmez. PSI results identified more points than SB results in all applications. Higher deformation is monitored in SB results at rural areas.
In this study surface subsidence caused by underground hardcoal mining at Zonguldak region is investigated. For this intention multi-temporal and multi-track satellite SAR
vii
images are acquired. The evolution of subsidence phenomena for 17 years is revealed with InSAR method. Beside subsidece and potential subsidence areas which were identified by TTK new areas where deformation is monitored are found out. It is obvious that this region requires continuous monitoring. In conclusion, a footer information was prepared which can be useful for further risk analyses researches.
Key words: InSAR, surface subsidence, multi temporal SAR, time series, coal mining
YILDIZ TECHNICAL UNIVERSITY GRADUATE SCHOOL OF NATURAL AND APPLIED SCIENCES
viii
ÖZET
ZONGULDAK MADEN ALANLARINDA MEYDANA GELEN YÜZEY
HAREKETLERİNİN ÇOK ZAMANLI SAR İNTERFEROMETRİ YÖNTEMİ İLE
İZLENMESİ
Saygın ABDİKAN
Harita Mühendisliği Anabilim Dalı Doktora Tezi
Tez Danışmanı: Yrd. Doç. Dr. Füsun BALIK SANLI Eş Danışman: Doç. Dr. Ziyadın ÇAKIR
Bu çalışmada uzun zaman aralığında yavaş hareketlerle oluşan yüzey deformasyonun belirlenmesi amacıyla çok zamanlı uydu SAR görüntülerinin kullanılabilirliği iki farklı yöntem ile karşılaştırmalı olarak Zonguldak maden alanları üzerinde incelenmiştir. Uygulamada sabit saçıcı (Persistent Scatterers Interferometry: PSI) ve kısa baz (Small Baseline: SB) yöntemleri incelenmiştir.
Zonguldak ve Bartın illerini kapsayan maden alanı Türkiye’ de ki tek yer altı taşkömürü madeninin çıkarıldığı alandır. Bu maden özellikle demir-çelik sanayisinde ve enerji üretiminde kullanıldığı için ulusal ekonomik değere sahiptir. Bölgede ki madencilik aktiviteleri 19 yy. ortalarında başlamış olup şu an Türkiye Taşkömürü Kurumu (TTK) tarafından beş alanda aktif bir şekilde taşkömürü üretilmeltedir. Bunlardan Kozlu, Karadon, Üzülmez ve Armutçuk müesseseleri Zonguldak ili içinde, Amasra müessesesi Bartın ili içerisinde kalmaktadır.
150 yıldan fazla bir süredir yapılan madencilik faaliyetleri sonucu yaklaşık olarak 400 milyon ton taşkömürü üretilmiştir. Sürekli ve büyük miktarlarda çıkarılan kömür sonucu maden yüzeyinde çökmeler olduğu gözlenmiştir. Ancak sehirleşmenin de kömür maden alanı üzerinde ve çevresinde olması burada bulunan yapılara zarar vererek insan
ix
hayatını olumsuz yönde etkilemiştir. Pek çok can kaybı yanında binalar oturulamaz hale geldiği için binalar boşaltılmış ve mal kayıpları yaşanmıştır.
Ayrıca bölgede sürekli toprak kayması yaşanmakta bununla birlikte jeolojik yapısında karstik ögelerin bulunması obrukların oluşmasına neden olmaktadır. Bunlara ek olarak madencilik aktiviteleri doğal afetleri tetikleyerek zarar görebilirliğini artırmaktadır. Son yıllarda çıkarılan maden miktarının azalması nedeniyle daha çok maden çıkarılması planlanmış, bu amaçla -1200 m kota kadar kömür rezerv araştırmaları sürdürülmüştür. Bu inceleme sonucunda tüm alanda TTK tarafından 2011 yılı itibari ile 1.3 milyar ton kömür rezervi olduğu belirtilmiştir.
Uzun süreli yüzey deformasyonunun belirlenmesi amacıyla Zonguldak şehir merkezinde bulunan üç alan olan Kozlu, Karadon ve Üzülmez maden alanları çalışma alanı olarak seçilmiştir. Kozlu müessesesi Türkiye’de madencilik faaliyetlerinin başladığı ilk ve deniz altında sürdürülen tek işletmedir. Her işletmede farklı kotlarda üretim yapılmaktadır. Kozlu, Karadon ve Üzülmez’de sırasıyla maksimum -630 m, -540 m ve -250 m de üretim gerçekleştirilmektedir.
Bu çalışmanın gerçekleşmesinde şu etkenler öncü olmuştur:
a) Bölgedeki sürekli çökmeler nedeniyle yerleşim varlığı büyük bir tehlike altındadır b) Çökmeler sürekli olarak herhangi bir yöntem ile izlenmemektedir. İzlenen yöntemler kısa zaman aralıklı çalışmalardır ve her maden alanı için uygulanmamıştır. Hem sehir alanları hem de kırsal alanlarda meydana gelen deformasyonun belirlenmesi amaçlanmıştır.
c) InSAR yöntemi ile uzun zaman aralığında meydana gelen deformasyonun zamansal gelişiminin detaylı bir şekilde incelenebilirliği.
Bu çalışmada C-band ERS-1 ve ERS-2 uydularına ait 1993-2001 yılları arasında elde edilmiş 33 SAR görüntüsü, yine C-band ENVISAT uydusuna ait 2003-2010 yılları arasında alçalan yönde alınmış 29 ve 2004-2010 yılları arasında yükselen yönde alınmış 17 SAR görüntüleri kullanılmıştır. Ayrıca 2007-2010 yılları arasında alınmış 23 L-band ALOS/PALSAR SAR uydu görüntüleri analiz edilmiştir.
Dört veri seti için hem PSI hem de SB uygulaması gerçekleştirilmiştir. PSI uygulamasında seçilen ana (master) görüntüye diğer görüntüler eşleştirilerek interferogramlar oluşturulmuştur. SB uygulamasında ise zamansal ve dik baz uzunluklarının kısa tutulması göz önüne alınarak her görüntü birbiriyle eşleştirilerek interferogramlar üretilmiştir. Deformasyon hızları mm/yıl olarak belirlenmiştir. Araştırma sonucunda Kozlu’da ki çökme şekli ERS, ENVISAT ve PALSAR sonuçlarının hepsinde gözlenmiştir. Daha önce yapılan kısa süreli DInSAR çalışmaları ile örtüşmektedir. ERS ve ENVISAT sonuçlarında deformasyon yerleşimin yoğun olduğu Kozlu bölgesinde daha belirginken Karadon ve Üzülmez bölgelerinde daha seyrektir. PALSAR sonuçlarında ise hem yerleşim yeri olan Kozlu’da hem de kırsal alan olan ve çevrenin ormanlık alanla kaplı olduğu Karadon ve Üzülmez bölgelerinde yoğun bir şekilde ortaya çıktığı gözlenmiştir. PSI sonuçlarında daha fazla nokta olmasına rağmen deformasyon hızı SB sonuçlarına göre düşüktür. Ayrıca SB sonuçlarında kırsal alanda daha yüksek yüzey hareketi olduğu gözlenmiştir.
x
Bu çalışmada çok zamanlı ve çok izde alınmış SAR uydu görüntüleri Zonguldak yeraltı taşkömürü maden alanında meydana gelen yüzey hareketlerinin araştırılması için izlenmiştir. Çökmelerin 17 yıllık gelişimi çok zamanlı InSAR sonuçları ile ortaya çıkarılmıştır. TTK tarafından belirlenen çökme ve potansiyel çökme alanları dışında da yüzey hareketi gözlenmiştir. Bu nedenle bölgenin sürekli izlenmesinin gerekliliği açıktır. Sonraki araştırmalarda risk analizleri için kullanılabilecek altlık bir çalışma gerçekleştirilmiştir.
Anahtar Kelimeler: InSAR, yüzey hareketi, çok zamanlı SAR, zamansal analiz, kömür
madenciliği
1
CHAPTER 1
INTRODUCTION
1.1 Literature Review
Since the launch of the first satellite for earth observation, remote sensing data became an essential source of geospatial information. Remote sensing provides to cover large ground surface which makes it valuable as economical and shareable for wide range of environmental interdisciplinary applications. It helped to measure and to understand natural hazards and disasters, and facilitate human being on risk assessment, disaster management and sustainable management. The Earth is dynamic due to having constantly moving ground surface. Numerous phenomena like subsidence, earthquake, volcanic activities, flooding and landslides cause significant surface deformations. Human activities as oil, gas or mine extraction, and excessive usage of water can trigger surface deformation. Ground subsidence which is associated with underground mining activities becomes more serious in Zonguldak settlement, Turkey. Mining based continuous collapses cause loss of life and many other physical problems such as building and road damage. Thus, it is a very serious hazard that government, mining industry and environment are effected (Ng et al, [1]). The subsidence caused by mining where the urban grew over wide areas. The necessity to observe the mining area is come out due to the continues collapses and deaths that happened last decade [International Social Security Association, 2].
Repeat-pass Synthetic Aperture Radar (SAR) interferometry (InSAR) is known as a significant geodetic technique to measure the ground deformation of large scale areas. The main advantage of using InSAR is the ability to access long period data archive.
2
Differential SAR Interferometry (DInSAR) is used to estimate small-scale movements (at mm-cm accuracy) that occur along the viewing direction (Gens and van Genderen, [3]). It has been achieved for many applications such as deformation estimation of volcanoes (Briole et al. [4]), glacier movements (Goldstein et al. [5]), surface deformation analysis (Manzo et al. [6]), Digital Elevation Modeling (DEM) (Small [7]), and the monitoring of earthquakes (Massonnet et al. [8]), landslides (Fruneau et al. [9], Squarzoni et al. [10]), and subsidence (Strozzi et al. [11]). On the other hand, because of the loss of coherence depending on temporal decorrelation, spatial decorrelation due to large baseline geometry, and changing atmospheric conditions during data acquisition, the information cannot always be extracted. To overcome these limitations of repeat-pass SAR interferometry, the technique of persistent scatterer interferometry (PSI) method is proposed by several groups (Ferretti et al. [12], Werner et al. [13], Hooper et al. [14]; Kampes [15]). This method uses a stack of differential interferograms that belongs to one master image and extracts time-coherent pixels. The PS pixels were extracted with these approaches successfully over the urban areas where has continues small scale deformations (Hooper et al. [16]). Another approach is the small baseline (SB) technique which uses small temporal and spatial baselines to reduce the unwrapping errors (Berardino et al. [17], Casu et al. [18], Hooper [19]).
In Turkey, InSAR is a mostly used tool for determining earthquake deformations (Wright et al. [20], Burgmann et al. [21]; Cakir et al. [22]; Cakir and Akoglu [23]). Although the InSAR method is used in various applications, it generally has not been improved and is used for the purpose of subsidence monitoring in Turkey. There are a few studies on long term time series analysis which are mostly related to earthquake deformation estimation (Motagh et al. [24]; Arikan et al. [25]; Walters et al. [26]) and also land subsidence monitoring (Akarvardar [27]).
In recent years PSI and SB methods are used for the monitoring of mine related displacement extraction (Ng, et al. [1], Chul and Min [28], Mei et al. [29], Gueguen et al. [30], Baek et al. [31]). Detailed information from different coal mining studies is summarized in Table 1.1. In Zonguldak mining region several methods were used for subsidence measurements as leveling and GPS measurements. But these techniques have drawbacks, such as they are point based and short term measurements (Sezer et
3
al. [32], Akçın et al. [33], Can et al. [34]). InSAR monitoring also performed just for short time periods, and C band fails due to low correlation (Akçın et al. [33], Deguchi et al., [35], Kemaldere [36]).
On this purpose it is aimed to research different technique to overcome this decorrelation using multi temporal InSAR technique. In this study, the goal is to monitor the mining subsidence in Zonguldak Province and to determine its characteristics, such as the direction and velocity, using the InSAR time series analysis which is employed to estimate the ground subsidence rates in mm/year along the line of sight (LOS) direction for long term period. In this frame the temporal evolution of surface deformation between 1993 and 2010 is observed with multi sensor analysis. Due to non/limited a priori knowledge of the subsidence velocity, a displacement analysis with interferometric time series was performed. This analysis will indicate the possibility to acquire first estimation of the deformation behavior in a time series of InSAR data for large areas. Identification of relatively stable areas could be used further for point based analyses as an attribution.
Characterizing the natural hazards and understanding the variation of the Earth’s surface over a long time period is very important for the assessment of vulnerability risks. This study is aimed at avoiding the loss of life and property due to subsidence by taking preventative precautions. This interdisciplinary work will also provide a good example for the forthcoming projects that will be carried out in a similar manner in the future.
4
Reference Data used Study area Deformation Content
Ng et al., 2010 [1] 10 ALOS June 2007- Oct 2008
New South Wales, Australia
85.6 cm as max.
subsidence 9 interferograms are calculated by DInSAR and the stack of DInSAR is used with a PSI approach. Depth of mining changes 470 m to 540 m from the surface. Interferograms formed with temporal baselines shorter than 92 days.
Chul and Min 2005 [28]
25 JERS-1 1992-1998
2x2 km-wide
Gaeun Korea 0.6 cm/yr Having perpendicular baseline<1500 m. were considered as point scatterer candidate. After correcting differential interferograms, elevation errors and LOS subsidence rates were computed on a pixel-by-piksel basis. A phase coherence value is considered as a reliability measure for each equation used for phase unwrapping and coherence > 0.7 is identified as PS. Mei et al., 2008 [29] 28 RADARSAT-1 2000-2006 1x1 km-wide Frank Slide, Alberta, Canada
3.1 mm/yr Commercial EarthView InSAR Coherent Target Monitoring software as a PSI approach is used. Data is acquired in SLC format. A coherence threshold of 0.65 was used for the process. Gueguen et al., 2009 [30] 88 ERS 1-2 1992-2002 19 ENVISAT 2004-2007 Nord/Pas-de-Calais coal basin, France
1.25 cm/yr (ERS) 0.3 cm/yr (ENVISAT)
The area has altitudes between 80 and 180 m. Commercial softwares are chosen as Diaposan for DInSAR and GAMMA IPTA for PSI analysis. Focused on urban area of Lens. DInSAR pair 1992-1995 ERS has temporal decorrelation, so displacement could not be extracted precisely.
Baek et al., 2008 [31]
23 JERS-1 1992-1998
Gangwon-do, Korea
22 × 20 km 3.6 cm/yr DInSAR and SBAS techniques are used. But due to lack some images and temporal baseline limitations good interferograms could not achieved. 25 interferograms are calculated with SBAS. Study area has covered with dense vegetation. SRTM-3 DEM is used to remove topographic phase. Less than 1 km length considered as SB.
Herrera et al., 2007 [37] 24 ERS 1998-2000 14 ENVISAT Mar 2003- Dec 2004 12 × 8 km
La Union, Spain 2.3 cm/yr
2.1 cm/yr
A sort of Small baseline subset (SBAS) technique Coherent Pixels Technique is used as an advanced DInSAR method. Depth of mining changes 80 m to 254 m. Interferograms formed with Perpendicular baselines smaller than 130 m and temporal baselines shorter than 900 days. 54 coherent pixels/km2 is identified in average.
4 Tab le 1. 1 Su mma riz ed st u d ies on d ef orma tio n m on it orin g at c o al mi n in g u sing m u lt i t emp or al InS AR
5
1.2 Aim of the Thesis
Zonguldak Province is a coastal settlement area that is prone to human-induced environmental problems such as subsidence due to the coal-mining areas. Severe deformations in the region caused by subsidence have been known since the 1900s, such deformations cause heavy damage on the Earth’s surface and to buildings. According to the latest drilling reports, there are still 150 million metric tons of coals under the coastline of Zonguldak province. However, the coastline has now become a residential area with tall buildings, which have also triggered many serious subsidence problems. Although the damage that has occurred in the region is not described in natural hazards regulations in Turkey, the types of damages and the amount of financial loss to citizens caused by building damage shows that the risk is high in Zonguldak Province. Investigation of such spatial and temporal changes would be difficult with conventional methods.
The potentiality of evaluation methods is significant for the prediction of the mechanisms and formation time of subsidence, in order to minimize the economic and social loss. In particular, such methodologies are of vital importance for evaluating man-made topographic deformations like mining activities. Inherently, buildings in a subsidence field are strongly affected and damaged. Generally, mine management organizations complain about damages in the mining basin. Property owners, on the other hand, seek compensation, considering mining managers to be responsible for the damages occurring in the residential areas because of the inconvenience of the ground, architectonics, and cracking or damage due to inadequate building structure materials. In contrast, subsidence after the mining process can be interpreted in a different way. For instance, subsidence on rough surfaces may cause landslides. Although built-up areas may be out of the subsidence area, they could still be damaged due to a landslide that was triggered by the subsidence. These types of incidences are encountered frequently in Zonguldak (Buyurgan [38]).
6
The rating of damages depends upon the size of buildings, the number of flats, non suitable structural system, and the ground form. Our study area includes large sized and multi-story buildings that were damaged through subsidence. Zonguldak province was built and developed after the pit coal was found. To avoid the effects of urbanization on production, many regulations have been initiated since 1867. Since 1932, these limitations on construction have been strictly applied. In that process, it was noticed that incorrect decisions were made and inaccurate construction areas were chosen. Today, the number of multi-story tower blocks is increasing every day in the city, under which large coal reserves exist. Observations definitely indicate that limestone at the coastline of Zonguldak is the main threatening factor of subsidence. Most of the buildings will be in an uninhabitable situation if coal production continues (Buyurgan [38]). It is obvious that Zonguldak is under the risk of a dangerous disaster.
1.3 Hypothesis
In this study, for the purpose of monitoring of the subsidence, a methodology is going to be developed using the InSAR technique, which will make it possible to determine the rate of the ground deformations for long time period. It is also expected that the prediction of the very-important external factors of subsidence will be achieved. Furthermore, the main triggers of the subsidence will be investigated. The information gathered will help to determine subsidence fields for planning reconstruction areas. Thus, it will be possible to guide the growth of urbanization more carefully.
The evaluation of long term time series of SAR images of mining subsidence in Turkey for the first time in a detailed study. Improving existing deformation monitoring at the case study of Zonguldak province. Assessment of two InSAR techniques, PSI and SB to determine the subsidence phenomena.
1. Sub-objectives and Research Questions
To indicate the possibility of the continuity of monitoring deformation by InSAR time series analysis
7
What is the performance of using multi track InSAR monitoring with ERS, ENVISAT and PALSAR data?
Do study areas have enough coherent targets for displacement extraction?
What are the scatterer densities over urban and rural areas?
To produce the deformation maps of the mining region and to interpret the distribution over the province
What is the subsidence distribution (mm/year) of long time?
What are the differences and similarities between PSI and SB methods for the monitoring of coal mining subsidence?
What is the difference of C band and L band results on urban and rural areas?
Are results agreeing with the previous deformation estimation studies over Zonguldak?
Which improvements can be achieved from multi temporal InSAR monitoring?
To investigate the relation of subsidence with geological structure
Is natural based deformation as landslides can be monitored?
What is the effect of geological properties?
2. Financial Support
During my study on this thesis, I have achieved financial support from different organizations:
Yildiz Technical University in the framework of the scientific research project 28-05-03-02.
The European Space Agency (ESA) for providing ERS and ENVISAT data under the project CAT-1 6543.
The Huygens Scholarship from Nuffic - Netherlands organization for international cooperation in higher education for the period 2009-2011. The research is completed at the Geosciences and Remote Sensing Department of Civil
8
Engineering and Geosciences Faculty of Delft University of Technology, Delft the Netherlands.
3. Thesis Roadmap
Chapter 1 gives a brief of motivation and research objectives about study as an
introduction.
Chapter 2 summarizes the SAR geometry, previous SAR missions and new generation
SAR satellites. Main principles of InSAR measurement and limitations of conventional InSAR are also addressed.
Chapter 3 describes the multi temporal InSAR methodology which is used in the study.
PSI and SB approaches of StaMPS are presented.
Chapter 4 provides physical information of the study area. Describes what mining
subsidence is. Prior studies on study area are presented.
Chapter 5 Data set of study area and the processes are expressed. Mean velocities of
the results are presented. Time series analyses of Zonguldak results are compared.
Chapter 6 gives a summary of finding results and conclusions of study. Discuss the
results of PSI and SB methods. Figure out the challenging parameters of the study, and suggests ideas as a future work.
9
CHAPTER 2
RADAR INTERFEROMETRY: BACKGROUND
2.1 Synthetic Aperture Radar
Spaceborne Radio Detecting and Ranging (RADAR) play an important role since late 1970s, and nowadays is a well-known technique. As an active system radar illuminates the target objects using electromagnetic pulses as microwaves and receives the reflected pulses. Microwave wavelengths range between 1 cm and 1 m in the electromagnetic spectrum (Figure 2.1).
10
Earth observation radar sensors operate with a side looking geometry as known Side Looking (Airborne) Radar (SLR-SLAR) also called Real Aperture Radar (RAR) and Synthetic Aperture Radar (SAR). In SAR systems radar sensor is mounted on an airborne or a spaceborne platform. During the forward motion of the platform, radar illuminates an area on the terrain which is called footprint. The flight direction of the SAR platform is called azimuth. The pulses of radar are sent to the terrain with a look angle (θ) which is perpendicular to the azimuth is called range direction (Figure 2.2). The complementary to the look angle is called depression angle (ψ).
Figure 2. 2 Geometry of RAR (adapted from Cakir [40] and Wright [41])
In radar images both azimuth and range has different resolution. Ground range resolution of radar image is defined the minimum distance to separate two objects along the ground
Footprint Azimuth
beamwidth H
11
range. The ground range resolution ∆Rg, depends on the pulse duration τp, which is the
time between two radar pulses and the incidence angle η, where c is the speed of light,
∆ (2.1)
The range resolution and the signal to noise ratio can be improved in case the frequency is modulated. If radar are pulses shortened resolution will be improved. On the other hand pulses should transmit enough energy. For this reason long range radar systems are
chirped. This approach is used with modulated frequency bandwidth, Bd (Wright [41]).
Using this technique the ground range resolution is
∆ (2.2) The azimuth resolution ΔAg, depends on the physical antenna length L, the range R and
wavelength of the signal λ. If the radar antenna is longer the resolution is better. Beam width Bw = λ/L and the swath width on surface is Sw= λRm/L cosη, where Rm is the middle
slant range, η is incidence angle. Ground azimuth resolution ΔAg = Bw R, thus
∆ (2.3)
Figure 2. 3 a)Range resolution, b)Azimuth resolution (adapted from Cakir [40] and Wright [41]) Rn Rf Rm ΔRg Sw Range direction cτp H a R H b
12
Such a long antenna is not practical, due to fact that an advanced technique is developed as known Synthetic Aperture Radar (SAR). It is first represented by Graham [42] that azimuth resolution is improved. The concept comprises of an advanced technique called as SAR focusing technique. It is based on shifting the Doppler frequency of the return signal echoes. A large antenna is synthesized during the subsequent pulse returns from the same area illuminated on ground.
Figure 2. 4 SAR geometry (adapted from Cakir [40])
As showned in figure 2.4 total length of the simulated radar antenna compose synthetic aperture. The target area will be illuminated with many consecutive pulses which have different angles. Each illumination of the target area in each angle has different Doppler
frequency, fD (Lazecky [43]). The strong reflection as the Doppler frequency is zero will be
received when the range distance is the smallest between the ground object and the radar. It should be smallest when the target is on the perpendicular direction to the radar.
Footprint First time radar
illuminates the ground
Last time radar illuminates the
13
As the radar antenna passes along its flight track the relative velocity between antenna and illuminated area changes and also earth’s rotates which are causes a Doppler effect. However, there will be a slight angle of the radar platform called squint angle, ωs (Hanssen
[44]). The Doppler frequency for a target object, concerning the squint angle, and platform velocity vs and look angle will be,
(2.3)
The Doppler frequency is zero, the zero Doppler, fD = 0Hz, where the center frequency of
the progression of a target through antenna beam is called the Doppler centroid frequency, fDC. As the movement of the target through the beam the variation of the
Doppler frequency composes the Doppler bandwidth BDop, where βa is the width of
azimuth beam of the radar antenna and the vs is the relative velocity of the radar
platform,
(2.4)
Meanwhile, the azimuth resolution of a SAR focused image relevant to Doppler bandwidth and the relative velocity of the radar platform,
Δ
(2.5)
2.1.1 Properties of SAR Image
The focused SAR data is known as Single Look Complex (SLC) image which consists of amplitude and phase information. The antenna sends electromagnetic waves as pulses to the terrain and the scattered echoes are received. The received signal called backscatter which has both real and imaginary components in a complex format.
The amplitude image records the backscatter of the illuminated area. The backscatter values depend on the characteristics of the surface scatterer like topography, roughness and dielectric coefficient related to moisture of the ground. Tone, texture, size and shape parameters are used to interpretation of SAR images. Radar imagery tone is defined as
14
the intensity of the backscatter. If a surface is spotlessly smooth, the surface reflects like a mirror effect and radar pulse does not scatter back to the radar. A surface must has enough roughness to backscatter the energy. Roughness is relative and depends on the incidence angle and the wavelength of the radar. A surface is considered rough with the Rayleigh roughness criteria;
(2.6) where h is mean height of surface roughness feature, λ is wavelength of radar and η is incidence angle [2]. Dielectric coefficient is related to moisture content of the object. If an object has low water content will has low dielectric constant. That causes a high penetration depth, and a small amount of signal return. Wet soil, forest canopy, watered vegetation or young lavas appear dark and the amplitude is zero in SAR images due to the no or low signal return. If energy return to radar that the energy came from higher amplitude which is bright in image is recorded. Shape parameter can be described as the objects’ outline as buildings, streets and bridges. Size and texture of the objects can be useful to recognize the features and provide for evaluation of the terrain analysis. Electromagnetic waves are transmitted in phase and during the receiving back the radar pulses interact to the object. The reflection can be a stronger bright return, and also weak dark due to being out of phase. This creates a grainy texture called salt and pepper or speckle. To overcome this situation and obtain better backscatter multi looking is applied on single look images by averaging of several pixels which decrease the pixel size as a result (Wright [41]).
SAR applications depends on the variety of radar wave frequency. Different bands are used for different applications. Satellite sensors have three kinds of bands X, C and L recently. For instance, length of the L-band is longer than C and X; therefore L-band can penetrate deeper than the other bands(Figure 2.5). It is more sensitive to estimate soil moisture and forest biomass than the other bands (Table 2.1).
15
Figure 2. 5 Influence of wavelengths on objects (ESA, [45])
Table 2. 1 SAR bands with frequency and wavelength [46]
Band Frequency (GHz) Wavelenght (cm)
P 0.225 – 0.39 133–76.90 L 0.39 – 1.55 76.9–19.40 S 1.55 – 3.90 19.4–7.69 C 3.9 – 5.75 7.69–5.21 X 5.75 – 10.90 5.21–2.75 Ku 10.9 – 18 2.75–1.67 K 18 – 26.50 1.67–1.13 Ka 26.5 – 36 1.13–0.83 Q 36 – 46 0.83–0.63 V 46 – 56 0.63–0.53 W 56 – 100 0.53–0.30
16
Another deterministic parameter is the polarization of the radar wave. It describes the orientation of the transmitted and received SAR wave. Horizontally (H) and Vertically (V) polarized images are used with different configurations as single co-polarization which can be HH or VV and also single-cross HV or VH, dual polarization with HH and HV, HH and VV, VV and VH, VV and HH, and quad polarimetry contains HH+HV+VH+VV. Here first term related to emitted radiation and the second one is received radiation. For some specific applications polarimetry can be a key point for interpretations. Different polarization combinations includes different information, thus it can be useful for the classification of agricultural areas where to separate mixed vegetation [47].
2.1.2 Distortions in SAR Image
Due to having geometry of side looking, geometrical distortions occur on SAR images. Because of the terrain topography on the slant range direction of radar foreshortening,
layover and shadow distortions happen (Figure 2.6). Foreshortening depends on the
incidence angle of radar and the slope of topography. If the slope is perpendicular to the satellite LOS the distortion gets its maximum.
Figure 2. 6 Geometrical distortions in SAR images where F: Foreshortening, L: Layover, S: Shadow (adapted from Sousa [48])
17
In the radar images tones of foreshortened areas appear bright, and the distance between hill of the slope and bottom is appears shorter (Figure 2.6). If the radar pulses reaches top of a hill before the bottom a reversed slant range image occurs and this is called layover (Figure 2.6). In the image it appears bright where incidence angle is lower than the slope angle. Shadow happens where the slope is away from the sensor (Figure 2.6). The shadow area is not be illuminated so these parts appear dark in the image.
2.1.3 Satellite Acquisitions
Earth based satellite remote sensing of radar is started with the launch of SEASAT by NASA in 1978. Later the Shuttle Imaging Radar A (SIR-A) and SIR-B were launched in 1981 and 1984 respectively by NASA. These L-band space shuttles designed to experiment for monitoring of glacial movements, oceanography and terrestrial analysis. However, they could not have success for long time. In 1987 the former Soviet Union spacecraft Cosmos 1870 was launched as a first S-band SAR satellite, and it completed its mission in 1989. Later in 1991 second S-band satellite ALMAZ-1 which had 15 m ground resolution was launched. Same year European Space Agency (ESA) launched C-band European Remote Sensing satellite (ERS-1) which had 10 years acquisitions. ERS-2 was followed as a second mission which overlapped with the ERS-1, and was launched in 1995. For nine months ERS-2 followed in the same orbit of ERS-1 to compose TANDEM mission with 1 day temporal baseline. Late 2011 ERS-2 provide its last acquisition, and after 20 years ERS mission is completed with a wide archived data.
Japan launched L-band satellite named the Japanese Earth Resources Satellite (JERS-1). It operated from 1992 to 1998. Space shuttle radar observations continued with SIR-C/X-SAR which one launched in 1994. This was the first time that a satellite had three frequencies; X, C and L bands. Canada Space Agency (CSA) operates Radarsat-1 satellite since 1995. It has a very wide swath with 500 km on ScanSAR mode. The Shuttle Radar Topography Mission (SRTM) was designed to perform a single pass interferometry to overcome temporal decorrelation of repeat pass satellites. It was fixed with 60 m baseline between
18
two antennas. This mission used C and X band to compose Digital Elevation Model (DEM) for 12 days between 11 and 23 February 2000.
The Environmental Satellite (ENVISAT) was launched by ESA in 2002. It has ten different instruments to study on Earth as land, ocean and atmosphere. Advanced SAR (ASAR) is the radar sensor which is an advanced aspect of ERS mission. In 2006 Japan launched second L-band satellite called The Advanced Land Observing Satellite (ALOS) following the JERS-1. In 2007 other new generation SAR satellites were launched as COnstellation of small Satellites for Mediterranean basin Observation (COSMO-SkyMed) (June 8th), TerraSAR-X (June 15th), Radarsat-2 (December 14th). COSMO-SkyMed which is operated by Italian Space Agency is the first radar constellation using four satellites equipped with X-band SAR sensor, and it has very short temporal baseline. TerraSAR-X is also an X-band satellite operated by German Aerospace Center (Deutschen Zentrums für Luft- und Raumfahrt - DLR) has an 11 day revisit time. C-band Radarsat-2 is operated by CSA. It has upgraded its routine as left and right looking operations. Spanish Earth Observation Program will launch a high resolution X-band satellite called SAR Observation Spanish Satellite (Satélite Español de Observación SAR - SEOSAR/PAZ) in 2012. ESA is developing new missions with five satellites called Sentinels for Global Monitoring for Environment and Security (GMES) services. Sentinel-1 will be a C-band radar satellite which will be launched in 2013.
19
Mission Agency Year Orbit repeat
(day) f(GHz) Bandwidth (MHz) Incidence Angle(deg) Swath (km) λ(cm) Polarization * HSat (km) GR (m) Seasat NASA 1978 3 1.275 19 20/23/26 100 23.5 HH 800 25 SIR-A NASA 1981 - 1.275 6 47/50/53 50 23.5 HH 259 40 SIR-B NASA 1984 - 1.275 12 15-55 20-40 23.5 HH 360/257/22 4 16-58 Cosmos 1870 RSA 1987-1989 - 3 - 30-60 20-45 9.6 HH 270 20 Magellan NASA 1989-1992 - 2.385 2.26 18-50 25 12.6 HH 275/2100 120 ALMAZ-1 RSA 1991-1992 - 3 - 30-60 20-45 9.6 HH 270 15 ERS-1 ESA 1991-1992 3 5.3 15.55 21-23-26 100 5.57 VV 790 25 ESA 1992-1993 35 5.3 15.55 21-23-26 100 5.57 VV 790 25 ESA 1993-1994 3 5.3 15.55 21-23-26 100 5.57 VV 790 25 ESA 1994-1995 168 5.3 15.55 21-23-26 100 5.57 VV 790 25 ESA 1995-2000 35 5.3 15.55 21-23-26 100 5.57 VV 790 25 ERS-2 ESA 1995-2011 35 5.3 15.55 21-23-26 100 5.57 VV 790 25 ESA 2011 3 5.3 15.55 21-23-26 100 5.57 VV 790 25 JERS-1 JAXA 1992-1998 44 1.275 15 26-35-41 75 23.5 HH 568 18
SIR-C/X SAR NASA, DLR, ASI
1994 174 9.7 40 15-60 15-40 3.1 VV 225 30
SIR-C/X SAR NASA, DLR, ASI
1994 174 5.2 20 15-60 15-90 5.8 SCo,D,Q 225 30
SIR-C/X SAR NASA, DLR, ASI
1994 174 1.28 10 15-60 15-90 23.5 SCo,D,Q 225 30
Radarsat-1** MDA Since 1995 24 5.3 11.6/17.3/
30 10-58 45-500 5.57 HH 793-821 8-100 SRTM NASA, DLR, ASI 2000 0 5.3 10 54 225 5.66 HH,VV 233 90 SRTM NASA, DLR, ASI 2000 0 9.6 10 54 50 3.1 VV 233 30 ENVISAT ESA 2001-2010 35 5.331 14 15-45 50-405 5.56 SCr, D 800 25-150
ENVISAT** ESA Since 2010 30 5.331 14 15-45 50-405 5.56 SCr,D 783 25
ALOS JAXA 2006-2011 46 1.27 14/28 8-60 40-350 23.6 SCr,D,Q 692 7-100
TerraSAR-X** DLR Since 2007 11 9.65 150/300 15-60 5-150 3.11 SCo,D,Q 514 1-18
Radarsat-2** MDA Since 2007 24 5.405 11.6/17.3/ 30/50/100
10-60 20-500 5.54 SCo,D,Q 798 1-100
COSMO-SkyMed** ASI Since 2007 16 9.66 400 20-60 10-200 3.12 SCr,D 620 1-100
Tab le 2. 2 Cha ract erist ic s o f SAR missio n s ( ad ap te d fr o m [4 3 ], [44 ], [4 9] , [5 0] , [ 51 ], [5 2] , [5 3] ) 19
20 *SCo=Single Co-polarized, SCr= Single Cross-polarized, D=Dual, Q=Quad, ** Current Missions f= radar carrier frequency, = Wavelength, Hsat=Satellite altitude, GR=Ground resolutio
Mission Agency Year Orbit repeat
(day) f(GHz) Bandwidth (MHz) Incidence Angle(deg) Swath (km) λ(cm) Polarization * HSat (km) GR (m) Kompsat-5 KARI 2012 28 9.66 - 20-55 10-100 3.12 SCo, SCr D,Q 550 1-20 PAZ-SEOSAR CDTI 2012 11 9.65 300 15-60 5-100 3.11 SCo,D 514 1-15 Sentinel-1 ESA 2013 12 5.405 100 20-45 20-400 5.54 SCo,D 693 5-40 ALOS-2 JAXA 2013 14 1.258 14/28/42/8 4 8-70 25-350 22.9 SCo, SCr D,Q 628 3-100
SAOCOM-1A CONAE, ASI 2014 16 1.275 50 20-50 30-350 23.5 SCo,D,Q 620 7-100
Tab le 2. 2 is co n tin u in g 20
21
2.2 InSAR Principles
Interferometric Synthetic Aperture Radar (InSAR or IfSAR) has phase information beside the amplitude information. Late 1970s InSAR became a very useful tool for earth observation of different applications. First Zisk [54] described one of the first studies on topography mapping of the Moon using interferometric observations in 1972. Graham showed the potential of radar as interferometers to monitor Earth topography by aircraft measurements [42]. Other airborne applications of terrestrial radar interferometry were presented late 1980’s by Zebker and Goldstein [55], Goldstein and Zebker [56] (Akarvardar, [27]). Zebker and Goldstein [55] showed the
along track interferometry which use two antenna mounted on aircraft. Along track
interferometry transmits signal by a signal antenna and receive the reflected signal by that antenna and a second antenna at the same time.
Gabriel et al. presented first InSAR application to measure the LOS deformation ranging cm to mm accuracy [57]. They used differential interferometry (DInSAR) with three observations which were taken at different times to make two interferograms. One of them is topographic pair and the other one is deformation pair, and then calculated the differences of interferograms. Thus, the effect of topography can be removed. This three-pass method can only be used if the common image is correlated with the other two images. However, this condition cannot be possible due to decorrelation of high geometrical baseline or long temporal baseline. A two-pass
approach and an external Digital Elevation Model (DEM) can be used. But DEM errors
will be implicated. In that fact another approach called four-based method can be applied, where there is no common SAR image (Hannsen, 2001 [44]).
In 1990 Li and Goldstein also used repeat pass interferometry and an interferometric baseline was created with the passes of satellite revisit. Landers, California earthquake became the first event which was analyzed by DInSAR (Massonet et al., [8]). Since InSAR had success in variety of applications, beside the topographic mapping (Zebker and Goldstein [55], Madsen [58]) many deformation studies have been developed by DInSAR such as earthquakes, landslides, volcanoes, glacier motion, and land subsidence.
![Figure 2. 3 a)Range resolution, b)Azimuth resolution (adapted from Cakir [40] and Wright [41]) RnRfRmΔRg Sw Range direction cτpH a R H b](https://thumb-eu.123doks.com/thumbv2/9libnet/3249882.8205/34.918.165.823.652.988/figure-resolution-azimuth-resolution-adapted-wright-rnrfrmδrg-direction.webp)
![Figure 2. 6 Geometrical distortions in SAR images where F: Foreshortening, L: Layover, S: Shadow (adapted from Sousa [48])](https://thumb-eu.123doks.com/thumbv2/9libnet/3249882.8205/39.918.239.709.666.991/figure-geometrical-distortions-images-foreshortening-layover-shadow-adapted.webp)
![Figure 4. 2 Weather conditions of Zonguldak (adapted from Turkish State Meteorological Service [75]) 05101520JanFeb Mar Apr May Jun Jul Aug Sep Oct Nov Dec](https://thumb-eu.123doks.com/thumbv2/9libnet/3249882.8205/58.892.152.798.782.1042/figure-weather-conditions-zonguldak-turkish-meteorological-service-janfeb.webp)
![Figure 4. 10 Coal production of TTK in Zonguldak Province between 1941 and 2011 (TCE, [85])](https://thumb-eu.123doks.com/thumbv2/9libnet/3249882.8205/64.892.184.737.703.1000/figure-coal-production-ttk-zonguldak-province-tce.webp)

![Figure 4. 18 a) No of dead per year and coal production, b) No of injures per year and coal production (TCE,[86])](https://thumb-eu.123doks.com/thumbv2/9libnet/3249882.8205/72.892.194.745.163.438/figure-dead-year-coal-production-injures-year-production.webp)
![Figure 4. 20 Relationship between width of coal seam and the surface subsidence (Bauer [93])](https://thumb-eu.123doks.com/thumbv2/9libnet/3249882.8205/75.892.219.720.698.1019/figure-relationship-width-coal-seam-surface-subsidence-bauer.webp)