Dr. Naim Kapucu University of Central Florida Department of Public Administration
● ● ●
Kar Amacı Gütmeyen Örgütlerin Etkinliği ve Sosyal Sermaye: Ağ Analizi Örneği
Özet
Kar amacı gütmeyen organizasyonların etkinliği, akademik ve profesyonel çevrelerde geniş bir ilgi konusudur. Bu çevreler yetersizlik kavramını ele alırken bu organizasyonlardaki kurul üyeleri, çalışanlar ve gönüllüler arasındaki bütünleştirici bağları ve bu kuruluşların bir bütünlük içerisinde ortak değerler ve güvenin yardımıyla hedeflerine doğru hareket edebilme kabiliyetlerini incelemek yerine, organizasyon içerisindeki bireylerin görev ve sorumlulukları belirleme üzerine yoğunlaşmışlardır. Bu makale ise bilime: (1) Kurul üyeleri çalışanlar, ve gönüllüler arasındaki uygun bağların bilginin tartışılmasında ve karar almada önemli bir unsur olduğu; (2) bu bağların sosyal sermayenin kurumsal boyutu sayesinde geliştiği; (3) sosyal sermayenin organizasyon için değer yaratacağı; argümanlarını inceleyerek katkıda bulunmayı hedeflemektedir. Bu araştırma sosyal sermayenin kurumsal boyutundaki bağların çeşitlerini ve kalitesini incelemektedir. Bu çalışma, bağlı bir gurupta sosyal sermayenin etkilerini inceleyen çalışmaları ilerleterek literatüre katkı sağlamayı hedeflemektedir.
Anahtar Kelimeler: Sosyal sermaye, örgüt içi ağ analizi, örgütsel etkinlik, kar amacı gütmeyen organizasyonlar, gönüllülük.
Abstract
There is widespread concern over the effectiveness of nonprofit governance among scholars and practitioners. They have continued to address the phenomenon of ineffectiveness by clarifying roles and responsibilities for individuals rather than focusing on the impact of the cohesive ties amongst board members, staff, and volunteers and the ability of the nonprofit organization to work as a unit with shared values and trust resulting in value creation for the nonprofit organization. The paper seeks to contribute to the body of knowledge by developing the following arguments: (1) appropriate ties amongst board members, staff, and volunteers are integral to the ability to discuss information and make decisions; (2) appropriate ties are developed within the structural dimension of social capital; and (3) social capital will lead to value creation for the institution. The paper examines the quality and type of the ties of the structural dimension of social capital. This study contributes to the literature by furthering the study of the impact of social capital within a bonded group. The paper offers some practical suggestions for using the model of social capital and network theory to help nonprofit organizations become more effective in their governance.
Keywords: Social capital, Intra-organizational networks, organizational effectiveness, nonprofit organizations, voluntarism.
Effective Nonprofit Governance and Social Capital:
A Network Analysis Perspective
Introduction
The board of directors of a nonprofit organization is legally and financially responsible for the conduct of the nonprofit organization. It is not a passive role but rather one that must be active for the good of the organization and for reducing liability of the individual members of the board of directors. The board is fundamentally responsible for defining the organization’s mission, goals, and objectives. A commitment to the organization’s mission should drive the nonprofit boards of directors’ sense of public accountability and creating public value.
The most effective board of directors should be a group of professionals who bring a breadth of skills, experience and diversity to the nonprofit organization. Ideally, the board members should have different backgrounds and contacts from the staff’s background and the other members of the board of directors. As the nonprofit organization grows and changes, the board of directors also will evolve to meet changing needs of the nonprofit organization and changing circumstances (Lewis, 2001; Robinson, 2001).
Board members may have specific responsibilities that are unique to the nonprofit organization or industry in which the nonprofit organization performs. The Board of Directors might also have a variety of responsibilities which are defined in the By-laws of the nonprofit organization and in numerous Federal and State statutes and regulations. The board oversees that the organization achieves its stated proposes and objectives. Through regular meetings, the board of directors helps ensure effective organizational planning and oversees that organization resources are managed effectively.
What Makes a Successful Board Member? A board member’s success is determined not only by her/his business skills and experience, but also by her/his character. Fisher Howe (1995: 144) identifies several characteristics of successful board members: They are honest, They are enthusiastic, They keep an open mind, They are team players, They tackle complex problems with relish, They take an orderly approach to decision making, They are competent, They have a sense of humor. Boards of nonprofit institutions have been called an incompetent group of competent individuals and the Harvard Business Review on Nonprofits (Taylor vd., 1999: 53) states that “too often, the board of a nonprofit organization is little more than a collection of high-powered people engaged in low-level activities.”
The study uses the observation of the board and staff of a nonprofit organization during six months of the organization’s activity and supplements the data with interviews. The study gauges the impact of the quality and cohesiveness of their ties and the impact those ties have on their ability to increase their effectiveness. There is much concern over the effectiveness of nonprofit organizations despite the many references for nonprofits to seek out methods to improve their effectiveness. Becoming effective means having rich and meaningful communications; this would lead to building a shared knowledge of information and values in a nonprofit organization. The paper addresses the following research questions: What are some of the characteristics of effective nonprofit governance? How can an effective team relationship between the board and staff on a nonprofit organization be developed? Should board members also fill service delivery roles? Should board members also fill “management” roles? If there is a tendency for the internal relationships in such organizations to exhibit the same behaviors the organization itself is trying to address, is it indeed advisable to require that boards be filled with clients and staff?
Theoretical Background: Network Structure of
Nonprofit Governance
Developing cohesive relationships is an integral part of creating organizational effectiveness and creating value for a nonprofit organization. This research examines the relationships amongst people in a particular nonprofit organization and gains an understanding of its impact with regard to organizational effectiveness. That cohesive relationship has been called social capital by many authors. Social capital refers to connections among individuals, social networks and the norms of reciprocity and trustworthiness that arise from them (Ostrom, 2003; Baker, 2000; Coleman, 1990 & 1988; Fukuyama, 1995;
Lin, 1999; Putnam, 2000 & 1993). A high level of social capital strengthens organizational effectiveness and is built through a model of social capital and value creation (Pentland, 1999; Moore, 1995; Nohria/ Eccles, 1992; Tsai / Ghoshal, 1998). This social capital model leads to the development of resource exchange (rich communication) in a trusting environment. In this environment of rich communication and trust, knowledge can be shared. The sharing of knowledge develops organizational advantage, innovation and value. The dimensions within the model of social capital are structural, cognitive and relational.
In distinguishing between the structural and the relational dimensions of social capital, Nahapiet and Ghoshal (1998) relied on Granovetter’s theory of embedded groups: that individuals couple and decouple and foster loose ties amongst individuals. Those loose ties better facilitate communication than strong ties while maintaining trust. A Granovetter type of weak tie theory when applied to the structural dimension of Nahapiet and Ghosal’s model within a group will better achieve value creation. Value creation will enable an ineffective nonprofit organization to move from being ineffective to being more effective. Mark Granovetter (1973: 1361) measures the strength of an interpersonal tie by the following definition: “the strength of a tie is a combination of the amount of time, the emotional intensity, the intimacy (mutual confiding) and the reciprocal services which characterize the tie.” “It is sufficient for the present purpose if most of us can agree, on a rough intuitive basis, whether a given tie is strong, weak, or absent.” Granovetter states that “friend” corresponds to strong ties and “acquaintance” refers to weak ties and he makes a strong case for social construction based on the strength of weak ties.
Social capital consists of networks and norms that enable individuals in an organization to act together effectively to pursue the objectives of the organization. An embedded institutional design is a form of social capital, defined by James Coleman (1988) as the aspects of relationships between individuals that enable them to create new values.
Dynamic networks are underpinned by reciprocity and mutual trust, which allow members of a nonprofit organization to share information, risks, and opportunities with greater ease. The ability to innovate and enhance learning depends on obtaining access to learning-intensive relations (Burt, 1992; Carley, 1999; Chisholm, 1995; Powell, 1990; Hardin, 1982). These links are vital because they not only connect individuals to one another but also give members access to the larger world outside their social circle through a chain of affiliations (Granovetter, 1973). For such cooperation to occur, collective trust must develop within the nonprofit organization. When collective trust is high,
individuals can share information with others without risk; however, when collective trust is lacking, individuals may be suspicious of others and unwilling to put themselves at risk by sharing valuable information with others in the organization (Ostrom, 2003; Chisholm, 1998; Kramer, 1999). Success depends on taking advantage of extensive and affordable connections that establish how members interact.
The responsibilities of the Board as a whole are equally as important as the responsibilities of the officers. There are nine key areas that each Board member is responsible for while serving on a Board of Directors. Those nine areas are: to determine the organization’s mission; set policies and adopt plans for the organization’s operations; approve the budget; provide adequate resources for the organization; develop organizational visibility; ensure that the organization’s corporate and governance documents are updated and secure; recruit and select new board members; recruit, hire, evaluate, reward, or terminate, if necessary, the executive director of the organization; and protect and preserve the organization’s non-profit tax-exempt status. Each member of the Board is held accountable for carrying out the nine duties and responsibilities listed while serving on a Board (Carver/ Carver, 2006; Chait vd., 2005; Carver, 2002 & 1997; Drucker, 1990).
The following are major responsibilities identified in the literature that the board of directors must adopt to be successful in carrying out their mission in a nonprofit organization. First, the board of directors must know and completely understand the organization’s mission. To completely understand the mission the board must have comprehension of the organization’s daily operation. The role of the board comes into play during this understanding concept to ensure the compliance with the law and organization’s charter. Second, the board must prepare the firm for all future operations through the task of planning. This planning can be short term, such as year-to-year, or long term, five years down the road. By first understanding the organization’s mission, the firm will be able to correctly identify strategic plans to parallel the overall mission. Third, a more black and white portrait is the concept of fiscal responsibility. The board must be responsible for the financial planning of the organization whether through the form of budget or analysis of past fiscal years. Here it is important for the board to outline clear budgetary boundaries and financial controls for the organization to follow. The fourth responsibility of the board is to provide sufficient financial support to ensure a successful organization. This responsibility can be executed through the direct personal donation of board members and the commitment to fundraising through mutual friends or unknown members of the community. The fifth component of the board’s responsibility is to hire, monitor, and fire the chief executive officer if
necessary. This process requires careful consideration of all candidates. After a chief executive has been hired it is the responsibility of the board to monitor this new member to ensure compliance with the organization’s standards; if this member fails to perform it is the board’s responsibility to ask for his or her resignation or to fire the chief executive. It would be unwise for any member of the board to suggest hiring a friend or someone they think would be good for the position. The sixth element of the board’s responsibility is to develop effective communications with the surrounding community to promote the work of the organization (Bryson, 1995; Pappas, 1996; Light, 2001; Wolf, 1999). The organization should listen to what suggestions the members of the community have to offer as well as making their services known.
Ott notes that the limits of a Board’s interests should not involve activities at or below the executive level – while still maintaining an insistence that all activities be prudent and ethical. The balance between prudent oversight and overstepping the bounds of a Board’s responsibilities can be difficult, especially when considering the Board’s potential liabilities – and human nature, as well (Chrislip/ Larson, 1994; OTT, 2001).
Method
The goal of the paper is to discover not only the role social capital plays in building effective nonprofit governance, but also to gain an understanding of how important it is to have cohesive network ties. The author was able to gain access to a nonprofit organization in Pennsylvania, USA where he conducted the study. Observations were made during meetings of the full board, staff, and joint committee meetings of the organization. The observations were supplemented by interviews with individual board members – including advisory board members, the director, and the staff. The work was performed over a six-month period. Semi-structured interviews were conducted. Interviews were conducted in-person, and lasted from 20- 35 minutes.
Interaction patterns of the individual members of the organization were mapped by Network Analysis∗ using UCINET 6.0 (Borgatti vd., 2002).
Standard measures of communication − network density, betweenness, centrality, and degree centrality – were used. The study used the network analysis techniques to help understand intra-organizational relations. The basic
∗ Network analysis is the mapping and measuring of relationships and flows between people, groups, organizations, computers, or other information/knowledge processing entities.
idea of a social network analysis is that a set of actors (points, nodes) may have relationships (edges, ties) with one another. Networks can have few or many actors, and there may be one or more kinds of relations between pairs of actors. The other fundamental properties of a social network have to do with how connected the actors are to one another. Networks that have few or weak connections, or where some actors are connected only by pathways of great length may display slow response to stimuli. Networks that have more and stronger connections with shorter paths among actors may be more robust and more able to function effectively. Measuring the number and lengths of pathways among the actors in a network allow us to index these important tendencies of whole networks (Freeman Vd., 1992; Hanneman, 2001).
Individual actors’ positions in networks are also usefully described by the numbers and lengths of pathways that they have to other actors. Actors who have many pathways to other actors may be more influential with regard to them. Actors who have short pathways to other actors may be more influential or central figures. So, the number and length of pathways in a network are important to understanding both individuals’ constraints and opportunities, and for understanding the behavior and potentials of the network as a whole (Krackhardt, 1999; Scott, 2000).
Measures of individual position and overall network structure are based on whether there are pathways of given lengths between actors, the length of the shortest pathway between two actors, and the numbers of pathways between actors. Indeed, most of the basic measures of networks: measures of centrality and measures of network groupings and substructures, are based on looking at the number and length of pathways among actors who are used for the analysis of the collected data (Butts/ Carley, 2001).
This research uses the standard network centrality measures of degree, closeness, and betweenness applied to groups (Everett/ Borgatti, 1999). The group centrality measures enabled the study to answer such questions as how important were the board and the staff in effective governance? With these measures some alternatives to the inverse problem can also be recommended: given the networks of ties among individuals, how can an organization be designed that is effective? Which individual is more central in the nonprofit governance structure? Beside the group centrality, cliques, and subgroups were also measured.
Importance of Teams in Nonprofit Governance
How are nonprofit organizations made more effective, specifically, how is governance structure networked to each other? The study organization plans
to go through a transitional period, trying to recruit new members and wrestling with the uncomfortable but inevitable task of asking board members to step down.
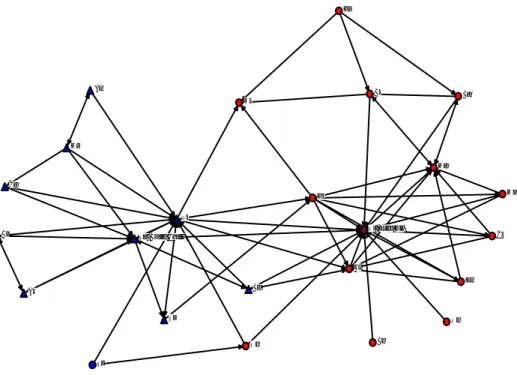
Figure I: Advise Network in Nonprofit Governance1
Ot (Exec Dir) Ma Mk Mp Ck Gk Oe Hy Be Ey Ak Bn Sa (Board Chair) Sp Bd Nk Ba Bk Gs Oe Ay Ms Ca Ss
The advice network is presented in Figure I. A number of things can be perceived by simply looking at the graph. There are a limited number of actors here (25), and all of them are “connected.” But, clearly, not every possible connection is present. There appears to be some differences among the actors in how connected they are. Ot, Ma, and Nk are in the center of the activities. On the other hand, Oe, Ss, and Be are not very central or well connected to other members of the organization. If we look closely, we can see that some actor’s connections are likely to be reciprocated in this network but some others are
not. Ot and Nk seem to be in the center of the action; Oe, Ss, and Be seem to be more peripheral in the network.
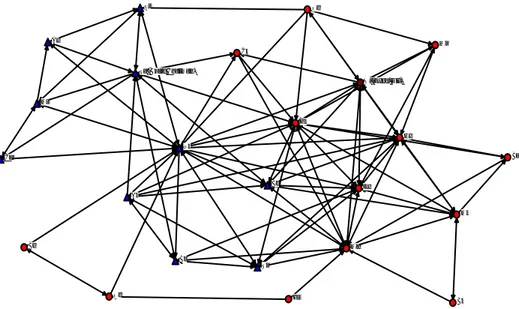
Figure II: Friendship Network in Nonprofit Governance2
Ot (Exec. Dir.) Ma Mk Mp Ck Gk Oe Hy Be Ey Ak Bn Sa (Board Chairman) Sp Bd Nk Ba Bk Gs Oe Ay Ms Ca Ss
The friendship network is presented in Figures II. There are a limited number of actors here (25), and all of them are “connected” as presented in Figure I. There appear to be some differences among the actors in how connected they are. In Figure II, more cliques and subgroups are present and these cliques somehow similar to the cliques presented in figure I. “[N]etwork centrality increases an actor’s knowledge of a system’s power distribution, or the accuracy of his or her assessment of the political landscape. Those who understand how a system really works can get things done or exercise power within that system” (Ibarra, 1993:494).
a. Group Centrality
The study explores the individuals that play a central role in the nonprofit governance and the relations among other individuals in the organization. One of the methods used to understand networks and their participants is to evaluate the location of actors in the network. Measuring the network location is finding the centrality of an actor. These measures help determine the importance of a node in the network. Centrality measures were used as a basic tool for identifying key individuals in the nonprofit governance network (Everett/ Borgatti, 1999). The study does not measure group centrality by computing centrality on a network of relationships among groups. Instead, the centrality of a group is computed directly from the network of relationships among organizational members. There are no problems working with overlapping groups, where one specific individual can belong to many groups, subgroups, or cliques. The centrality approaches (degree, closeness, and betweenness) describe the locations of individuals in terms of how close they are to the center of the action in a network. The following calculations are based on the advice network.
i. Degree Centrality
Group degree centrality is defined as the number of non-group nodes that are connected to group members (Everett/ Borgatti, 1999). Actors who have more ties to other actors may have higher centrality. Because they have many ties, they may have access to, and be able to call on, more of the resources of the network as a whole. It can be easily seen visually from Figure I which individual is more central, and by examining the degrees of the points as a measure of who is central in this network. Ot, Nk, and Ma represent this relationship. Degree centrality measures the network activities for an actor which is the number of direct connections a node has. These individuals have the most direct connections in the network, making their position the most active nodes in the network. They are connectors or hubs in this network.
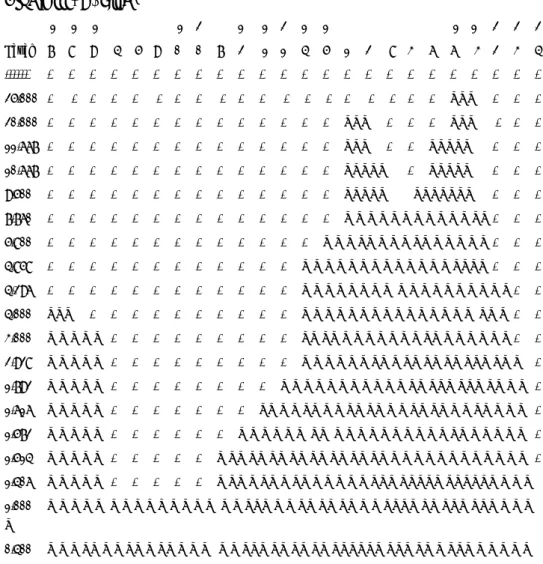
Table I: Freeman’s Degree Centrality Measures Degree NrmDegree --- --- 1 Ot 14.000 60.870 16 Nk 14.000 60.870 6 Gk 9.000 39.130 2 Ma 8.000 34.783
8 Hy 8.000 34.783 13 Sa 8.000 34.783 18 Bk 5.000 21.739 5 Ck 4.000 17.391 3 Mk 4.000 17.391 10 Ey 4.000 17.391 17 Ba 4.000 17.391 15 Bd 4.000 17.391 4 Mp 4.000 17.391 22 Ms 4.000 17.391 14 Sp 3.000 13.043 12 Bn 3.000 13.043 11 Ak 3.000 13.043 7 Oe 3.000 13.043 23 Ca 3.000 13.043 19 Gs 3.000 13.043 21 Ay 2.000 8.696 24 Ss 2.000 8.696 20 Oe 1.000 4.348 9 Be 1.000 4.348
UCINET is used to do the counting, and some additional calculations and standardizations that were suggested by Linton Freeman (1999). Table I represents the central individuals by Freeman’s degree centrality. Freeman’s degree centrality measures show that Ot and Nk have the greatest degree, and can be regarded as the most influential in the nonprofit organization. Gk, Ma, and Hy are followed by Sa. The similarity between the two results, Freeman’s degree centrality measures and visual representation of the data in graph, can easily be captured.
ii. Closeness Centrality
Degree centrality measures might be criticized because they only take into account the immediate ties that an actor has, rather than indirect ties to all others. One actor might be tied to a large number of others, but these others might be rather disconnected from the network as a whole. In this case, the
actor could be quite central, but only in a local neighborhood (Wasserman/ Faust, 1994). However, closeness centrality emphasizes the distance of an actor to all others in the network by focusing on the geodesic distance from each actor to all others. The sum of these geodesic distances for each actor is the “farness” of the actor from all others. This can be converted into a measure of nearness or closeness centrality by taking the reciprocal (one divided by the farness) and normalizing it relative to the most central actor (Table II).
Table II: Closeness Centrality
inFarness outFarness inCloseness outCloseness --- --- --- --- 3 Mk 49.000 552.000 46.939 4.167 1 Ot 54.000 231.000 42.593 9.957 16 Nk 59.000 217.000 38.983 10.599 8 Hy 70.000 235.000 32.857 9.787 13 Sa 74.000 224.000 31.081 10.268 2 Ma 75.000 234.000 30.667 9.829 12 Bn 77.000 237.000 29.870 9.705 14 Sp 78.000 224.000 29.487 10.268 6 Gk 78.000 222.000 29.487 10.360 18 Bk 93.000 234.000 24.731 9.829 17 Ba 94.000 234.000 24.468 9.829 11 Ak 94.000 227.000 24.468 10.132 15 Bd 95.000 223.000 24.211 10.314 10 Ey 97.000 232.000 23.711 9.914 4 Mp 97.000 232.000 23.711 9.914 5 Ck 97.000 232.000 23.711 9.914 23 Ca 507.000 206.000 4.536 11.165 7 Oe 529.000 208.000 4.348 11.058 21 Ay 529.000 164.000 4.348 14.024 22 Ms 529.000 160.000 4.348 14.375 9 Be 552.000 223.000 4.167 10.314 19 Gs 552.000 223.000 4.167 10.314 20 Oe 552.000 223.000 4.167 10.314 24 Ss 552.000 186.000 4.167 12.366
Actor Mk is the closest, or most central, actor using this method, because the sum of Mk’s geodesic distances to other actors (a total of 25) is the least. Two other actors, Ot and Nk, are nearly as close and thus are highly central individuals. Ca, Oe, Ay, Ms, Be, Gs, Oe, and Ss, on the other hand, have the greatest farness.
iii. Betweenness Centrality
Betweenness centrality views an actor as being in a favored position to the extent that the actor falls on the geodesic paths between other pairs of actors in the network. That is, the more individuals that depend on one individual to make connections with other individuals, the more power the one individual has. Using UCINET, it is easy to locate the geodesic paths between all pairs of actors, and to count up how frequently each actor falls in each of these pathways. If we add up, for each actor, the proportion of times that they are “between” other actors for sending information we get the measure of actor betweenness centrality. This measure can be normalized by expressing it as a percentage of the maximum possible betweenness that an actor could have had. The results from UCINET are shown in Table III.
Table III: Freeman Betweenness Centrality Betweenness nBetweenness --- --- 16 Nk 218.000 43.083 1 Ot 119.000 23.518 6 Gk 85.500 16.897 13 Sa 46.000 9.091 2 Ma 41.000 8.103 8 Hy 21.000 4.150 18 Bk 10.500 2.075 12 Bn 8.333 1.647 17 Ba 6.500 1.285 14 Sp 4.583 0.906 11 Ak 3.667 0.725 22 Ms 2.333 0.461 15 Bd 2.083 0.412
7 Oe 0.500 0.099 9 Be 0.000 0.000 4 Mp 0.000 0.000 5 Ck 0.000 0.000 3 Mk 0.000 0.000 19 Gs 0.000 0.000 20 Oe 0.000 0.000 21 Ay 0.000 0.000 10 Ey 0.000 0.000 23 Ca 0.000 0.000 24 Ss 0.000 0.000
It can be seen that there is a great deal of variation in actor betweenness. Nk, Ot, and Gk appear to be more central than others by this measure. Clearly, there is a structural basis for these actors to perceive that they are “different” from others in the population. Indeed, it would not be surprising if these three actors saw themselves as the most central in the organization’s governance.
iv. Flow betweenness: Dynamics of Nonprofit Governance
The betweenness centrality measure characterizes actors as having positional advantage to the extent that they fall on the shortest pathway (geodesic) between other pairs of actors. The idea is that actors who are “between” other actors, and on whom other actors must depend to conduct exchanges, will be able to translate this central intermediary role into power.
The flow betweenness represents dynamics of relationships in nonprofit governance. If the two actors want to have working relationships, but the geodesic path between them is blocked by an unwilling individual and if there is another pathway, the two actors are likely to use it, even if it is longer and “less efficient.” In general, actors may use all of the pathways connecting them, rather than just shortest (geodesic) paths. The flow betweenness approach to centrality expands the notion of betweenness centrality. It assumes that actors will use all pathways that connect them to others proportionally to the length of the pathways. Betweenness is measured by the proportion of the entire flow between two actors that occurs on paths which connect them. For each actor, then, the measure adds up how involved that actor is in all of the flows between all other pairs of actors (Wasserman/ Faust, 1994). Since the magnitude of this index number would be expected to increase with the size of the network and
with network density, it is useful to standardize it by calculating the flow betweenness of each actor in ratio to the total flow betweenness that does not involve the actor (Everett / Borgatti, 1999).
Table IV: Flow Betweenness FlowBet nFlowBet --- --- 1 Ot 269.000 53.162 2 Ma 44.500 8.794 3 Mk 0.000 0.000 4 Mp 0.167 0.033 5 Ck 0.167 0.033 6 Gk 64.367 12.721 7 Oe 0.500 0.099 8 Hy 1.583 0.313 9 Be 0.000 0.000 10 Ey 0.167 0.033 11 Ak 0.700 0.138 12 Bn 0.500 0.099 13 Sa 23.500 4.644 14 Sp 0.367 0.072 15 Bd 0.367 0.072 16 Nk 298.983 59.088 17 Ba 0.833 0.165 18 Bk 1.167 0.231 19 Gs 0.000 0.000 20 Oe 0.000 0.000 21 Ay 0.250 0.049 22 Ms 0.500 0.099 23 Ca 0.250 0.049 24 Ss 0.000 0.000
By this more complete measure of betweenness centrality, Nk, Ot, Gk, and Ma are clearly the most important mediators. Sa and Hy, who were fairly important when only geodesic flows were considered, appear to be rather less
important by this calculation. While the overall picture does not change a great deal, the elaborated definition of betweenness does give us a somewhat different impression of who is most central in this nonprofit governance network.
Cliques and Sub-groups: Groupings of Organizational Relations
Networks are also built up, or developed, out of the combining of dyads and triads into larger, but still closely connected, sub-structures. Many of the approaches to understanding the structure of a network emphasize how dense connections are compounded and extended to develop larger “cliques” or sub-groupings (Wasserman/ Faust, 1994). A clique is simply a sub-set of actors who are more closely tied to each other than they are to actors who are not part of the group. This view of social networks focuses attention on how the connection of large networks structures can be built up out of small and tight components: cliques, n-cliques, n-clans, and k-plexes (Hanneman, 2001; Scott, 2000).
Division of actors into cliques is a very important aspect of networks. It is important in understanding how the network as a whole is likely to behave. For example, suppose the actors in one network form two non-overlapping cliques; and, suppose that the actors in another network also form two cliques, but that the memberships overlap (some individuals are members of both cliques). Where the groups overlap, it can be expected that conflict between them is less likely than when the groups do not overlap (Hanneman, 2001). Where the groups overlap, resources can be mobilized and shared effectively across the entire nonprofit governance network; where the groups do not overlap, resource sharing may occur in one group and not occur in others and between groups.
Knowing how an individual is embedded in the structure of groups within a network may also be important to understanding its behavior. For example, some individuals may act as “bridges” between groups (boundary spanners). Other individuals may have all of their relationships within a single clique (locals). Some actors may be part of a tightly connected group, while others are completely isolated from this group. Such differences in the ways that individuals are embedded in the structure of groups within a network can have profound consequences for the ways that these actors see the nonprofit governance and the behaviors that they are likely to practice to sustain or dysfunction the organizational effectiveness (Cross vd., 2003).
“Strong ties” and “weak ties” (Granovetter, 1973) were analyzed by symmetrizing the data. The data was symmetrized3 by insisting that ties must
be reciprocated in order to be counted; that is, a tie only exists if “xy” and “yx” are both present. Insisting that information move in both directions between the parties in order for the two parties to be regarded as “close” makes theoretical sense, and substantially lessens the density of the matrix. The resulting symmetric data matrix looks like this:
Table V: Cliques (minimum set size 4)
1: Ot, Ma, Mp, Gk, Hy 2: Ot, Ma, Ck, Gk, Hy. 3: Ot, Ma, Gk, Hy, Ey 4: Ot, Ma, Ba, Bk
5: Ot, Sa, Bd, Nk 6: Ot, Hy, Bd, Nk
7: Ot, Gk, Hy, Nk 8: Ak, Bn, Sa, Nk
9: Sa, Nk, Ms, Ca
Table V suggests a number of things: Ot, Ma, Hy, and Nk appear to be in the middle of the nonprofit governance network in the sense that they are members of many of the groupings, and serve to connect them, by co-membership. The connection of sub-graphs by actors can be an important feature. It can also be seen that there is one case (Be) that is not a member of any sub-group (other than a dyad). Despite the substantial connectivity of the graph, tight groupings larger than this seem to be few. It is also apparent from visual inspection that most of the sub-groupings are connected (overlapped) (Figure I).
The strongest possible definition of a clique is some number of actors, greater than two, who have all possible ties present among themselves. A “Maximal Complete Sub-Graph” is such a grouping, expanded to include as many actors as possible. There are nine maximal complete sub-graphs present in these data. It might be interesting to assess the extent to which these sub-structures overlap, and which actors are most “central” and most “isolated” from the cliques. These questions can be examined by looking at “co-membership” structure.
In Figure I, it is apparent that Ot and Nk overlap with almost all other actors in at least one clique. These actors are “closest” in the sense of sharing
3 It means to render symmetrical or perfectly balanced, symmetri’zation of a dissimilarity matrix.
membership in four of the nine cliques. This kind of analysis can be taken one step further by using single linkage agglomerative cluster analysis to create a “joining sequence” based on how many clique memberships actors have in common. It can be seen that actors Ot and Hy are “joined” first as being close because they share five clique memberships in common. At the level of sharing only three clique memberships in common, actors Ma and Gk “join the core” (Appendix 1). If no clique membership in common was required to define group membership, then all actors are joined. Insisting that every member of a clique be connected to every other member is a very strong definition of a group. There are a number of ways in which this restriction can be relaxed. Three major approaches are the n-clique, n-clan, and the k-plex approaches (Hanneman, 2001).
i. N-cliques
The strict clique definition may be too strong for many purposes. It insists that every member or a sub-group have a direct tie with each and every other member. There is a possibility that in some cases “cliques” may form where at least some members are not so tightly or closely connected. There are techniques that relax the “clique” definition to try to make it more helpful and general. One way of relaxing the definition of a clique is to define an actor as a member of a clique if the actor is connected to every other member of the group at some distance greater than one. Usually, the path distance two is used, similar to “a friend of a friend” in social relationships. This approach to defining sub-structures is called n-clique, where n stands for the length of the path allowed in making a connection to all other members (Cross/ Parker, 2004; Krackhardt, 1999). After applying the n-clique definition to the data, the following result was obtained.
Table VI: N-cliques4
1: Ot, Mk, Gk, Oe, Hy, Ak, Bn, Sa, Sp, Bd, Nk, Ay, Ms, Ca, Ss 2: Ot, Ma, Mk, Mp, Ck, Gk, Oe, Hy, Ey, Sa, Sp, Bd, Nk 3: Ot, Ma, Mk, Mp, Ck, Gk, Oe, Hy, Ey, Sa, Bd, Nk, Ba, Bk 4: Ot, Ma, Mp, Ck, Gk, Oe, Hy, Be, Ey, Sa, Bd, Nk, Ba, Bk, Oe 5: Ot, Ma, Mk, Gk, Nk, Ba, Bk, Gs
The cliques become more inclusive by the relaxed definition of group membership. Because of the definition of how closely individuals in a clique are linked has been relaxed, there are fewer maximal cliques. With the more relaxed definition, there is now an “inner circle” of actors that are members of both larger groupings. This can be seen in the co-membership matrix, and by clustering (Appendix 2). An examination of the clique co-memberships and a clustering of closeness under n-clique definition of a clique give a slightly different picture than the strong-tie approach. Actors #6 (Gk) and #16 (Nk) form a “core” in this method as opposed to the #1 (Ot) and #8 (Hy) by the maximal method.
ii. N-clans
The n-clique approach tends to find long and tough groupings rather than the tight and discrete ones of the maximal approach. In some cases, n-cliques can be found that have a property that is probably undesirable for many purposes: it is possible for members of n-cliques to be connected by actors who are not members of the clique (Hanneman, 2001). This can be troublesome for some managerial/policy implications. For this reason, it is suggested that restricting n-cliques by insisting that the total span or path distance between any two members of an n-clique also satisfy a condition. This kind of a restriction has the effect of forcing all ties among members of an n-clique to occur by way of other members of the n-clique. This approach is called the n-clan approach. With this relaxed approach members of the cliques (below) increased and almost all the actors were included (Table VII and Appendix 3). This method does not help us to identify the critical individuals in the network. However, it tells us the major actors play a role in the nonprofit governance network.
Table VII : N-Clans5
1: Ot, Mk, Gk, Oe, Hy, Ak, Bn, Sa, Sp, Bd, Nk, Ay, Ms, Ca, Ss 2: Ot, Ma, Mk, Mp, Ck, Gk, Oe, Hy, Ey, Sa, Sp, Bd, Nk 3: Ot, Ma, Mk, Mp, Ck, Gk, Oe, Hy, Ey, Sa, Bd, Nk, Ba, Bk 4: Ot, Ma, Mp, Ck, Gk, Oe, Hy, Be, Ey, Sa, Bd, Nk, Ba, Bk, Oe 5: Ot, Ma, Mk, Gk, Nk, Ba, Bk, Gs
The n-clique and n-clan approaches provide an alternative to the stricter clique definition, and this more relaxed approach often makes good sense with social network data. Almost all the actors played a role in the nonprofit governance regardless of the significance of their role. In essence, the n-clique approach allows an actor to be a member of a clique even if they do not have ties to all other clique members, just so long as they do have ties to some member and are no further away than n steps (usually two) from all members of the clique. The clan approach is a relatively minor modification on the n-clique approach that requires that the all the ties among actors occur through other members of the group. The other alternative way of relaxing the strict assumptions of the clique definition is the K-plex approach.
iii. K-plexes
An alternative way of relaxing the strong assumptions of the maximal complete sub-groups is to allow that actors may be members of a clique even if they have ties to all but k other members. For example, if Ot has ties with Nk and Gk, but not Ma while both Nk and Gk have ties with Ma, all four actors could fall in a clique under the k-Plex approach. This approach says that a node is a member of a clique of size n if it has direct ties to n-k members of that clique. The k-plex approach would seem to have quite a bit in common with the n-clique approach, but k-plex analysis often gives quite a different picture of the sub-structures of a graph. K-plex analysis tends to find relatively large numbers of smaller groupings (Hanneman, 2001). In Figure III, k=2. That is, an actor is considered to be a member of a k-plex if that actor has ties to all but two others in that clique.
Ot, Nk, and Ma are present in every k-component. Clearly these actors are “central” in the sense of playing a bridging role among multiple actors. Again it is noted that actor #24 (Sa), for example, is not a member of any k-plex. The k-plex method of defining cliques tends to find “overlapping circles” when compared to the maximal or n-clique method. The k-plex approach to defining sub-structures makes a good deal of sense for many problems. It requires that members of a group have ties to other group members as do cliques. These ties make sharing information possible in the nonprofit governance network.
Figure III: K- Plex6 1 1 1 1 2 1 1 2 1 1 1 1 2 2 2 Level 7 8 9 4 5 9 0 0 7 2 1 1 4 5 1 2 8 3 6 6 3 2 3 4 --- - - - 25.000 . . . . . . . . . . . . . XXX . . . 20.000 . . . XXX . . . XXX . . . 11.667 . . . XXX . . XXXXX . . . 10.667 . . . XXXXX . XXXXX . . . 9.500 . . . XXXXX XXXXXXX . . . 7.760 . . . X X X X X X X X X X X XX . . . 5.800 . . . X X X XX X X X XX X X X X X . . . 4.858 . . . X X X X X X X X X X X X X XXXX . . . 4.296 . . . X X X X X X X X X X X X X X X X X X . . 4.000 XXX . . . X X X X X X X X X X X X X X X XX X . . 3.000 X X X X X . . . XX XX X X X X X X X XX X X X X X X . . 2.928 X X X X X . . . . . . . X X X X X X XX X XX XX XX XXX XX X . 1.792 X X X X X . . . X X X X X X X X X X X XX XXX XXX XX X X . 1.616 X X X X X . . . XX X X XX X X XX XX X X XX XX X X XX X X X . 1.572 X X X X X . . . X X X X X X XX X X X X X X X X X X XX X X X X X . 1.514 X X X X X . . . X XX XX XX XX XX XX XX XX X X X X X X X X X X X X . 1.406 X X X X X . . . X XX X XX X XX X X X X X XXX XXXXX XXXXXX X X X 1.000 X X X X X X X X X X X X X X X X XXX X X XX XX XX X X XXXX XX XXX XXX X X X X 0.400 X X X XX X X XX X XX X X X X X XXX XX XX XX XXXXXX XXX XX X XXX X X X X X 0.148 X X X X X X X X X X XX XX X XX X XX XX XXXXXX XX XX XXXX X X XXXX XXX X X
Conclusion
Valuing the friendships and the importance of those ties was important to the members of the nonprofit organization. In an interview, one member had stated the group might become complacent over the years. There are practices
6 Value of K: 2, each member of a K-plex of size N has N-K ties to other members) Minimum Set Size =3
and policies that could be implemented in the nonprofit structure to facilitate the strength of weak ties feature of the structural dimension. One policy is mandatory term limits combined with active board renewal. Term limits would necessitate the end of one particular board member’s tenure. Active board renewal would bring new people continuously into the mix. Establishing real working committees to gather data and bring it to the full board might accomplish a few things. One, it would reduce the full board time spent on absorption of data, reduce the unnecessary tension between staff and the board, and provide more time for discussion. Most importantly, it may help develop new ways of exchanging and combining information and resources and mimic the weak ties of interaction that are the best fit for the maximization of value creation through social capital.
This paper developed several arguments to promote the effectiveness of nonprofit governance, and discussed ways that information derived from network analysis could be used to promote nonprofit effectiveness. One argument is that within an organization, appropriate ties amongst board members, staff, and volunteers are integral to the ability to discuss information and make decisions. Two, that appropriate ties are developed within the structural dimension of social capital. And finally, that social capital will lead to value creation for the organization. It would be good to note that there is a dark side to social capital – cliques may relate very well and intensely with one another (bonding social capital) and be in direct conflict with the organization’s goal, as when informal work norms serve to depress productivity. A key element would seem to be to determine whether the social capital of an organization is of the bonding or bridging variety.
Network analysis can be helpful to an organization’s awareness of its network’s structure. The analysis results can focus an organization’s discussions and actions on effective nonprofit governance.
References
BAKER, W. (2000), Achieving Success through Social Capital: Tapping the Hidden Resources in Your Personal and Business Networks (San Francisco: Jossey-Bass).
BORGATTI, S.P./ EVERETT, M.G. / FREEMAN, L.C. (2002), UCINET 6.0. (Harvard: Analytic Technologies).
BRYSON, J. M. (1995), Strategic Planning for Public and Nonprofit Organizations: A Guide to Strengthening and Sustaining Organizational Achievement (San Francisco: Jossey-Bass).
BURT, R. S. (1992), Structural Holes: The Social Structure of Competition (Cambridge, MA: Harvard University Press).
BUTTS, C. / CARLEY, K.M. (2001), Multivariate Methods for Inter-structural Analysis (CASOS Working Paper, CMU, www.casos.ece.cmu.edu).
CARLEY, K. M. (1999), “On the Evolution of Social and Organizational Networks,” ANDREWS, Steven B. / KNOKE, David (eds.), Networks In and Around Organizations Vol 16 (Stamford, CT: JAI Press): 3-30.
CARVER, J. (2002), John Carver on Board Leadership: Selected Writings from the Creator of the World’s Most Productive Mind and Systematic Governance Model (New York: Jossey-Bass).
CARVER, J. (1997), Boards that make a difference: A new design for leadership in nonprofit and public organizations (San Francisco: Jossey-Bass Publications).
CARVER, J. / CARVER, M. (2006), Reinventing Your Board, Revised Edition (San Francisco: Jossey-Bass).
CHAIT, R. P/ RYAN, W/ TAYLOR, B.E. (2005), Governance as Leadership: Reframing the Work of Nonprofit Boards (Hoboken, NJ: BoardSource, Inc).
CHISHOLM, D. (1995), “Problem Solving and Institutional Design,” Journal of Public Administration Research and Theory, 5: 451-491.
CHISHLOM, R. F. (1998), Developing Network Organizations: Learning from Practice and Theory (New York: Addison-Wesley).
CHRISLIP, D. D. / LARSON, C. E. (1994), Collaborative Leadership: How Citizens and Civic Leaders Can Make a Difference (San Francisco: Jossey-Bass).
COLEMAN, J. (1988), Foundations of Social Theory (Cambridge, MA: Harvard University Press). COLEMAN, J. (1990), “Social Capital in the Creation of Human Capital,” American Journal of
Sociology, 94: 95-120.
CROSS, R./ PARKER, A. (2004), The hidden power of social networks: understanding how work really gets done in organizations (Boston, MA: Harvard Business School Press). CROSS, B. / BORGATTI, S. P. / PARKER, A. (2003), “Making Invisible Work Visible: Using Social
Network Analysis to Support strategic Collaboration,” CROSS, R. / PARKER, A. / SASSON, L. (eds.), Networks in the Knowledge Economy (Oxford: Oxford University Press).
DRUCKER, P. F. (1990), Managing the non-profit organization (New York: Harper Collins Publishers).
EVERETT, M. G./ BORGATTI, S. P. (1999), “The centrality of groups and classes,” Journal of Mathematical Sociology, 23/3: 181-201.
FREEMAN, L. C. (1979), “Centrality in social networks: Conceptual clarification,” Social Networks, 1: 215-239.
FREEMAN, L. C./ WHITE, D. R. / ROMNEY, A. K. (eds.). (1992), Research Methods in Social Network Analysis (New Brunswick, NJ: Transaction Publisher).
FUKUYAMA, F. (1995), Trust: The Social Virtues and the Creation of Prosperity (New York: The Free Press).
GRANOVETTER, M. (1973), “The Strength of Weak ties,” American Journal of Sociology, 78: 1360-1380.
HANNEMAN, R. A. (2001), Introduction to Social Network Methods (Available online at: www.faculty.ucr.edu/~hanneman).
HARDIN, R. (1982), Collective Action (Baltimore, MD: Published for Resources for the Future by the Johns Hopkins University Press).
HOWE, F. (1995), Welcome to the Board (San Francisco: Jossey-Bass Inc.).
HUDSON, M. (2005), Managing at the Leading Edge: New Challenges in Managing Nonprofit Organizations (San Francisco: Jossey-Bass).
IBARRA, H. (1993), “Network Centrality, Power and Innovation Involvement: Determinants of Technical and Administrative Roles,” Academy of Management Journal, 36/3: 471-501.
KRACKHARDT, D. (1999), “Ties That Torture: Simmelian Tie Analysis in Organizations,” Research in the Sociology of Organizations, 16: 183-210.
KRAMER, R. (1999), “Trust and Distrust in Organizations: Emerging perspectives, Enduring Questions,” Annual Review of Psychology, 50: 569-598.
LEWIS, R. L. (2001), Effective Nonprofit Management: Essential Lessons for Executive Directors (Gaithersburg, MA: Aspen Publishers, Inc.).
LIGHT, M. (2001), The strategic board (New York: John Wiley & Sons).
LIN, N. (1999), “Social Networks and Status Attainment,” Annual Review of Sociolog, 25: 467-487.
MOORE, M. (1995), Creating public value: strategic management in government (Cambridge, MA: Harvard University Press).
NAHAPIET, J./ GHOSHAL, S. (1998), “Social Capital, Intellectual Capital, and the Organizational Advantage,” Academy of Management Review, 23/2: 242–266.
NOHRIA, N. / ECCLES, R. (eds.). (1992), Networks and Organizations (Cambridge, MA: Harvard Business School Press).
OSTROM, E. (2003), “Toward a Behavioral Theory Linking Trust, Reciprocity, and Reputation,” OSTROM, Elinor / WALKER, James (eds), Trust and Reciprocity: Interdisciplinary Lessons from Experimental Research (New York: Russell Sage Foundation).
OTT, S. J. (Ed). (2001), Understanding Nonprofit Organizations: Governance, Leadership, and Management. Boulder (CO: Westview Press).
PAPPAS, A. T. (1996), Reengineering Your Nonprofit Organization: A Guide to Strategic Transformation (New York: John Wiley & Sons, Inc.).
PENTLAND, B. T. (1999), “Organizations as Networks of Actions,” BAUM, Joel A.C. / MCKELVEY, Bill (eds.), Variations in Organization Science: In Honor of Donald T. Campbell (Thousand Oaks, CA: SAGE Publications).
POWELL, W. W. (1990), “Neither market nor hierarchy: Network form of organization,” STAW, B. M. / CUMMINGS, L. L. (eds.), Research in Organizational Behavior, 12: 295-336. PUTNAM, R. D. (2000), Bowling alone: the collapse and revival of American Community (New
York: Simon & Schuster).
PUTNAM, R. D. (1993), Making Democracy Work: Civic Traditions in modern Italy (New Jersey: Princeton University Press).
ROBINSON, M. K. (2001), Nonprofit boards that work (New York: John Wiley & Sons). SCOTT, J. (2000), Social Network Analysis (Thousand Oak, CA: SAGE Publications).
TAYLOR, B. E./ CHAIT, P. R./ HOLLAND, T. (1999), The New Work of the Nonprofit Board (Harvard Business Review on Nonprofits, Harvard Business School Press).
TSAI, W./ GHOSHAL, S. (1998), “Social capital and value creation: The role of intrafirm networks,” Academy of Management Journal, 4/1: 464-476.
WASSERMAN, S. / FAUST, K. (1994), Social Network Analysis: Methods and Applications (New York: Cambridge University Press).
WOLF, T. (1999), Managing A Nonprofit Organization in the Twenty-First Century (New York: Simon & Schuster).
Appendix 1: Hierarchical Clustering of Equivalence Matrix 1 1 2 2 1 1 1 1 1 1 1 1 2 2 2 Level 3 7 9 4 9 0 1 7 8 0 5 4 1 2 2 6 1 8 5 3 6 2 3 4 --- - - - 5.000 . . . XXX . . . 4.000 . . . XXXXX . . . 3.250 . . . XXXXXXX . . . 3.000 . . . XXXXXXX . XXX . . . 1.667 . . . XXXXXXX XXXXX . . . 1.050 . . . XXXXXXXXXXXXX . . . 1.000 . . . XXX . . . XXX XXXXXXXXXXXXX XXX . 0.477 . . . XXX . . . XXXXXXXXXXXXXXXXX XXX . 0.390 . . . XXX . . . XXXXXXXXXXXXXXXXXXXXX . 0.134 . . . XXX . . XXXXXXXXXXXXXXXXXXXXXXX . 0.124 . . . XXX . XXXXXXXXXXXXXXXXXXXXXXXXX . 0.115 . . . XXX XXXXXXXXXXXXXXXXXXXXXXXXXXX . 0.043 . . . XXXXXXXXXXXXXXXXXXXXXXXXXXXXXXX . 0.000 XXXXXXXXXXXXXXXXXXXXXXXXXXXXXXXXXXXXXXXXXXXXXXX
Appendix 2: Hierarchical Clustering of Equivalence Matrix
1 1 1 1 1 1 1 2 1 1 1 2 2 2 2 Level 9 4 5 0 7 8 3 5 3 2 6 6 1 7 8 9 0 1 2 4 1 2 3 4 --- - - - 5.000 . . . XXXXX . . . 4.000 . . . . XXXXXXX . XXXXXXX . . . 3.800 . . . . XXXXXXX XXXXXXXXX . . . 3.667 . . . . XXXXXXXXXXXXXXXXX . . . 3.000 . XXXXX XXXXXXXXXXXXXXXXX XXX . . . 2.885 . XXXXXXXXXXXXXXXXXXXXXXX XXX . . . 2.462 . XXXXXXXXXXXXXXXXXXXXXXXXXXX . . . 1.000 . XXXXXXXXXXXXXXXXXXXXXXXXXXX XXX XXXXXXXXXXXXX 0.957 . XXXXXXXXXXXXXXXXXXXXXXXXXXXXXXX XXXXXXXXXXXXX 0.371 XXXXXXXXXXXXXXXXXXXXXXXXXXXXXXXXX XXXXXXXXXXXXX 0.149 XXXXXXXXXXXXXXXXXXXXXXXXXXXXXXXXXXXXXXXXXXXXXXX
Appendix 3: Hierarchical Clustering of Equivalence Matrix
1 1 1 1 1 1 1 2 1 1 1 2 2 2 2 Level 9 4 5 0 7 8 3 5 3 2 6 6 1 7 8 9 0 1 2 4 1 2 3 4 --- - - - 5.000 . . . XXXXX . . . 4.000 . . . . XXXXXXX . XXXXXXX . . . 3.800 . . . . XXXXXXX XXXXXXXXX . . . 3.667 . . . . XXXXXXXXXXXXXXXXX . . . 3.000 . XXXXX XXXXXXXXXXXXXXXXX XXX . . . 2.885 . XXXXXXXXXXXXXXXXXXXXXXX XXX . . . 2.462 . XXXXXXXXXXXXXXXXXXXXXXXXXXX . . . 1.000 . XXXXXXXXXXXXXXXXXXXXXXXXXXX XXX XXXXXXXXXXXXX 0.957 . XXXXXXXXXXXXXXXXXXXXXXXXXXXXXXX XXXXXXXXXXXXX 0.371 XXXXXXXXXXXXXXXXXXXXXXXXXXXXXXXXX XXXXXXXXXXXXX 0.149 XXXXXXXXXXXXXXXXXXXXXXXXXXXXXXXXXXXXXXXXXXXXXXX