IN VIVO AND IN VITRO ANALYSES OF mRNA EXPRESSION OF ROBO2 IN ZEBRAFISH IN THE CONTEXT OF PI3K/AKT/TOR PATHWAY
A THESIS SUBMITTED TO
THE DEPARTMENT OF MOLECULAR BIOLOGY AND GENETICS AND THE INSTITUTE OF ENGINEERING AND SCIENCE OF
BILKENT UNIVERSITY
IN PARTIAL FULFILMENT OF THE REQUIREMENTS FOR THE DEGREE OF MASTER OF SCIENCE
BY
ERTUĞRUL DALKIÇ AUGUST 2006
I certify that I read this thesis and that in my opinion it is fully adequate, in scope and in quality, as a thesis for the degree of Master of Science
________________________ Asst. Prof. K. Can Akçalı
I certify that I read this thesis and that in my opinion it is fully adequate, in scope and in quality, as a thesis for the degree of Master of Science
________________________ Dr. Sreeparna Banerjee
I certify that I read this thesis and that in my opinion it is fully adequate, in scope and in quality, as a thesis for the degree of Master of Science
________________________ Asst. Prof. Özlen Konu
Approved for Institute of Engineering and Science.
________________________ Director of Institute of Engineering and Science Prof. Dr.
ABSTRACT
IN VIVO AND IN VITRO ANALYSES OF mRNA EXPRESSION OF ROBO2 IN ZEBRAFISH IN THE CONTEXT OF PI3K/AKT/TOR PATHWAY
Ertuğrul Dalkıç
M.Sc. in Molecular Biology and Genetics Supervisor: Asst. Prof. Özlen KONU
August 2006, 81 pages
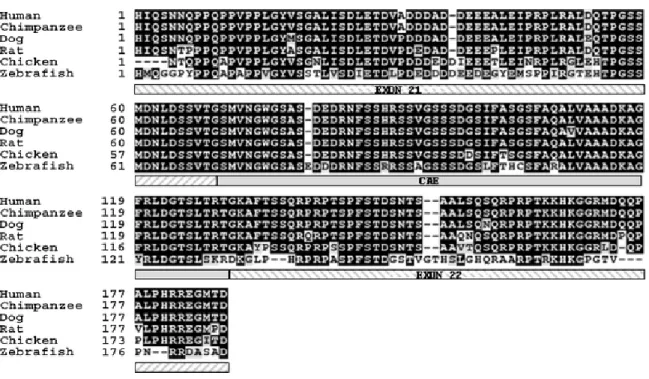
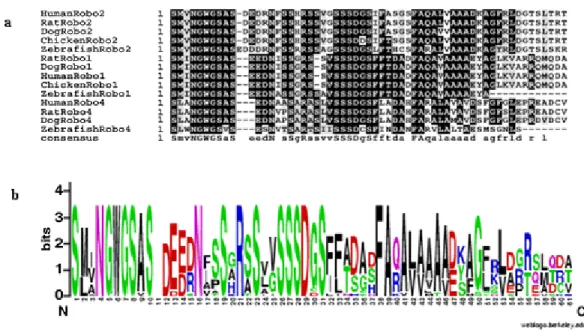
Robo2 is an axon guidance receptor, well-known for its repulsive role in the nervous system. In addition, Robo2 might regulate cell migration both during embryogenesis or in adulthood. In this study, a novel isoform of the zebrafish robo2 (robo2_tv2), which included an otherwise alternatively spliced exon (CAE), has been characterized. Robo2_tv2 was expressed differentially in most non-neuronal tissues of adult zebrafish whereas Robo2_tv1 expression to a great extent was restricted to the brain and eye. Our findings demonstrated that the amino acid sequence coded by CAE of the Robo2 gene was highly conserved between zebrafish and mammals, and also contained conserved motifs shared with Robo1 and Robo4 but not with Robo3. Furthermore, we provided an account of differential transcription of the CAE homolog in various tissues of the adult rat. These results has suggested that the alternatively spliced Robo2 isoforms may exhibit tissue specificity.
In addition, we investigated the transcriptional neighbors of Robo2 based on computational and experimental methods. Bioinformatics analysis of a published zebrafish microarray data by Mathavan et al. (2005) demonstrated that Robo2 expression might be correlated with a number of genes involved in the PI3K/AKT/GSK3B/TOR signaling; these genes included Rheb, Gsk3alpha, PP2A, and several Wnt signaling members. Analysis of a conserved coexpression network (Stuart et al. 2003) also placed Robo2 and Tor as indirect neighbors. Accordingly, several PI3K/AKT/GS3B/TOR signaling members, namely, Pik3r2, Akt2, Gsk3b were characterized in terms of their sequence conservation and tissue-specific expressions for the first time in zebrafish. Phylogenetic analysis has shown that these genes were moderately to highly conserved among different vertebrate taxa. RT-PCR and real-time RT-PCR analyses in various adult tissues and under specific growth-regulatory conditions (e.g., TOR inhibition, and serum starvation) suggested that Tor, Pi3kr2, Akt2 and Gsk3b mRNA might be regulated at the transcriptional level. However, these preliminary findings need to be further confirmed by using multiple independent experiments due to high variability and small fold changes that characterized the expression levels.
Future studies are planned to identify functional relevance for the alternative usage of CAE and determine how different isoforms respond to conditions that modulate cell growth/proliferation pathways involved in cellular stress conditions including cancer.
ÖZET
ZEBRABALIĞINDA ROBO2’NİN PI3K/AKT/TOR YOLĞIYLA İLİŞKİLİ OLARAK IN VIVO VE IN VITRO IFADE ANALİZİ
Ertuğrul Dalkıç
Master Tezi Moleküler Biyoloji ve Genetik Tez Yöneticisi: Yard. Doç. Özlen KONU
Ağustos 2006, 81 sayfa
Robo2 sinir sisteminin önemli bir akson rehberliği reseptörüdür. Slit reseptörü olan bu protein, aksonların büyüme bölgelerinde itici bir görev üstlenir. Bunun yanında, normal hücre göçünde de rolü olduğu bilinmektedir. Bu çalışmada, zebrabalığında robo2 geninin yeni bir izoformu (robo2_tv2) bulunmuştur. Bu izoform alternatif olarak normalde kullanılmayan bir korunmuş alternatif egzonu (CAE) içermektedir. Robo2_tv2 farklı şekillerde sinirsel olmayan hücrelerde ifade edilirken, robo2_tv1 ifadesi göz ve beyin gibi sinirsel hücrelerle sınırlıdır. Bulgularımız CAE ye denk düşen amino asit sekansının zebrabalığı ve memeliler arasında önemli ölçüde korunduğunu göstermiştir. Ayrıca CAE amino asit sekansının robo1 ve robo4’te de korunduğunu bulduk. Zebrabalığının yanında sıçanda yaptığımız çalışmalar da alternatif CAE kullanımının değişik erişkin hayvan dokularında korunduğunu gösterdi. Bu sonuçlar, alternatif robo2 izoformlarının dokulara özel olarak kullanımını önermektedir.
Bunun yanında, robo2 geninin PI3K/AKT/TOR yolağı üyeleriyle olası bir yakınlığı deneysel ve bilgisayar destekli çalışmalar sonucu gösterilmiştir. Mathavan et al. (2005) mikroarray çalışmasının biyoinformatik analizi Robo2 nin PI3K/AKT/TOR yolağı üyeleriyle ilişkili olduğunu gösterdi. Bu genler arasında Rheb, Gsk3alpha, PP2A ve birçok Wnt sinyal yolağı üyesi yer aldı. Stuart el al. (2003) korunmuş birlikte ifade ağı analizi Robo2 ve Tor u indirekt komşu olarak gösterdi. Pik3r2, Akt2, Gsk3b genleri sekans ve ifade olarak analiz edildi ve zebrabalığında korunduğu gösterildi. Rapamycin verilmesi ve serum değerinin değiştirilmesi sonrasında bu ilginilen genlerin ifadeleri RT-PCR ve real-time RT-PCR metodlarıyla analiz edildi ve bu genlerin bahsi geçen koşullarda transkript olarak değişik ifadelerde bulunabileceği gösterildi ancak bu deneylerdeki örnek sayısı istatiksel olarak geçerli bir sonuca varmak için yeterli olmamıştır.
Gelecek çalışmalarda, alternatif CAE kullanımının fonksiyonel ilişkisi çalışılacaktır. Değişik robo2 izoformlarının değişik kondisyonlardaki davranışı kanser de dahil olmak üzere çalışılacaktır.
ACKNOWLEDGEMENTS
First of all, I would like to thank to Dr. Özlen Konu for her invaluable supervision during my study.
I would like to also thank to Dr. Can Akçalı and Iraz Aydın for their help with the rat study.
I would like to acknowledge TÜBİTAK for the graduate scholarship.
I would to thank my family for always supporting me.
I would like to thank Ceren, Koray, Cem and other current and previous Konu Lab Members for their help and friendship.
I would like to thank Ender, Şerif, Hani, Güvenç, Nuri, Bala and other MBG family members for their close friendship.
This project has been funded by a grant from TÜBİTAK (TBAG-2285 (103T038)) to Özlen Konu.
TABLE OF CONTENTS
PAGE
ABSTRACT
ii
ÖZET
iii
ACKNOWLEDGEMENTS
iv
TABLE OF CONTENTS
v
LISTOF TABLES
vi
LIST OF FIGURES
vii
LIST OF GRAPHS
viii
ABBREVATIONS
ix
1. INTRODUCTION
11.1. ZEBRAFISH AS A MODEL SYSTEM 1
1.1.1. Zebrafish Development 1
1.1.2. Zebrafish as a Model for Human Disease 2 1.1.3. Molecular and Genetic Studies Using Zebrafish Cell Cultures 2
1.2. ROBO2 AS AN IMPORTANT REGULATOR OF AXON
GUIDANCE AND CELL MIGRATION 3
1.2.1. Axonal Guidance Molecules and Robo-Slit Signaling 3
1.2.2. Zebrafish Robo2 Protein 4
1.2.3. Zebrafish Robo2 mRNA Expression Studies 5 1.2.4. Non-neuronal Expression and Function of Robo2 5 1.2.5. Alternative Splicing Potential of Robo2 6
1.2.6. Axon Guidance Molecules and Cancer 7
1.3. PI3K-AKT-TOR PATHWAY 8
1.3.1. Phoshoinositide-3-kinases (PI3Ks) 8
1.3.2. v-akt murine thymoma viral oncogene homologs (AKT) 8 1.3.3. Glycogen synthase kinase 3 beta (GSK3B) 9
1.3.4. Target of Rapamycin (TOR) Complexes 9
1.3.6. Serum Starvation and PI3K-AKT-TOR pathway 12 1.3.7. Bioinformatics for Studying Gene Structure and Expression 13
2. AIM AND STRATEGY
152.1. AIM 15
2.2. STRATEGY 16
2.2.1. Computational Approach
2.2.1.1. Prediction of Robo2 Coexpression Neigbors 16
2.2.1.2. Phylogenetic Analysis 16
2.2.2. Experimental Approach
2.2.2.1. Tissue and Developmental Expression Profiles 17 2.2.2.2. Condition-specific Expression Profiles 17
3. MATERIALS AND METHODS
183.1. ANIMALS 18
3.1.1. Maintenance 18
3.1.1.1. Aquaria system and water condition 19
3.1.1.2. Housing and feeding 19
3.1.2. Breeding 19
3.1.3. Embryo Handling 19
3.2. CELL CULTURE 20
3.3. STANDARD SOLUTIONS AND BUFFERS 20
3.4. RAPAMYCIN TREATMENT OF EMBRYOS 21
3.5. DETERMINATION OF GENE EXPRESSION 19
3.5.1. Total RNA Isolation 22
3.5.2. Determination of RNA Concentrations 23
3.5.3. cDNA Amplification 24
3.5.4. Orthology Prediction and Phylogenetic Analysis 24
3.5.5. Primer Design 24
3.5.6. RT-PCR 26
3.5.7. Real Time RT-PCR 26
3.5.8. Analysis of Genomic Structure of Robo2 homologs 27 3.5.9. Analysis of Zebrafish Microarray Data 27
4. RESULTS
294.1. ALTERNATIVE SPLICING OF ROBO2 29
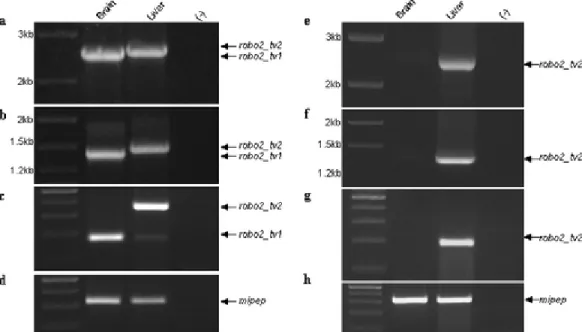
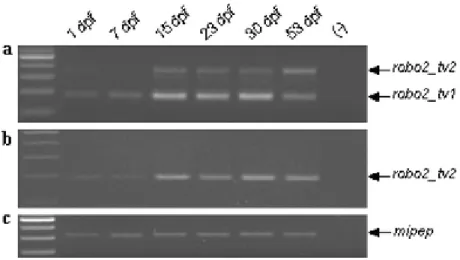
4.1.1. Comparison of Zebrafish and Rat Robo2 Sequences 29 4.1.2. Multiple Alignment of Robo2 Sequences 31 4.1.3. Expression of Robo2 Isoforms in Adult Zebrafish Tissues 34 4.1.4. Expression of Robo2 Isoforms in Embryo, Larvae and Juvenile
zebrafish 37
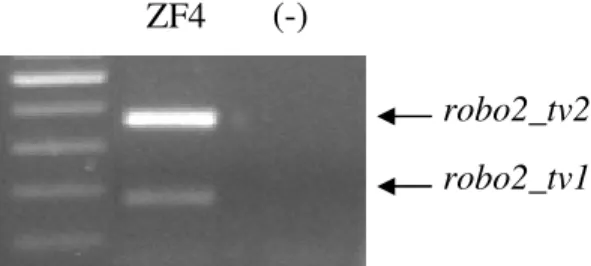
4.1.5. Expression of Robo2 Isoforms in Zebrafish Cell Culture 38 4.1.6. Expression of Robo2 Isoforms in Adult Rat Tissues 38 4.2. CONSERVATION and mRNA EXPRESSION ANALYSIS
of PI3K/AKT/TOR PATHWAY MEMBERS IN ZEBRAFISH 40 4.2.1. Phylogenetic Analyses of PI3K/AKT/TOR Pathway Members 40 4.2.2. Expression of PI3k/AKT/TOR Pathway Members in Adult
Zebrafish 46
4.3. LINKS BETWEEN ROBO2 and PI3K/AKT/TOR PATHWAY
MEMBERS 47
4.3.1. Analysis of Meta-Gene Coexpression Networks 47 4.3.2. Analysis of Pathway-Specific Gene Expressions 50 4.3.3. Determination of Primer Efficiencies for Real-Time PCR 55
4.3.4. Rapamycin experiments 55
4.3.5. Expression Profiling Under Serum Starvation 59
5. DISCUSSION AND FUTURE PERSPECTIVES
626. REFERENCES
69LIST OF TABLES
NUMBER/NAME PAGE
Table 3.1. Forward and reverse primer sets 25
Table 3.2. Conditions optimized for the PCR reactions 28 Table. 4.1. Alignment score of the amino acid sequences of
PI3K/AKT/TOR members between human and zebrafish 40
Table 4.2. Conserved Neighbors of TOR according to data of
Stuart et al. 2003 47
Table 4.3. Conserved Neighbors of Robo2 according to data of
Stuart et al. 2003 48
Table. 4.4. Conserved Neighbors of HIPK3 according to data of
Stuart et al. 2003 49
Table 4.5. List of genes that are involved in PI3K/AKT/TOR
pathway correlated with Robo2 51
Table 4.6. Amplification Efficiencies of interested genes 55 Table 4.7. Expression changes of akt2, gsk3b, pi3k, tor and robo2
genes in response to rapamycin 58
LIST OF FIGURES
NUMBER/NAME PAGE
Figure 1.1. TOR signaling network consisting of two complexes 11 Figure 4.1. The exon/intron structures of Ensembl Transcripts 30 Figure 4.2. Multiple alignment of the robo2 protein sequences 32 Figure 4.3. Multiple alignment of robo proteins and weblogo representation 33 Figure 4.4. Genomic representation and differential expression of robo2alternative isoforms in zebrafish adult tissues 34
Figure 4.5. The expression of robo2_tv1 and robo2_tv2 isoforms on
zebrafish brain and liver tissues 36
Figure 4.6. The expression of robo2 isoforms during zebrafish development 37 Figure 4.7. The expression of robo2 isoforms in ZF4 38 Figure 4.8. Genomic representation and differential expression of robo2
alternative isoforms in rat 39
Fig. 4.9. Alignments and Phylogenetic trees obtained from multiple
alignment of amino acid sequences of PI3KR2, GSK3B and AKT2 42 Figure 4.10. Expression of Akt2, Gsk3b and Pi3k in Adult Zebrafish 46
Figure 4.11. PI3K/AKT/TOR pathway related genes 53
Figure 4.12. PI3K/AKT/TOR pathway genes in Mathavan et al. 2005
that are donwregulated 54
Figure 4.13. Example amplification and melting curves for the selected
PI3K/AKT/TOR pathway genes from the rapamycin experiments 56 Figure 4.14. Example amplification and melting curves for Robo2_tv1 and
Robo2_tv2 mRNA from the rapamycin experiments 57
Figure 4.15. Mean expression changes of akt2, gsk3b, pi3k, tor and robo2
genes in response to rapamycin 57
Figure 4.16. Hiearchical clustering of Akt2, Pik3r2, Robo2_v1, Gsk3b,
and Tor 58
Figure 4.17. Example amplification and melting curves for the selected
PI3K/AKT/TOR pathway genes from the serum starvation experiments 59 Figure 4.18. Log expression changes of akt2, gsk3b, pi3k, and tor 61
ABBREVIATIONS
APS Ammonuim Persulphate
ATP Adenosine triphosphate
AMP Adenosine monophosphate
bp Base Pairs
CAE Conserved Alternative Exon
CHO Chinese Hamster Ovary
DMSO Dimethyl Sulfoxide
DNA Deoxyribonucleic Acid
dpf Days Post Fertilization
EDTA Diaminoethane Tetra-acetic Acid
EGFR Epidermal growth factor receptor
EtBr Ethidium Bromide
hpf Hours Post Fertilization
PAGE Polyacrylamide Gel Electrophoresis
PBS Phosphate Buffered Saline
PCR Polymerase Chain Reaction
PDGFR Platelet-derived growth factor receptor
PIP2 Phosphatidylinositol-4,5-bisphosphate
PIP3 Phosphatidylinositol-3,4,5-trisphosphate
RT Room Temperature
RNase Ribonuclease
TOR Target of Rapamycin
Tris Tris(Hydroxymethyl)-Methylamine
tv Transcript variant
CHAPTER I: INTRODUCTION
1.1. ZEBRAFISH AS A MODEL SYSTEM
Zebrafish is a well established model organism in the developmental biology field (Streisinger et al. 1981). There are several advantages of using zebrafish: First, it is a vertebrate, thus is evolutionarily closer to human when compared with invertebrate model organisms. This phylogenetic closeness enables researchers to highly relate the results of zebrafish studies to those performed on human biology and pathological conditions. In addition, zebrafish is easy to breed and handle in laboratory conditions; it reproduces in large numbers and externally; and has a relatively short developmental period. Another important characteristic of zebrafish is that the embryos are transparent, making the examination under light microscopy easy. Recent advances in sequencing and assembly of the zebrafish genome (Zv5, www.ensembl.org) also allow researchers to study evolutionary as well as functional relatedness of zebrafish genes to their human counterparts.
1.1.1. Zebrafish Development
The stages of zebrafish development have been studied extensively (Kimmel et al. 1995). A zygote period (0-3/4 hpf) is followed by a cleavage period (3/4-21/4 hpf), in which synchronous divisions of two blastomeres result in an embryo of 64-cells. Blastula period (21/4-51/4 hpf) is characterized by the formation of yolk syncytial layer, asynchronous divisions and cell rearrangements that lead to epiboly. Gastrula period (51/4-10 hpf) covers the formation of 50% epiboly to 100% tail bud structure; and segmentation period (10-24 hpf) is the stage somites are formed. In pharyngula period (24-48 hpf), embryo gains a body axis with somites, notochord and the brain. Finally hatching occurs between 48-72 hpf. Embryos are called larvae after hatching.
1.1.2 Zebrafish as a model for Human Disease
In addition to being a well established model for developmental biology studies, zebrafish also has been used to model human disease. In a recent study, a gene set significantly altered in zebrafish liver tumors was compared to gene sets from human tumors (Lam et al. 2005). Human homologs of zebrafish liver tumor gene set showed significant change in liver, gastric, prostate and lung tumor types, while the significance for liver was expectedly higher when compared with others (Lam et al. 2005). This high level of conservation was supported in another study that used an oncogenomic approach (Lam et al. 2006). Similarly, genomic structure, synteny, and the protein structures, i.e., important domains and highly mutated residues, of Fanconi Anemia genes also were shown to be conserved between humans and zebrafish (Titus et al. 2006). Another study showed that endocrine system of zebrafish was similar enough to that of human, indicating that whole system research could also benefit from the forward-reverse genetic techniques of zebrafish (McGonnell et al. 2006). These studies demonstrate the appropriateness of zebrafish as a model for human disease in addition to its well-known usage in development research.
1.1.3. Molecular and Genetic Studies Using Zebrafish Cell Cultures
Although, zebrafish is a powerful organism in many respects, zebrafish cell culture has not been used as widely as mammalian. On the other hand, zebrafish cell culture studies provide excellent possibilities to understand zebrafish gene structure, sequence, and function. First cell line from zebrafish was derived from one day old embryos, generating a fibroblast-like cell line (ZF4) (Driever et al. 1993). Usefullness of this new system was verified in a heat and cold shock experiment, as the change in hsf1a upon heat-shock was similar to that of zebrafish liver (Airaksinen et al. 2003). Suitability of zebrafish cell culture was confirmed in an innate immunity study in which ZF4 cells properly responded to zfIFN tranfection by plasmid (Altmann et al. 2004). Transfection capability of zebrafish cell lines was also exploited to analyze the response of cells to
alterations of zebrafish ATM (ataxia-telangiectasia mutated) in ZF4 (Garg et al. 2004). Not only embryo derived cell lines but also tissue-derived (e.g., liver, fin, etc.) cell lines were established for zebrafish. In a study in which the aryl hydrocarbon receptor (AHR) pathway in zebrafish liver cell line was investigated, the degradation of AHR in response to β-naphthoflavone and geldanamycin was shown to be conserved with mammals (Wentworth et al. 2004). Liver and caudal fin derived zebrafish cell lines were studied for their miRNA content and were shown to be similar to each other and also to adult male and female fish (Chen et al. 2005). In another study, the response of zebrafish metallothionein gene to several metal ions was tested both in zebrafish embryo-larvae and the liver cell line. In vitro induction of metallothionein gene was confirmed to be higher than that observed in vivo (Chan et al. 2006). These studies clearly demonstrate the usefulness of zebrafish cell culture systems for cloning and functional studies.
1.2. ROBO2 AS AN IMPORTANT REGULATOR OF AXON GUIDANCE AND CELL MIGRATION
1.2.1. Axonal Guidance Molecules and Robo-Slit Signaling
Axon guidance molecules govern the shaping of the nervous system. The interaction between the axon guidance cues and their receptors determine the direction of a growth cone of a neuron for its movement. Some ligand-receptor couples act as repellents and some are attractive, whereas a few could behave in either way depending on the cellular condition (Chilton et al. 2006). There exists a variety of axon guidance molecules such as Ephrins, Semaphorins, Netrins and Slits which may attract or repel a growth cone by the action of a guidance cue and its receptor (Chilton et al. 2006).
Robo (roundabout) is an axon guidance receptor that was identified in Drosophila as having a repulsive role in defining the axonal pathways of the central nervous system (Seeger et al. 1993). In Drosophila, axons of robo mutants form roundels because of repeated crossing and recrossing the midline instead of exhibiting well-defined axonal
paths (Seeger et al. 1993). Further studies indicated that Robo encodes a transmembrane membrane receptor protein that belongs to immunoglobulin superfamily (Kidd et al. 1998). Robo also has been shown to receive chemo-repulsive signals from Slit proteins to prevent inappropriate midline crossing (Kidd et al. 1999). Slit proteins are molecular guidance cues that were shown to guide neuronal and non-neuronal cell migration (Wong et al. 2002). Slit was identified as having a role in pattern formation; and it was shown to be required for embryonic central nervous system development of Drosophila (Nusslein-Volhard et al. 1984, Rothberg et al. 1988). Later, it has been demonstrated that there are two other homologs of Robo; Robo2 and Robo3, which also form complexes with Slit (Rajagopalan et al. 2000a; Simpson et al. 2000a; Rajagopalan et al. 2000b; Simpson et al. 2000b). Robo4, on the other hand, has been demonstrated to be an endothelial marker that was recently implicated as an angiogenic marker in colorectal cancers (Huminiecki et al. 2002, Grone et al. 2006). In summary, Slit and Robo family genes have roles in axon guidance and cell migration in mammals mostly in nervous system and in some non-neuronal tissues (Yuan et al. 1999, Marillat et al. 2002, Bagri et al. 2002, Long et al. 2004, Sundaresan et al. 2004).
1.2.2. Zebrafish Robo2 Protein
Robo function is conserved between zebrafish and mammals. Robo homologs have been cloned in zebrafish; and a full length cDNA sequence for Robo2 has been reported (Lee et al. 2001). Robo2 has been identified in zebrafish as ‘astray’, mutation of which prevented proper retinal axon guidance, anterior-posterior pathfinding, midline crossing, and fascicular retinal projection (Fricke et al. 2001). From the deduced aminoacid sequence, Robo2 has an extracellular domain comprising five immunoglobulin (Ig) domains and three fibronectin type III (FN) domains; a single transmembrane domain; and a cytoplasmic domain containing several conserved cytoplasmic motifs. Extracellular domain is highly conserved with other homologs wheras the intracellular domain has been shown to be divergent (Lee et al. 2001). The extracellular Ig domains allow the binding of Slit by its LRR (Leucine-Rich Repeat) and the intracellular part
determines the response of the cell to Slit signal (Chen et al. 2001, Battye et al. 2001, Nguyen Ba-Charvet et al. 2001, Liu et al. 2004).
1.2.3. Zebrafish Robo2 mRNA Expression Studies
Detailed analysis of the expression profiles of all three robo parologs during the first three days of zebrafish development indicated that Robo2 expression begins relatively later than the Robo1 and Robo3 mRNAs, at around 12 hpf in hindbrain (Lee et al. 2001). Expression of Robo2 increases over time and appears in various other regions of the nervous system in the embryo, becoming restricted to head at later stages. A significant characteristic of Robo2 is that its expression remains high at 72 hpf while the expression of Robo1 and Robo3 are diminished by that time. Robo4 expression in notochord begins at around 8 hpf while the vascular expression of Robo4 starts in angioblasts ventral to notochord at 19 or 20 somite stage and is lessened at 29 hpf (Bedell et al. 2005). It also has been shown that zebrafish Robo mRNAs are present in non-neural tissues in addition to non-neural tissues during the first 3 days of development. Robo2 has been shown to be expressed in pectoral fin buds at 32 hpf but is later turned off (Lee et al. 2001). Zebrafish Robo2 expression in nervous system supports the role of axon guidance which has been shown in another study (Fricke et al. 2001) and its expression in pectoral fin buds suggests a role in cell migration (Lee et al. 2001). Although Robo2 was shown to play an important role in axon guidance and cell migration during embryogenesis in zebrafish, its larval, juvenile and adult expression pattern or function in non-neuronal cells was not well-known.
1.2.4. Non-neuronal Expression and Function of Robo2
Several studies have reported the expression and role of Robo2 in non-neuronal tissues in chicken, rodents, and humans (Piper et al. 2000, Nagase et al. 2000, Vargesson et al. 2001, Anselmo et al. 2003, Greenberg et al. 2004, Grieshammer et al. 2004). The expression patterns of Slit family, Robo1 and Robo2 have been analyzed during murine metanephric development. Robo2 expression was shown in the induced metanephric
mesenchyme surrounding the arborizing urogenital tract tips and later in the proximal end of the S shaped bodies (Piper et al., 2000). The expression patterns of Slit family, Robo1 and Robo2 have also been analyzed during mouse limb development. (Vargesson et al., 2001). Slit and Robo family expressions have been analyzed during lung development; and it has been suggested that Robo1 and Robo2 have roles in branching morphogenesis and airway development (Anselmo et al., 2003). In a human study, Robo2 was designated as KIAA1568 and has been shown to be highly expressed in adult and fetal brain, adult ovary, and intermediately expressed in fetal liver and in adult lung, kidney, spleen, testis, and spinal cord, and scantily or not expresssed in adult pancreas, heart, liver, and skeletal muscle (Nagase et al. 2000).
1.2.5. Alternative Splicing Potential of Robo2
A common characteristic of immunoglobulin superfamily receptors is the frequent alternative splicing events they undergo (Brummendorf et al. 2001). There are several studies which unearthed evidence that proved tissue type dependent and in some cases neuronal/non-neuronal tissue distinct expression profiles of different isoforms of genes as a result of alternative splicing events (Fukuda et al. 2003, Shen et al. 2002, Jin et al. 2002, Rahman et al. 2002, Ramming et al. 2000, Hu et al. 1999). One study clarified different isoforms of Neogenin1, also an axon guidance receptor in zebrafish, with tissue specific expression patterns (Shen et al. 2002). Another study identified a neuronal- or non-neuronal expression of different isoforms of FE65, a neuronal adaptor protein (Hu et al. 1999). Robos are also members of immunoglobulin superfamily receptors. Previously, Robo1 and Rig1 members of Robo family have been shown to possess different isoforms that are generated by alternative splicing (Clark et al. 2002, Yuan et al. 1999). Rig1 has several alternatively spliced exons that were implicated in the generation of different isoforms of Rig1, defined as the transmembrane and the secreted forms, each with distinct functions (Yuan et al. 1999). In another study, alternative splicing of Robo1 in mouse has been shown to generate two different isoforms, namely, Robo1 and Dutt1. The two isoforms show differential expression patterns; Dutt1 isoform is widely expressed in development and also is present in adult tissues whereas Robo1 isoform is only expressed
in embryonic brain, eye and kidney tissues (Clark et al. 2002). A recent study demonstrated the differential use of alternative exons and 5’UTR sequences in human and mouse Robo2 (Yue et al., 2006). However, zebrafish alternative exon usage in the predicted exonic regions that correspond to intracellular portion of the Robo2 protein has not been yet performed (see Dalkic et al., 2006 for publication of part of this thesis).
1.2.6. Axon Guidance Molecules and Cancer
Axon guidance molecules that are known to shape neuronal migratory pathways have become emerging candidates for determining the invasiveness and adhesion properties of cancer cells. Axon guidance molecules such as slits, semaphorins and netrins were shown to be expressed outside the nervous system. The genomic localizations of these genes were on frequent loss-of-heterozygosity regions (Chedotal et al. 2005). These proteins and their receptors were suggested to control the vascularization of tumors and regulate cell migration and apoptosis (Chedotal et al. 2005). Axon guidance molecules were demonstrated to have important roles for angiogenesis, a crucial process for tumor growth and metastasis. For instance, semaphorin 4D and its receptor plexin B1 were highly expressed in various tumor cell lines such as breast, colon, prostate, and lung, particularly co-expressed in invasive parts (Basile et al. 2006).
Robo and its signaling components also have been associated with progression of certain cancers. Slit2 was expressed in a human malignant melanoma cell line (Wang et al. 2003). Robo1 was expressed in endothelial cells (Wang et al. 2003); and a recent study implicated Robo1 as a novel hepatocellular carcinoma diagnostic target (Ito et al. 2006). As mentioned earlier, Robo4 was shown to be expressed in the sites of tumor vessels, and it was suggested to have a role in angiogenesis (Huminiecki et al. 2002). Robo1 mRNA level was shown to be upregulated in colorectal cancer whereas Robo4 was shown to be upregulated in the endothelial cells of tumor vessels (Grone et al. 2006). Slit-robo signaling was shown to have a role in mediating the connection between cancer cells and endothelial cells (Wang et al. 2003). In a study, which analyzed expression levels of a variety of axon guidance genes, slits and robos were shown to be
overexpressed in prostate tumors, in contrast to others such as DCC, NEO1, etc.; these findings support the significance of slit-robo signaling among axonal pathway members for cancer progression (Latil et al. 2003). Among a group of 538 candidate genes predictive of inflamatory breast cancer progression, no other axon guidance gene but robo2 was reported to be overexpressed (Bieche et al. 2004). In contrast to these studies, various slit-robo members were shown to undergo promoter hypermethylation and therefore downregulation during cervical cancer, however, this list did not include robo2 (Narayan et al. 2006).
1.3. PI3K/AKT/TOR PATHWAY COMPONENTS AND SIGNALING
1.3.1. Phosphoinositide-3-kinases (PI3Ks)
PI3Ks are lipid kinases that phosphorylate phosphoinositides such that upon activation phosphatidylinositol (4,5)-bisphosphate is converted to phosphatidylinositol(3,4,5)-trisphosphate. PI3K is a heterodimer of p85 kda regulatory subunit and p110 kda catalytic subunit (Carpenter et al. 1990). In CHO-PDGFR and CHO-IR cells, overexpression of all PI3K regulatory subunits results in the downstream phosphorylation of akt1 (Inukai et al. 2001). On the other hand, in CHO-EGFR cells, p85 and p50 regulatory subunites (p85alpha, p85beta, and p50alpha) only lead to PI3K-induced Akt1 (v-akt murine thymoma viral oncogene homolog 1) activation.
1.3.2. v-akt murine thymoma viral oncogene homologs (AKT)
There are three AKT/PKB members in mammals, namely, Akt1, Akt2, and Akt3 (Woodgett et al. 2005). With respect to cancer studies, Akt1 and Akt2 were shown to act in opposite directions when regulating the proliferation of breast epithelial cells. Reductions in Akt2 levels were shown to inhibit the proliferative phenotype observed in MCF-10A cells overexpressing IGF-IR whereas Akt1 inhibition led to their epithelial-mesenchymal transition (Irie et al. 2005). Downstream of Akt/Pkb phosphorylation lies
several substrates, which in turn signal changes in transcription and translation in the cell. These substrates include Bad, Gsk3β, and Foxo proteins (Harrington et al. 2005).
1.3.3. Glycogen synthase kinase 3 beta (GSK3B)
GSK-3 is a serine/threonine kinase, which stays inactivated normally but activated under cellular inhibitory conditions. Upon insulin binding and PI3K activation, PKB/AKT phosphorylation inhibits the Gsk3, resulting in dephosphorylation and activation of glyogen synthase and eIF2B. Alpha and beta isoforms of Gsk have overlapping roles (Patel et al. 2004). GSK-3B was found to be activated upon serum deprivation and preceded apoptosis in neurons (Hetman et al. 2000).
1.3.4. Target of Rapamycin (TOR) Complexes
TOR is the target of rapamycin (Heitman et al. 1991) protein, and is inhibited by rapamycin, a macrolide isolated from Streptomyces hygroscopicus with well-known antifungal, immunosuppresive and anti-proliferative properties (Sehgal et al. 1975; Douros et al. 1981; Calne et al. 1989; Sehgal et al. 1998; Huang et al. 2002). Rapamycin acts on TOR protein by inhibiting its role in the regulation of cell growth and division therefore inducing cell cycle arrest or apoptosis. TOR participates in two different complexes that have distinct roles. In the well-known TOR Complex 1 (TORC1), it regulates protein synthesis, whereas in TOR Complex 2 (TORC2) it regulates actin organization; and only TORC1 seems to be rapamycin sensitive (Martin et al. 2005) (Figure 1.1). These complexes are conserved from yeast to mammals although there are two different TOR genes in yeast but single one in vertebrates.
1.3.5. PI3K/AKT/TOR pathway
Rapamycin sensitive-mTOR (mammalian TOR) activity can be regulated by nutrients, growth factors and energy metabolism. For nutrient control, two other factors Raptor and mLST8 (GBL, G protein beta subunit-like) form a complex with mTOR.
Raptor recruits mTOR substrates, S6K1 (RPS6KB1, ribosomal protein S6 kinase, 70kDa, polypeptide 1) and 4EBP1 (EIF4EBP1, eukaryotic translation initiation factor 4E binding protein 1), and is necessary for their subsequent phosphorylation (Beugnet et al. 2003; Choi et al. 2003; Schalm et al. 2003). mLST8 plays a positive role by stabilizing mTOR-Raptor interaction (Kim et al. 2003). In response to nutrient conditions, alterations of the configuration of the mTOR-Raptor-mLST8 complex determine the availability of the targets such as S6K and 4E-BP to mTOR. For control of mTOR by growth factors, there is a linear cascade activity of PI3K, AKT, TSC (tuberous sclerosis), and Rheb (Ras homolog enriched in brain) proteins. Growth factor directed activation of mTOR was shown to be mediated by PI3K (Chung et al. 1994; Mendez et al. 1996). PI3K positively regulates mTOR activity (Cheatham et al. 1994; Chung et al. 1994; Brunn et al. 1996; von Manteuffel et al. 1996; Gingras et al. 1998). PTEN (phosphatase and tensin homolog (mutated in multiple advanced cancers 1)) negatively affects this pathway since it dephosphorylates PIP2 and PIP3 products of PI3K (Neshat et al. 2001; Podsypanina et al. 2001). AKT, a downstream effector of PI3K, also is an enhancer for mTOR activity (Gingras et al. 1998; Verdu et al. 1999; Scanga et al. 2000; Lizcano et al. 2003; Miron et al. 2003). On the other hand, Tsc1/Tsc2 heterodimer acts as a negative regulator of mTOR (Gao and Pan et al. 2001; Potter et al. 2001; Tapon et al. 2001; Gao et al. 2002; Inoki et al. 2002; Jaeschke et al. 2002; Manning et al. 2002; Tee et al. 2002). AKT phosphorylates Tsc2, thereby activating mTOR through inactivation of Tsc1/Tsc2 inhibitors (Potter et al. 2001; Goncharova et al. 2002; Kwiatkowski et al. 2002; Inoki et al. 2002; Manning et al. 2002). Tsc2 exhibits GTPase activity for Rheb, which is placed downstream of Tsc1/Tsc2 and positively regulates mTOR (Saucedo et al. 2003; Stocker et al. 2003; Castro et al. 2003; Garami et al. 2003; Inoki et al. 2003). It is not yet known how Rheb activates mTOR.
In addition to nutrients and growth factors, energy levels have also effect on mTOR (Dennis et al. 2001). Decrease of ATP/AMP ratio is sensed by AMPK (protein kinase, AMP-activated) which in turn hampers mTOR function through Tsc2 activation (Hardie et al. 1998; Kemp et al. 1999; Kimura et al. 2003; Inoki et al. 2003) (Fig. 1.1). Some studies showed crosstalk between nutrient and growth factor induced regulation of
mTOR, specifically through Tsc1/Tsc2 (Tee et al. 2002; Gao et al. 2002; Matsumoto et al. 2002; Garami et al. 2003; van Slegtenhorst et al. 2004). It is not yet known if Raptor and mLST8 have also role in growth factor induced activation of mTOR (Hay and Sonenberg 2004). A recent study implicated the Vps34, a class III PI3K, as the transducer of nutrient availability to mTOR (Dann and Thomas 2006).
Figure 1.1. TOR signaling network consisting of two complexes (From Martin and Hall 2005).
Major targets of mTOR are 4E-BP (4E Binding Protein) and p70S6K (p70 S6 Kinase). 4E-BP1, the inhibitor of eIF4E (Eukaryotic Initiation Factor 4E), is phosphorylated and inactivated by mTOR (Polakiewicz et al. 1998; Gingras et al. 1998). p70S6K is activated by mTOR (Polakiewicz et al. 1998; Gingras et al. 1998). In addition, mTOR phosphorylates PP2A (Protein phosphatase 2A), therefore prevents 4E-BP and S6K from dephosphorylation (Di Como and Arndt 1996; Peterson et al. 1999).
1.3.6. Serum Starvation and PI3K/AKT/TOR pathway
There is an intricate connection between nutrient deprivation/growth factor signaling and the concomitant modulation of PI3K/AKT/TOR pathway. For example, thyroid hormone (T3) was shown to activate AKT signaling in cardiac myocytes and,
and PI3K/AKT/mTOR/S6K altogether in human fibroblasts (Kuzman et al. 2005, Cao et al. 2005). In a study that uses rat nucleus pulposus cells, survival in hypoxic conditions was shown to be correlated with the activation of PI3K/AKT and MEK/ERK (Mitogen-activated protein kinase kinase/Extracellular-regulated MAP kinase kinase) pathways, and inactivation of the Gsk3β. The use of inhibitors of this pathway, LY294002 and PD98059, resulted in impaired survival indicating the significance of these pathways in cellular growth and proliferation (Risbud et al. 2005). Similarly, in cardiac fibroblast cells, serum starvation was shown to induce necrosis and apoptosis. During this event, MAPK (Mitogen-activated protein kinase) and AKT were shown to be downregulated (Leicht et al. 2003).
Several studies showed a connection between serum starvation and cancer. Various cancer cell lines including those of liver, pancreas, gastric, and colon showed higher resistance to serum deprivation when compared with normal human fibroblasts (Izuishi et al. 2000). High level expression of AKT was found to be correlated with this resistance; by using antisense technology and specific inhibitors, a role for Akt1, Akt2 and PI3K was found in the tolerance of cancer cell lines to serum-deprivation (Izuishi et al. 2000). Pten, an inhibitor of PI3K and AKT, was overexpressed in a prostate cancer cell line that normally lacks Pten; this was shown to induce apoptosis that was similarly induced by serum starvation, and resulted in decreased insulin like growth factor receptor cell surface expression (Zhao et al. 2004). Supporting evidence came also from a study with malignant mesotheliomas. Under serum starvation, these cells showed high Akt levels, and homozygous deletion of Pten. Treatment with rapamycin or LY294002 was able to induce growth arrest (Altomare et al. 2005). It was shown that p53 induction resulted in downregulation of mTOR activity as the phosphorylation levels of S6K decreased; an action involving AMPK and TSC complex (Feng et al. 2005). In addition
to this, p53 was transiently phosphorylated in response to glucose starvation (Feng et al. 2005). On the other hand, it was reported that PI3K and TOR inhibitors resulted in a growth arrest phenotype that was different from the serum starvation phenotype (Tresini et al. 1998, Tsurutani et al. 2005).
1.3.7. Bioinformatics for Studying Gene Structure and Expression
With the availability of high-through put techniques genome sequences of a variety of organisms from human to yeast was sequenced or is in the process of sequencing and assembling. Online databases like Ensembl (www.ensembl.org), UCSC Genome Browser (genome.ucsc.edu), etc. are available to search the sequenced genomes. These kind of databases allow us to analyze the genomic structure of genes, including exon-intron splicing juctions, UTRs, etc. These databases include ESTs (Expressed Sequence Tag) that are the sequences known to be expressed at mRNA level. However, these ESTs do not cover all of the expressed sequences and therefore transcripts can contain exons other than the already known ones. Gene prediction programs like Genscan and FgenesH can therefore provide us with some exons that could not have been identified in the previously known transcripts pf genes and thus these tools are used to search for possible alternatively spliced exons.
Microarray is a large scale experimental method to give the mRNA expression profiles of genes genome-wide. They provide a complementray expression profile of genes in a condition specific experiment. There are databases that contain the results of microarray experiments such as stanford database (genome-www5.stanford.edu) and GEO database (www.ncbi.nlm.nih.gov/geo). There are some examples of zebrafish microarrays. Mathavan et al. (2005) have analyzed the embryonic expression pattern of zebrafish from unfertilized stage to 48 hpf embryos using oligonucleotide arrays. Their findings indicated that zebrafish showed coregulated expression of many protein complexes, such as ribosomal protein subunits, proteosome members, and cell cycle regulators. An important advantage of microarray studies is that they provide a gene with its relation to other genes in terms of the expression patterns and if a gene of interest
could be searched for its coexpressed genes. If these coregulated genes fall into specific categories, such as regulation of cell cycle, apoptosis, then one can associate the novel gene with these functions. As an example, in a previous study, promoters and introns of genes were collected genome wide and it was found that 4,852 genes contained sequences for binding to p53 and the significance of this bioinformatic approach was confirmed by expression analysis (Wang et al. 2003). Gene networks are networks that contain connectivity information about genes. The connectivity parameter could be trancriptional regulatory one, a direct interaction one, or simply a coexpression one. A gene coexpression network could be contructed from the result of microarray experiment. A comprehensive study demonstrated the presence of a conserved gene coexpression network among multiple taxa exists (Stuart et al. 2003). In this study, a large amount of microarray data for various organisms from yeast to human was gathered; and genes that are conserved among different organisms and present in the microarray results were designated as Meta-genes and these genes which showed similar expression patterns in a conserved manner were designated as neighbors yielding a conserved coexpression network in the end. As a result, constructing such conserved gene networks allow us to analyze the functional relevance of a gene of interest.
CHAPTER II: AIM AND STRATEGY
2.1. MOTIVATION AND AIM
Robo2 is an attractive candidate for cancer research since it is an important regulator of cellular growth and migration. However, there has been no study up to date that deals with its expression in adult zebrafish tissues as well as its degree of coexpression with members of PI3K/AKT/TOR pathway, an essential mitogenic and cell migration regulator.
Loss of regulation of cell growth and cell division is the key to the progression of cancer. TOR protein, acting downstream of PI3K/AKT/PTEN pathway, has been characterized for its crucial role in the regulation of cell growth and division. Indeed, mitogenic activity of one or more of these aforementioned pathway members has been implicated in tumorigenesis (Tsuratani et al. 2005). Dysregulation of cellular migration is yet another prominent character of tumors, particularly during metastasis. Axon guidance molecules that are known to shape neuronal migratory pathways have become emerging candidates for determining the invasiveness and adhesion properties of cancer cells. Therefore, it is an intriguing possibility that PI3K/AKT/TOR pathway elements may be involved in expressional regulation of axon guidance molecules (e.g., Robo-Slit signaling).
In this study, we particularly focused on Robo2, a gene known to have a repulsive role during axon guidance yet also has been shown to be dysregulated in certain tumors (see Introduction Section 1.2.1 and 1.2.6). The primary aim of this thesis, therefore, was to study adult and larval expression pattern of Robo2 in zebrafish, a well known vertebrate model for human diseases. Moreover, the modulation of expression of Robo2 and selected PI3K/AKT/TOR pathway members in the presence of rapamycin, an mTOR inhibitor, as well as at different levels of serum also were examined.
2.2 . STRATEGY
2.2.1. Computational Approach
2.2.1.1. Prediction of Robo2 Coexpression Neighbors
One possibility to understand which genes are likely to be coexpressed is to use a conserved expression network obtained based on microarray data from multiple taxa. We have chosen meta-gene dataset (Stuart et al. 2003) that is available at
http://cmgm.stanford.edu/~kimlab/multiplespecies/index.html. This site allows for searching of a gene of interest with respect to its neighbors, which made identification of coexpression neighbors of Robo2 and mTOR, possible.
Second, we have taken a species-specific signaling pathways approach in which genes of interest such as PI3Ks, AKT, GSK3B, and TOR proteins were involved could be profiled in terms of their embryonic expression; and their coexpression neighbors. Moreover, these pathway-specific genes were clustered with Robo2 expression in the context of PI3K/AKT/TOR pathway.
2.2.1.2. Phylogenetic Analysis
Zebrafish has become a valuable model for comparative genomics studies. To determine expression levels of selected PI3K/AKT/TOR pathway members, it is important to identify the orthologs, accurately. This process requires blast searches of mammalian sequences against the zebrafish genome assemblies. Upon identification of zebrafish orthologs, multiple alignment of the nucleotide and amino acid sequences are required. These alignments also help in selection and design of primer sequences to amplify the products of these selected genes. We aimed to identify zebrafish orthologs of several PI3K/AKT/PTEN/TOR pathway members phylogenetically using public genome databases (e.g., www.ensembl.org) to make candidate gene selection in an accurate manner.
2.2.2. Experimental Approach
2.2.2.1. Tissue and Developmental Expression Profiles
RT-PCR and Real-time RT-PCR are the chosen methods to analyze mRNA levels of interested genes in this study. Since real-time RT-PCR allows for quantitative determination of expression, correlations among expression levels of genes therefore could be assessed precisely.
To study the mRNA expression of Robo2 and other selected target genes in in vivo and in vitro conditions, we have used zebrafish as a model system due to its short developmental period and ease of maintenance. Accordingly, we aimed to characterize Robo2 expression (and its alternatively spliced forms, if any) in the embryo, larvae, and adult tissues in zebrafish. Furthermore, we aimed to show the presence/absence of any Robo2 isoforms in multiple developmental stages and adult tissues in zebrafish. Conservation of Robo2 isoforms in rat also was important to assess to generalize our conclusions.
2.2.2.2. Transcriptional Response to Rapamycin and Serum Deprivation
To study the degree of correlation between the mRNA expression of Robo2 and those of the selected pathway genes, several treatments (such as rapamycin administration and serum-starvation) known to modulate cell growth/division seemed appropriate choices. Multivariate analyses, such as hierarchical cluster analysis provided a better visualization of these correlations.
CHAPTER III: MATERIALS AND METHODS
3.1. ANIMALS
Zebrafish (Danio rerio), purchased from pet-shops or provided by University of Oregon at Eugene, OR, USA (AB strain), or University of Bergen, Norway (Tu/AB) were kept and raised using standard methods. In addition, Sprague-Dawley rats were used from the animal holding facility of Bilkent University.
3.1.1 Maintenance
Fish were maintained under a cycle of 14 hours day and 10 hours night at 28.5oC. Before sacrifice, animals were anesthetized by tricaine solution (0.12% adults, and 0.08% embryos and larvae). Adult fish were dissected by using sterile equipment in order to obtain different tissues. Embryos were collected on the following morning of the setup and maintained in plates filled with system water. Embryos, larvae and juvenile fish were staged according to hours post fertilization (hpf), days post fertilization (dpf) and relevant morphological criteria (Kimmel et al., 1995).
Nine weeks old, 200-250 grams male or female Sprague-Dawley rats were used. They were housed under controlled environmental conditions (22ºC) with a 12-hour light and 12 hour dark cycle in the animal holding facility of Bilkent University, Turkey. All the animals received care according to the criteria outlined in the "Guide for Care and Use of Laboratory Animals" prepared by the National Academy of Science; and this study protocol complied with Bilkent University’s guidelines on humane care and use of laboratory animals.
3.1.1.1 Aquaria system and water condition
Zebrafish were kept in glass aquaria filled up with system water. Tap water was allowed to stay for two days before being fed into the system. Each aquarium was equipped with a standard filtering system; 25-40% of the system water was replaced with fresh system water weekly. Illumination period (14 h light/ 10 h dark) was kept constant by using a clock-timer.
3.1.1.2 Housing and feeding
Adult zebrafish were of 3-4 cm length; and up to 15 adults were kept in a 30 liter aquarium with weekly water changes of 25-40 %. Adult fish were fed the dry food flakes twice per day, supplemented with high protein-content granulated food and/or Artemia nauplia.
3.1.2 Breeding
To obtain efficient breeding, fish were kept at a constant 14h/10h light/dark regime at 28.5 °C. Pairs of male and female fish were put in the breeding cages in the afternoon; the fertilized eggs were collected in the morning. In our system we were able to obtain 70 to 300 embryos per set-up, and generally up to 50 to 80% of them were viable. Unfertilized eggs were discarded immediately while fertilized eggs were transferred into a 95-mm Petri dish and washed several times in system water.
3.1.3 Embryo handling
Maximum of 70 embryos were kept in 95-mm Petri dishes in embryo medium. Petri dishes were kept in an incubator, set at 28.5 °C with a 14h light/10h dark illumination period. System water was used to work with the embryos. In order to treat multiple embryos either with rapamycin or control solutions, they were transferred into 96-well plates. Within each well, up to 5-10 embryos can be treated by a maximum of
250µl treatment solution. Embryos can be kept in these wells until 5 dpf since they feed from their yolk. Zebrafish older than 6 dpf were kept in 200 ml platic holders with mesh bottoms and were fed baby dry flake (Tetramin).
3.2. CELL CULTURE
ZF4 (ATCC CRL-2050) is a cell line derived from zebrafish embryonic fibroblast cells. ZF4 cells were cultered in D-MEM/F-12 (Invitrogen,11039-021) containing 10% fetalbovine serum with 100 µg/ml Streptomycin/Penicilin at 28ºC in air. Cells were trypsinized and passaged twice a week. Serum starvation experiments were performed for 24 hours; 10%, 3%, 1%, and 0% serum were used for each treatment group, respectively.
3.3. STANDARD SOLUTIONS & BUFFERS
3.3.1. 10X TBE electrophoresis buffer 108 g Tris base
55 g Boric acid 40 mlEDTA(0.5 M) add dH2O to the 1 liter
3.3.2. 1X TE electrophoresis buffer 10 mM Tris.Cl (pH 7.4)
1mM EDTA
3.3.3. DNA loading buffer 20% glycerol 400
0.25 % bromophenol blue 0.25 % xylene cyanol
3.3.4. Traciane solution (stock) 400 mg tricaine powder
97.9 ml dd H2O
~2.1 ml 1 M Tris (pH 9). to use as an anesthetic: 4.2 ml tricaine stock solution ~100 ml clean tank water
3.3.5. PBS 8 g NaCl 0.2 g KCl 1.44 g Na2HPO4
0.24 g KH2PO4
dissolve in 800 ml dH2O, adjust the pH 7.4 with HCl
add dH2O to 1 liter
3.3.6. DEPC-H2O
500 µl DEPC (from AppliChem) 1 liter dH2O
o/n aeration, autoclave
3.4. RAPAMYCIN TREATMENT OF EMBRYOS
Rapamycin (Calbiochem, CA, Cat. No. 553210) purchased as 100 µg or 1 mg solid product was dissolved in DMSO (dimethlysulphoxide) as a stock solution with a concentration of 5 mM; aliquoted into smaller volumes; and was stored at -20°C in dark. Its concentration was then adjusted to 20µM by making an appropriate dilution using the system water. Rapamycin was provided in system water at the appropriate concentration in the wells of 96-well plates. In each experiment, control solutions were prepared by including the same amount of DMSO as found in the rapamycin solutions. At 48 hpf, embryos were removed from wells; either observed and photographed in the depression slide and/or treated with RNAlater solution for further analysis of mRNA expression.
3.5. DETERMINATION OF GENE EXPRESSION
The expression of several genes from embryos, larvae, various adult tissues, and cell line were measured upon isolation of RNA from multiple samples, conversion of RNA into cDNA; and finally by using qualitative PCR and/or real-time quantitative PCR.
3.5.1. Total RNA Isolation
During RNA isolations, all material and solutions were treated with diethyl pyrocarbonate (DEPC) to inhibit the RNase contamination. Larval and adult zebrafish samples were first put into the RNAlater solution or liquid nitrogen; and then total RNA isolation was performed by using the Qiagen RNeasy Mini Kit or alternatively Ambion Totally RNA isolation kit. Briefly, samples removed from RNAlater were put in the RLT buffer, which contains 1% B-ME (β-mercaptoethanol). Samples were homogenized in RLT by using 20 gauge needles; 70% EtOH was added to the homogenized lysate and mixed. 700 µl of the sample were added to an RNeasy mini column in a 2 ml tube; and centrifuged for 15 s at 10.000 rpm. After discarding the flow-through, 700 µl buffer RW1 were added to the RNeasy column, centrifuged for 15 s at 10.000 rpm. Next, 500 µl buffer RPE with 100% EtOH, were added onto the RNeasy column, and centrifuged for 15 s at 10.000 rpm; and this was repeated a second time followed by centrifugation for 1 min at full speed. 30 µl RNase-free water were pipetted on the column in a 1.5 ml collection tube; and centrifuged for 1 min at 10.000 rpm. The elute containing RNA of the sample was stored at -80 C. Alternatively, RNA was isolated by using the Totally RNA Isolation Kit (Ambion) according to manufacturers protocols (Ambion).
For RNA isolation from the ZF4 cell line, cells in culture were first washed with 1X PBS; then trypsinized; and the plate was rocked to detach the cells. After removal of trypsin, and cells were rinsed with 1X PBS. Next, cells were collected, centrifuged at 500 xg for 5 minutes and supernatant is discarded to obtain a pellet. RNA was isolated by Promega SV Total RNA Isolation kit accroding to the manufacturers protocols. In brief, 175 µl SV RNA Lysis Buffer was added onto the pellet; homogenized by using 20 gauge
needles. 350 µl SV RNA Dilution Buffer was added to the lysate; mixed by inverting 3-4 times and kept at 70 oC for 3 minutes. Samples were centrifuged at 13,000 rpm for 10 minutes; and the lysate was then transferred to a microcentrifuge tube; 200 µl 95% EtOH was added and mixed by pipetting 3-4 times. The mixture transferred to a spin column was centrifuged at 13,000 rpm for 1 minute. Next, 600 µl SV RNA Wash Solution was added; and the column was centrifuged at 13,000 rpm for 1 minute before discarding the flow-through. DNase treatment was performed by applying 50 µl Dnase incubation mix onto the membrane; the samples were incubated at RT for 15 minutes. 200 µl SV Dnase Stop Solution was added; centrifuged at 13,000 rpm for 1 minute; and then washed by 600 µl SV RNA Wash Solution by centrifuging at 13,000 rpm for 1 minute. Again, 250 µl SV RNA Wash Solution was added and centrifuged at 13,000 rpm for 2 minutes. Elution was performed by 100 µl Nuclease-Free Water added onto the membrane; the samples were centrifuged at 13,000 rpm for 1 minute; and the resulting RNA solution was kept at -80 oC.
3.5.2. Determination of RNA Concentrations
2 µl of each sample was diluted (1:200) with 400 µl DEPC-treated ddH2O. Then,
the measurements were taken at 260 nm and 280 nm by using Beckman spectrophotometer. Alternatively 2 µl of RNA solution was used to measure the concentration and O.D ratio by using NanoDrop ND-1000 spectrophotometer. The concentration was calculated by using the formula; [RNA]=O.D260*40*d.f(200).
O.D 260/O.D280 ratio was used for the purification quality of the RNA. For high-quality RNA solutions, it must be between 1.8 and 2.1.
For the visualization of RNA on gel, 4 µl of RNA solution was mixed with 2 µl of DNA Loading Buffer and 10 µl of ddH2O and incubated at 60 °C for 10 minutes before
being loaded into 1% Agarose Gel. The bands were examined under the UV light and images were analyzed by using the Multi-Analyst Software (Bio-Rad, USA).
3.5.3. cDNA Amplification
After the RNA isolation and measurements, equal amounts of the RNA were converted into the 1st strand cDNA by using the Fermentas cDNA kit (Catalog No. 1622). First, RNA was annealed by oligodT primers for 5 min at 70 oC. Then, the mixture was treated by an RNase inhibitor for 5 min at 37 oC. Finally, mixture was treated by the MMLV-reverse transcriptase for 1 hour at 42 oC and 10 min at 70 oC. The amplified cDNAs were stored at -20 oC.
3.5.4. Orthology Prediction and Phylogenetic Analysis
Pi3kr2 (PI3K Regulatory subunit 2), Gsk3b, and Akt2 genes were selected as candidate genes coregulated with Robo2 under serum deprivation and growth inhibition by rapamycin conditions. The nucleotide and protein sequences of human PI3KR2, GSK3B, and AKT2 were aligned against to those of zebrafish and other organims for which complete amino acid sequences were reported in NCBI database (www.ncbi.nlm.nih.gov). Multiple alignments were performed using ClustalW 1.8 in BCM Search Launcher (http://www.searchlauncher.bcm.tmc.edu/) and then visualized using BOXSHADE 3.1 (http://www.ch.embnet.org/software/BOX_form.html). Phylogenetic trees were generated by using TreeTop Phylogenetic Tree Prediction online tool (http://www.genebee.msu.ru/services/phtree_reduced.html).
3.5.5 Primer Design
Primers were designed with Primer3 online tool ( http://frodo.wi.mit.edu/cgi-bin/primer3/primer3_www.cgi). Each primer pair was blasted against the zebrafish (or rat) genome and mRNA sequences to ensure specificity. Some previous primers had been designed by using a software program, the Primer Designer Version 2.0 (Scientific and Educational Software; Kuscu et al. 2004, MS Thesis). The list of primers used in this study is given in Table 3.1 below together with their sequence.
Table 3.1. Forward and reverse primer sets used to amplify the genes mentioned in the study given in the 5'-3' direction.
Primer Name Primer Sequence (5’-3’)
Robo2 NCBI1F CTCGGCAGCCTGCAGATCAA
Robo2 NCBI2F AAGACTTCCGCGATGTGATG
Robo2 E21F CCTTAGTGTCTGACATCGAG
Robo2 E22R GGACGAGGTCTATGAGGAA
Robo2 AER ATCATCTTCTGAAGCCGAGC
Robo2 RATF CCCCTCAGAGCACTAGACCA
Robo2 RATRI TCCATCCAGCCTAAAACCAG
Robo2 RATRO TCCCTCCGATGAGGTAACAC
Robo2 MAMF GAGCACT(G/A)GACCAGAC(T/A)CC
Robo2 MAMRO T(G/T)GGTCCATCCG(C/T)CCTC
CyclophilinF GGGAAGGTGAAAGAAGGCAT CyclophilinR GAGAGCAGAGATTACAGGGT MIPEPF AACATCGAGATCCAGCACC MIPEPR ACATCCTCAGAGAATTGCAG TORF ACACGCTGCACGCACTGATT TORR CCACCTTCTCCATTAGAGTC PI3KR2F ACCAGGCAAAGGAAGATCAA PI3KR2R GGGTCTGGCTCTCTCTGATG AKT2F CTGGCAAGATGTGCTTCAAA AKT2R GGGAGAAGTGTGTGCGTGTA GSK3BF AACTGCGGGAACCAAATGT GSK3BR CTCCACTGTTGGCATCTGAA
3.5.6 RT-PCR
Following the conversion of RNA into cDNA, an RT-PCR reaction was performed with the appropriate primers using the cDNA as a template. PCRs were performed in 0.2ml Thermowell tubes using the Techne PCR machine (Techne, ftGENE2D, Cambridge, UK). Each reaction contained a total of 25 µl reaction volume that includes 1 µl cDNA, 0.5 µl of 20 pmol reverse and forward primers, 0.5 ml 0.2mM dNTP, 1.5 µl 1.5 mM MgCl2, 2.5 µl 10X PCR buffer and 1 unit Taq DNA polymerase (Fermentas, Catalog No. EP0402). PCRs included an initial heating step, then a number of cycles of denaturation, annealing and extension steps was performed. PCRs were finished with a final extension step. For various PCRs different conditions were used as listed in Table 3.2. PCR product was mixed with 5 µl DNA Loading Buffer and 20 µl of this mix was loaded on a 1-2% agarose gel in the electrophoresis system and visualized under UV light.
3.5.7 Real Time RT-PCR
Qiagen Real-Time Kit containing SYBR green as a marker dye for measurement of PCR yield in each cycle was used for all reactions. 12.5 µl SYBR- green mix, 10 pmol forward and reverse primers, and 1 µl cDNA were mixed in the supported 96 well-plate and RNase-free water was added to 25 µl in each well, and 3 µl mineral oil was added at the top of the solution to inhibit the evaporation of the product from the well. PCR reactions were performed using the BIO-RAD iCYCLER machine. For each primer set, PCR program was the same with that explained in the section 3.5.5, but additionally iCYCLER reactions included a pre-activation step for the hot-start Qiagen Taq DNA polymerase (95 oC for 8-10 min). A melt curve was generated at the end of each set of reactions beginning with 55 oC and ending at 95 oC by 0.5 oC increments in each 15 seconds. Normalized mRNA expression values were calculated by on the ∆∆Ct method as proposed by Pfaffl (2001) upon calculation of primer efficiencies based on 10-fold dilution curves.
3.5.8. Analysis of Genomic Structure of Robo2 Homologs
Ensembl genome database was used to analyze the genomic structure of Robo2 gene for zebrafish, human, rat, chicken, dog, and chimpanzee. The relevant sequence accession numbers were provided in the Results section and Figure legends therein. The GenScan predictions were used to detect presence of alternative exons not found in the published EST and transcript information (see Figure 4.1 in Results section). Paralogs of Robo2 in the genomes mentioned above also was searched for the alternative exons under investigation; multiple alignment of sequences were performed using ClustalW (http://www.ebi.ac.uk/clustalw/) and the Logo was generated by WebLogo (http://weblogo.berkeley.edu/)
3.5.9. Analysis of Zebrafish Microarray Data
List of genes that are involved in PI3K, AKT, insulin signaling, GSK3B signaling were obtained from a signaling pathway database Biocarta (www.biocarta.org). Furthermore, Mathavan et al. (2005) dataset was searched for keywords such as wingless/wnt, insulin, inositol, phosphoinositide, phosphatidly, frizzled, disheveled, glycogen, and thymoma in the human homologous gene name column. Pearson correlation coefficients between these genes and Robo2 expression level were calculated and those genes with less than 0.55 (or greater than -0.55) correlation coefficient were excluded. Furthermore, only genes with annotated NCBI Unigene Ids were included in the further analysis (Table 4.5). Along with the expression profile of Robo2, the zebrafish embryonic development expression profiles of these genes (annotated with their potential human homolog gene descriptions) were clustered using Cluster (http://rana.lbl.gov/) and Treeview programs.
Table 3.2. Conditions optimized for the PCR reactions for the candidate genes. Final extension was performed at 72oC for 10 minutes.
PRIMER PAIR Denaturation Cycle Denaturation Annealing Extension
NCBI1F-E22R 94oC 5 min. 40 94oC 30 sec. 60oC 30 sec. 72oC 2 min.
NCBI1F-AER 94oC 5 min. 40 94oC 30 sec. 60oC 30 sec. 72oC 2 min.
NCBI2F-E22R 94oC 5 min. 40 94oC 30 sec. 60oC 30 sec. 72oC 2 min.
NCBI2F-AER 94oC 5 min. 40 94oC 30 sec. 60oC 30 sec. 72oC 2 min.
E21F-E22R 95oC 5 min. 30 95oC 30 sec. 58oC 30 sec. 72oC 30 sec.
E21F-AER 95oC 5 min. 30 95oC 30 sec. 58oC 30 sec. 72oC 30 sec.
RATF-RATRI 95oC 5 min. 30 94oC 30 sec. 55oC 30 sec. 72oC 30 sec.
RATRF-RATRO 95oC 5 min. 30 94oC 30 sec. 58oC 30 sec. 72oC 30 sec.
MAMF-MAMRO 95oC 5 min. 35 95oC 30 sec. 55oC 30 sec. 72oC 30 sec.
MIPEPF-MIPEPR 95oC 5 min. 30 95oC 30 sec. 58oC 30 sec. 72oC 30 sec.
CYCF-CYCR 95oC 5 min. 25 95oC 30 sec. 58oC 30 sec. 72oC 30 sec.
TORF-TORR 95oC 5 min. 30 95oC 30 sec. 59-60oC 30 sec. 72oC 30 sec.
AKT2F-AKT2R 95oC 5 min. 30 95oC 30 sec. 59oC 30 sec. 72oC 30 sec.
PI3KR2F-PI3KR2R 95oC 5 min. 30 95oC 30 sec. 59oC 30 sec. 72oC 30 sec.
CHAPTER IV: RESULTS
4.1. ALTERNATIVE SPLICING OF ROBO2
4.1.1. Comparison of Zebrafish and Rat Robo2 Sequences
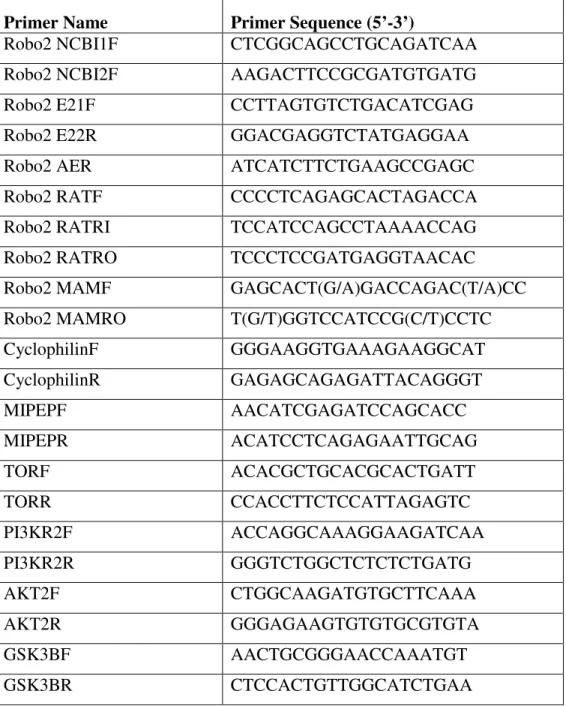
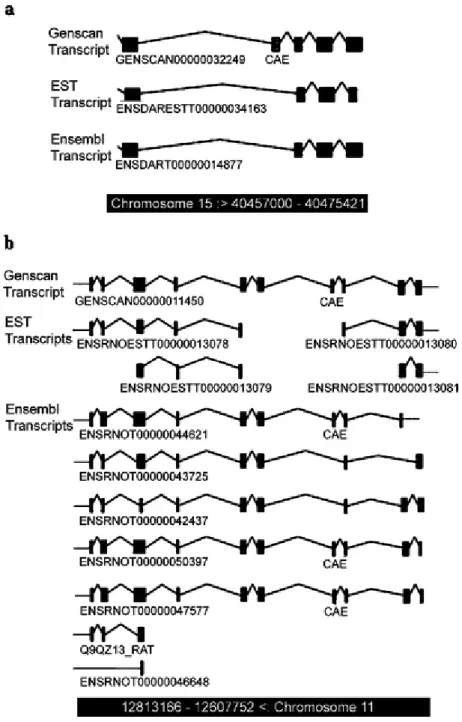
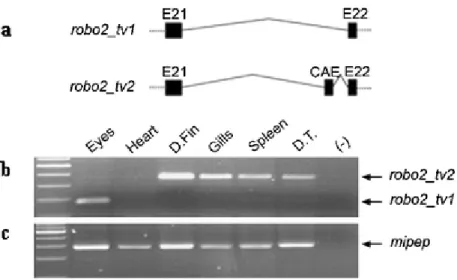
Complete zebrafish robo2 genomic sequence is currently unavailable. Ensembl database contains a predicted transcript (Ensdart00000014877; www.ensembl.org; WTSI Zv5) partially corresponding to zebrafish robo2 (NM_131633). Several NCBI zebrafish ESTs, which aligned primarily to the 5’ and 3’ ends of the robo2 cDNA sequence (NM_131633) also could be detected (CK686381.1, AL920855.1, CN173823.1, CN318984.1, AI437295.1). Exon/intron structure of Ensdart00000014877 in the genomic assembly was analyzed in further detail by comparing with the corresponding Genescan prediction. The most 3’ end of Genscan00000032249 exhibited a potential alternative exon, (30th exon; 4508 bp-4693 bp) which was further pursued in the present study (Figure 4.1a).
Figure 4.1. The exon/intron structure of Ensembl Transcripts a The exon/intron structure of ENSDART00000014877 which corresponds to 3’ of zebrafish robo2 is shown in detail (www.ensembl.org). The putative exons (PE) present in the Genscan but not found in the reported transcript are highlighted with open boxes; the conserved alternative exon (CAE) is highlighted in a bold open box b The exon/intron structure of Ensembl transcripts corresponding to 3’ of rat robo2 is shown in detail (www.ensembl.org). CAE is highlighted in a bold open box.