HOUSEHOLD EXPENDITURES ON EDUCATION BY PARENTS OF STUDENTS ATTENDING PUBLIC SCHOOLS
AT THE PRIMARY EDUCATION LEVEL 1
Berru ULUSOY
Kastamonu Provincial Directorate of National Education, Kastamonu
Hüseyin YOLCU
Kastamonu University, Faculty of Education, Educational Sciences Department, Kastamonu
İlk Kayıt Tarihi:18.02.2014 Yayına Kabul Tarihi: 20.03.2014 Abstract
The purpose of the study is to find out the amount of household expenditures by parents of the primary school students and whether these expenditures differ in terms of some school-related variables and socio-economic variables. The data were collected from a population consisting of 707 families from 6 public primary education schools located in different socio-economic environments during 2011-2012 school year. The data were analysed using descriptive statistics, as well as non-parametric test Kruskal Wallis H Test and parametric t-test and ANOVA. Mann Whitney U test and Post Hoc Tukey test were used to find out the differences between groups.
In terms of school-related variables, parents’ household education expenditures at primary education level were found to differ significantly according to type of school transportation and school’s socio-economic status [SES], no significant difference was observed according to type of schooling. Parents’ household education expenditures at primary education level were found to differ significantly in terms of socio-economic variables including whom the student lives with, parents’ educational background, parents’ professions, family income, type of accommodation, number of children attending primary education schools, and students’ grade level.
Key words: Public School, Househould Expenditure Education, Primary Education
1.This paper is a rearranged version of a part of the master thesis written by Berru Ulusoy under Hüseyin Yolcu’s mentorship, and also it is extended and revised version of the paper presented in 4th Edu-cational Administration Forum held in Balıkesir-Burhaniye on 3-5 October 2013.
ÇOCUKLARINI KAMU İLKÖĞRETİM OKULLARINA GÖNDEREN AİLELERİN İLKÖĞRETİM DÜZEYİNDE
YAPMIŞ OLDUKLARI HANEHALKI EĞİTİM HARCAMALARI
Özet
Bu araştırmanın amacı çocuklarını kamu ilköğretim okullarına gönderen ailelerin yapmış oldukları hanehalkı eğitim harcamalarının miktarı ve bu harcama miktarının okulla ilgili değişkenler ile sosyo-ekonomik bazı değişkenlere göre farklılaşıp farklılaşmadığını ortaya koymaktır. Araştırmanın verileri 2011-2012 eğitim-öğretim yılında Kastamonu ilinde farklı sosyo-ekonomik çevrelerde (SED) bulunan 6 kamu ilköğretim okulundan oluşan bir çalışma gurubu üzerinden toplanmış olup araştırmaya 707 aile katılmıştır. Verilerin çözümlenmesinde betimsel istatistiklerin yanı sıra, non-parametrik testlerden Kruskal Wallis H Testi, parametrik testlerden t-testi ve ANOVA testi kullanılmıştır. Farklılaşmanın olduğu değişkenlerde farkın hangi gruplar arasında olduğunu belirlemek için Manny Whitney U testi ve Post Hoc Tukey testlerine başvurulmuştur.
Ailelerin ilköğretim düzeyinde yapmış oldukları hanehalkı eğitim harcamaları okula ulaşım türü ve okulun SED’ine göre anlamlı bir farklılaşma gösterirken, öğretim biçimi bakımından anlamlı bir farklılık göstermemektedir. Diğer yandan ailelerin eğitim harcamalarının Ailelerin eğitim harcamaları üzerinde çocuğun kiminle yaşadığı, babanın eğitim düzeyi, anne-babanın meslek durumu, ailenin gelir düzeyi, ailenin oturduğu evin türü, ilköğretime devam eden öğrenci sayısı ve devam edilen sınıf düzeyine göre farklılaşmaktadır.
Anahtar Kelimeler: Kamu Okulu, Hanehalkı Eğitim Harcaması, İlköğretim
1. Introduction
The right for education can be defined as a demand or presupposition for indi-viduals’ self-improvement or self-actualization. The very nature of this right most appropriately requires every individual to enjoy it equally and similarly. Moreover, it is necessary that financial resources should be allocated among different social strata and educational levels in fairly equal ways in order to have everybody enjoy this right compatible with their skills and expectations. In this respect, two distinct approaches come up in terms of funding education. First one is public finance. This approach regards education as a public service and educational expenditures are financed from public budget (taxes). Second approach is private finance or finance through fees. Accordingly, the resources for delivery of the educational services are demanded from the beneficiary students or their parents. To say it more clearly, this approach favo-urs the delivery of educational services completely for free market conditions. It is possible to add a third approach to these two. Known as mixed finance, this third approach suggests that all direct or indirect beneficiaries of educational services in the society should take a role in the finance of educational services. That means a large part of society is required to fund education. Bircan (1998) defines the sources of
educational finances in mixed finance approach as public finances (public budget, lo-cal authorities), private resources (non-governmental organizations, private education institutions, persons, students/parents) and international resources (grants and credits by foreign countries, international aid organizations). It should be noted that mixed finance approach has been suggested for parental/student contribution to education expenditures and in practice it best suits into private finance (Kurul, 2012). Therefo-re, this last approach mentioned above has become a well-accepted approach both in Turkey and around the world in favour of marketing the education services delivered by public. In order to better figure out this issue, it is important to put forward how public collaborates with private sector in terms of marketing education.
Around the world and especially in developing countries, 1960s and 1970s wit-nessed a decline in the share of public finance in education and an increase in the use of private finance resources. It is argued that this increase stemmed from the increase in social demand of education and rapid increases in the delivery of non-educational public services (Ünal, 1996). Beyond these reasons, especially the new liberal rightist politics implementations in order to minimize the public and dispense its public res-ponsibilities during the period from 1980s until now have played an important role. It is possible to illustrate what is said here with the public and private expenditures by Organisation for Economic Co-operation and Development (OECD) countries bet-ween 2000 and 2010. Accordingly, the rate of public resources allocated to education in OCED countries in 2000 was 87.9% on average, while that of private resources was 12,1%. These rates were 83.6% for public and 16.4% for private sector in 2010. When these rates are considered together, it is apparent that public resources in the de-livery of education services in OECD countries have declined considerably, while the use of private resources increased relatively. Moreover, the rate of public and private resource used differs within OECD countries as well. The rate of private resource use for education is 24.2% in Canada, 22.2% in Israel, 19.5 in Mexico, 25.9% in Austra-lia, 29.8% in Japan, 31.4% in UK, 30.6% in USA, 42.1 in Chile and 38.4% in Korea, 2.4% in Finland, and 2.5% in Sweden. Considering the household education expen-ditures, it is seen that the share of household education expenditures among private resources allocated to education is quite high in almost all countries. Accordingly, the ratio of household education expenditures among private resources allocated to edu-cation in Canada is 10.3%, while it is 15.4% in Israel, 19.5% in Mexico, 20.2% in Australia, 20.4% in Japan, 19.7% in UK, 24.5% in USA, 37.8% in Chile, and 27.7% in Korea (OECD, 2013).
In Turkey, it has been an established practice and expectation for a long time for the public to finance education including primary education in particular, secondary and higher education. Yet, the “Survey on Education Expenditures for 2002” done by Turkish Statistics Institution ([TSI], 2006) reveals that this has become a controversial issue. The survey results indicate that although education finance is overwhelmingly undertaken by public authorities, private sector also plays a considerable role in edu-cation finance. When the data of this survey is converted into 2010 constant prices,
65.8% of the education expenditures in 2010 in Turkey were paid by public finance and 34.2% by private sector. Furthermore, the ratio of household education expendi-tures among private spending is 96%. Based on the results of the same survey, it is also evident that a similar situation is also true for primary education level which is stipulated to be obligatory and free as per Article 42 of Turkish Constitution. Accor-dingly, about 64.7% of the education expenditures in 2002 in Turkey were paid by public finance and 35.1% by private resources. Similarly, about 96 % of the private finance spent in primary education comes from households (Eğitim Reform Girişimi [ERG], 2013).
Taking the national and international data into consideration presented above, it becomes evident that the rate of household education expenditures among private ex-penditures for education in Turkey is well above those of OECD countries. Although these data belongs to 2002, according to other researches families make considerable spending in education (Akça, 2002; Keskin and Demirci, 2003; Tansel and Bircan, 2004; TÜİK, 2006, Kahveci, 2009; Köktaş, 2009; Ekinci, 2009; Küçüker and Aslan, 2010; Türk Eğitim Derneği [TED], 2010; Sakallı, 2010). All these are important in showing how the right to have and access education in Turkey is associated with market conditions. Moreover, it is thought-provoking that the right to have access to education is manifested so markedly at the primary education level, which is the first and basic level of formal education. Therefore, it is necessary to determine the amount of education expenditures made by the parents of public primary education students and how the amount of these expenditures differ according to school-related and socio-economic variables. The relevant literature presents a considerably limited number of researches about household education expenditures by parents at primary education (Akça, 2002; Kahveci 2009; Sakallı, 2010). Therefore, beyond being one of the rare studies on this issue, the present study is unique in that it investigates the possible differences between parental household education expenditures according to school-related and socio-economic variables. In this regard, the present study can be deemed important as it removes a gap in the relevant literature.
The purpose of the study is to determine the amount of education expenditures made by the parents of students who attend public primary education schools and how the amount of these expenditures differ according to school-related and socio-econo-mic variables. Answers to following questions were sought in the study:
1. What is the amount of household education expenditures spent by parents who-se children attend public schools at the primary education? How are thewho-se expenditu-res distributed according to types of direct and indirect education expendituexpenditu-res?
2. How do the parents’ household education expenditures at the primary education level differ according to school-related variables (type of school instruction, type of school transportation and the SES of school environment)?
3. How do the parents’ household education expenditures at primary education level differ according to socio-economic variables (the people whom the student li-ves with, educational background of parents, professions of parents, monthly income, type of accommodation, number of students at primary education, and grade)? 2. Method
2.1. Research design
Survey research design was used in this study. 2.2. Research group
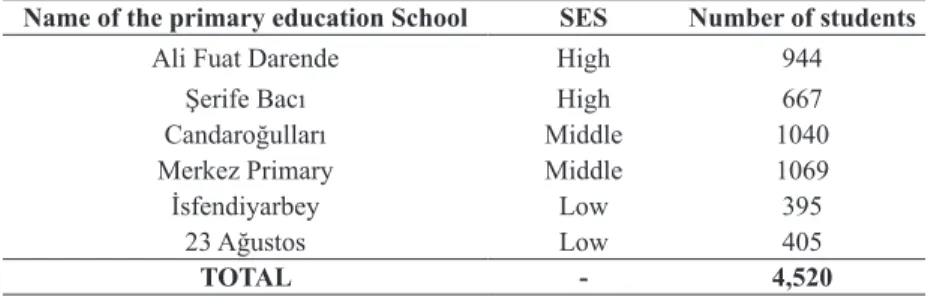
A research group including six of these public schools was formed. Two of the schools in the research group are located in low SES environments, two in middle SES environments, and two in high SES environments. In order to determine the SES of these schools, both the authorities in Kastamonu Provincial Directorate of National Education and the principals of relevant schools were consulted. Moreover, relevant schools were visited by the researchers and observed so as to confirm the actual SES of the environments they are located in. As a result of all these attempts, the schools to be involved in the study were decided. Information about the schools included in the research group was given in Table 1.
Table 1. Information about the Public Primary Education Schools
Name of the primary education School SES Number of students
Ali Fuat Darende High 944
Şerife Bacı High 667
Candaroğulları Middle 1040
Merkez Primary Middle 1069
İsfendiyarbey Low 395
23 Ağustos Low 405
TOTAL - 4,520
(Kastamonu İl Milli Eğitim Müdürlüğü, 2012)
Among the parents, the children of 183 (25.9%) goes to school on foot, 452 (63.9 %) by school service, and 72 (10.2%) via their parents’ car. 382 (54%) of the parents send their children to public primary education schools with half-day instruction, and 325 (46%) send their children to schools providing full-day instruction. Children of 664 (93.9%) parents live with their parents, 27 (4.1%) live with their mother, 5 (0.7%) live with their fathers, and 11 (1.5%) live with one of the elder relatives other than parents. Among the participating mothers 16 (2.3%) were literate, 372 (52.6%) were primary education graduates, 175 (22.2%) were high school graduates, and 162 (22.9%) were university graduates, while 6 (0.8%) of the parents were literate, 233 (33%) primary education graduates, 206 (29.1%) were high school graduates, 262
(37.1%) were university graduates. Among the participating mothers 64 (9.1%) were workers, 121 (17.1%) were civil servants, 26 (3.7%) were self-employed, 5 (0.7%) were retired, and 491 (69.4%) were housewives. On the other hand, 200 (28.3%) of the fathers were workers, 267 (37.8%) were civil servants, 195 (27.6%) were self-employed, 30 (4.2%) were retired and 15 (2.1%) were unemployed. Monthly income of the 136 of the parents were (19.2%) 750 TL or below, that of 208 (29.4%) were between 751-1,500 TL, that of 172 (24.3%) were between 1,501-2,500 TL, and that 191 (27.1%) were 2,500 TL or above. In terms of accommodation, 23 parents (3.3%) live in building sitesshanties, 155 ( 21.9%) live in a detached house, 480 (67.9%) live in an apartment, and 49 (6.9%) live in houses provided by their employers. Among the participating parents 325 (50.8%) reported to have 1 child attending to primary education, 296 (41.9%) reported 2, and 52 (7.4%) reported 3. Children of 68 (9.6%) parents attend 1st grade, 68 (9.6%) attend 2nd grade, 63 (8.9%) attend 3rd grade, 57 (8.1%) attend 4th grade, 84 (11.9%) attend 5th grade, 42 (5.9%) attend 6th grade, 37 (5.2%) attend 7th grade, and 14 (2%) attend 8th grade. Lastly, 274 (38.8%) of the parents reported to have more than one child attending formal education.
2.2. Instrument
The research data were collected using “Questionnaire for Parental Household Expenditures on Education at Primary Education Level” developed by the researc-hers. While developing the questionnaire, similar research in the literature were used (Akça, 2002; Tilak, 2002; TSI, 2006; Arthaud, 2008; Kahveci, 2009; Sakallı, 2010; Yolcu, 2011). After a draft form of the instrument was developed, it was presented to a panel of 14 experts for their opinions and suggestions. Based on the feedback from experts, necessary modifications were done and the content validity of the instrument was justified. Moreover, the questionnaire was administered to 10 parents from the public schools in the research group within a pilot study in order to test the clarity of the items. As a result of the pilot study, no problems were faced in terms of clarity of the instrument. The main data were collected between 15 May and 15 June 2012.
The questionnaire was composed of two parts. In the first part there are questions about the independent variables of the research including SES of the public school, the type of instruction, type of school transportation, the people with whom the child lives, parents’ educational background, parents’ professions, monthly income, type of accommodation, number of students attending primary education, and students’ grade level. In the second part, there are questions which aim to determine parents’ level of household education expenditures at public primary education schools, which is the dependent variable of the research. In this regard, parents’ household education ex-penditures at primary education level were categorized under 23 dimensions. Parents were asked to write down in the relevant box the amount of their average expenditures in TL currency during 2011-2012 school year.
Descriptive statistics were used in analysing the data for the first question. The data about the second and third research questions were analysed using parametric t test and one-way analysis of variance (ANOVA), and non-parametric Kruskal Wallis H test. Mann Whitney U test and Post Hoc Tukey test were used to find out the diffe-rences between groups.
3. Findings
The findings about the level of household education expenditures by parents are presented in accordance with the research questions.
3.1. Findings about Parents’ Direct, Indirect and Total Education Expenditu-res at Primary Education Level
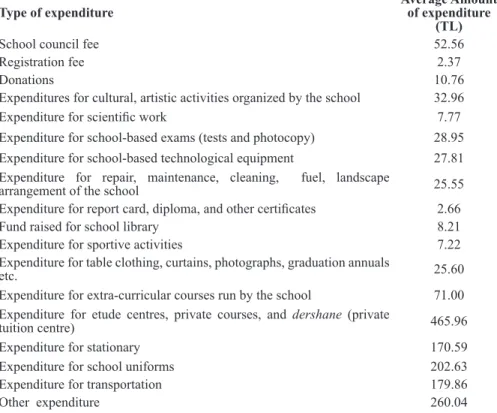
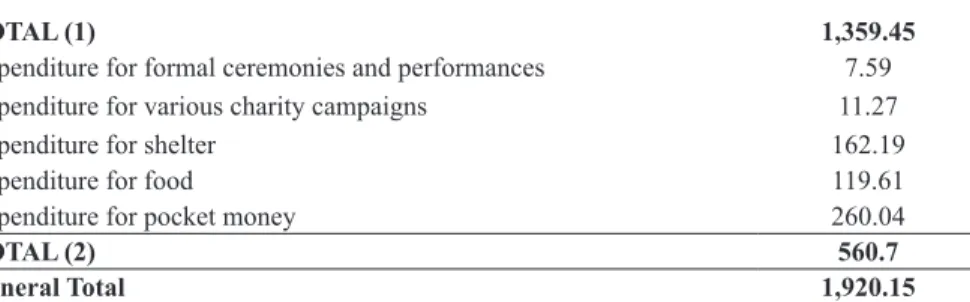
The findings about the level of direct, indirect and total household education ex-penditures by parents are presented in Table 2.
Table 2. The Distribution of Direct, Indirect and Total Household Education Ex-penditures
Type of expenditure Average Amount of expenditure (TL)
School council fee 52.56
Registration fee 2.37
Donations 10.76
Expenditures for cultural, artistic activities organized by the school 32.96
Expenditure for scientific work 7.77
Expenditure for school-based exams (tests and photocopy) 28.95
Expenditure for school-based technological equipment 27.81
Expenditure for repair, maintenance, cleaning, fuel, landscape
arrangement of the school 25.55
Expenditure for report card, diploma, and other certificates 2.66
Fund raised for school library 8.21
Expenditure for sportive activities 7.22
Expenditure for table clothing, curtains, photographs, graduation annuals
etc. 25.60
Expenditure for extra-curricular courses run by the school 71.00 Expenditure for etude centres, private courses, and dershane (private
tuition centre) 465.96
Expenditure for stationary 170.59
Expenditure for school uniforms 202.63
Expenditure for transportation 179.86
TOTAL (1) 1,359.45
Expenditure for formal ceremonies and performances 7.59
Expenditure for various charity campaigns 11.27
Expenditure for shelter 162.19
Expenditure for food 119.61
Expenditure for pocket money 260.04
TOTAL (2) 560.7
General Total 1,920.15
As it is seen in Table 2, parents who send their children to public primary educa-tion schools made an average household educaeduca-tion expenditure of 1,920.15 TL for a child during 2011-2012 school year. 1,359.45 TL (70.8%) of this expenditure was direct, while 560.7 TL (29.2%) were indirect.
3.2. Findings about Household Education Expenditures According to School-Related Variables
Below are the findings about household education expenditures according to type of school transportation, type of instruction, and school’s SES.
Transportation to school
Findings about household education expenditures by parents whose children at-tend public primary education schools according to type of school transportation are given in Table 3.
Table 3. F Test Results about the Household Education Expenditures According to Type of School Transportation
Sum of squares df Mean square F P* Tukey A Test**
Between groups 1,203 2 6,013 14,471 ,000
Within groups 2,925 704 4155254,424 1-2**
Total 3,046 706
* P< .01 1**. Service 2**. On foot 3**. Private car
As it is seen in Table 3, the level of household education expenditures by parents of students attending public primary education schools differ significantly according to the type of transportation to school (F(2-704)= 14,471; P< .01). The Post-Hoc Tukey A test revealed that the education expenditures made by parents who send their children to school via school service ( Service= 2.580,70) are significantly higher than those of parents whose children go to school on foot ( Foot= 1.620,30).
Type of school instruction
Findings about household education expenditures by parents whose children at-tend public primary education schools according to type of school instruction are given in Table 4.
Table 4. t Test Results about the Household Education Expenditures According to Type of Instruction Type of instruction n S Df t P 1-Full day 382 1.876,56 1.887,811 705 .343 ,732 2-Half day 325 1.930,37 2.281,997
As it is seen in Table 4, the level of household education expenditures by parents of students attending public primary Education Schools did not differ significantly according to the type of instruction at school (t(705)= 343; P>.01). The amount of expen-diture by parents whose children attend a half-day school ( Half= 1.930, 37), however, is higher than expenditures of parents whose children attend a full-day school ( Full= 1.876, 56).
School’s SES
Findings about household education expenditures by parents whose children at-tend public primary education schools according to type of school’s SES are given in Table 5.
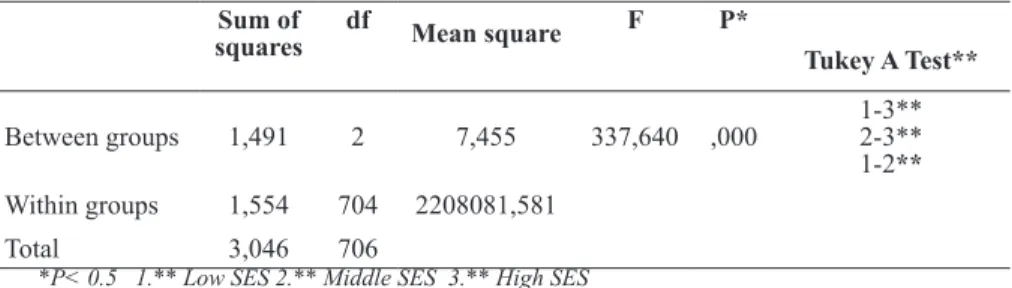
Table 5. F Test Results about the Household Education Expenditures According to Type of School’ SES
Sum of
squares df Mean square F P* Tukey A Test**
Between groups 1,491 2 7,455 337,640 ,000 1-3**2-3**
1-2**
Within groups 1,554 704 2208081,581
Total 3,046 706
*P< 0.5 1.** Low SES 2.** Middle SES 3.** High SES
As it is seen in Table 5, the level of household education expenditures by parents of students attending public primary education schools differ significantly according to the type of transportation to school (F(2-704)= 337,640; P<.05). The Post-Hoc Tukey A test revealed that the household education expenditures made by parents who send their children to high SES schools ( High SES= 3.678,72) at primary education level are significantly more than those of parents who send their children to low SES schools (
Low SES= 444,24) and those of parents who send their children to middle SES schools ( Middle SED= 1.262,00). It was also found household education expenditures made by parents who send their children to middle SES schools ( Middle SES= 1.262,00) are significantly more than those of parents who send their children to low SES schools (
3.3. Findings about Household Education Expenditures According to Socio-Economical Variables
No association was observed between household education expenditures by pa-rents whose children attend public primary education schools and possession of ac-commodation, type of house, amount of house rent, number of household, and num-ber of taking education grant. However, significant differences were found between household education expenditures by parents whose children attend public primary education schools according to whom the student live with, parental educational back-ground, parents’ profession, monthly income, number of total children attending pri-mary education, and students’ grade level. Below are the findings.
Whom the Student Lives with
Findings about household education expenditures by parents whose children at-tend public primary education schools according to whom the student lives with are given in Table 6.
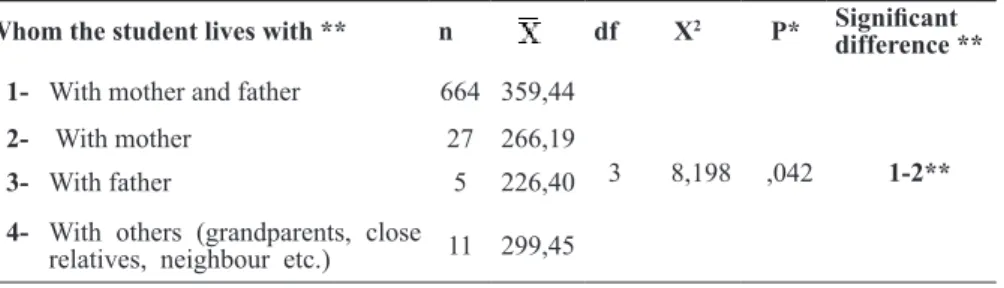
Table 6. Kruskal Wallis H Test Results about the Household Education Expen-ditures According to Whom The Student Lives with
Whom the student lives with ** n df X2 P* Significant
difference ** 1- With mother and father 664 359,44
3 8,198 ,042 1-2**
2- With mother 27 266,19
3- With father 5 226,40
4- With others (grandparents, close
relatives, neighbour etc.) 11 299,45
*P< 0.5
According to Table 6, a statistically significant difference was found between levels of household education expenditures by parents of students attending public primary education schools according to the people whom the student lives with (X2
(3)=8,198, P<.05). The follow-up Mann-Whitney U test (U= 6596,000; P<.05) revealed that the household education expenditures of parents whose child live with them ( Mother-Fat-her=359,44) are significantly higher than household education expenditures by parents whose children live with the mother only ( Mother =266,14).
Mother’s Educational Background
Findings about household education expenditures by parents whose children at-tend public primary Education Schools according to their mothers’ educational back-ground with are given in Table 7.
Table 7. Kruskal Wallis H Test Results about the Household Education Expen-ditures According to Mother’s Educational Background
Mother’s educational
background ** n df X2 P* difference* *Significant
1-Literate 16 235,59 3 74,969 ,000 1-3** 1-4** 2-3** 2-4** 2-Primary education 372 297,93 3-High school 157 406,45 4- University 162 443,62 * P< .01
According to Table 7, there is a statistically significant difference between levels of household education expenditures by parents of students attending public primary education schools according to their mother’s educational background (X2
(3)=74,969 P<.01). The follow-up Mann-Whitney U test revealed that the household education expenditures of students whose mothers are high school graduates ( High school= 406,45) are significantly higher than those of students whose mothers are literates ( Literate= 235,59 TL) (U= 685,500, P< .01) and those of students whose mothers are primary education graduates ( Primary school = 297,93) (U= 20393,500, P< .01); and also the household education expenditures of students whose mothers are university graduates ( University= 443,62) were significantly higher than those of students whose mothers are literates ( Literate= 235,59 TL) (U=571,000, P< .01) and those of students whose mot-hers are primary education graduates ( Primary school = 297,93) (U=17482,000, P< .01).
Father’s Educational Background
Findings about household education expenditures by parents whose children at-tend public primary education schools according to their father’s educational back-ground with are given in Table 8.
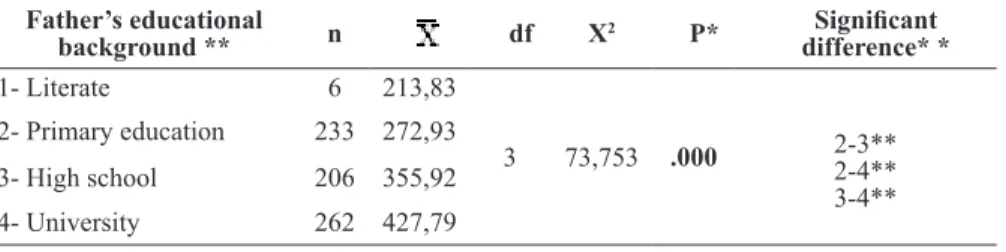
Table 8. Kruskal Wallis H Test Results about the Household Education Expendi-tures According to father’s Educational Background
Father’s educational
background ** n df X2 P* difference* *Significant
1- Literate 6 213,83 3 73,753 .000 2-3**2-4** 3-4** 2- Primary education 233 272,93 3- High school 206 355,92 4- University 262 427,79 * P< .01
of household education expenditures by parents of students attending public primary education schools according to father’s educational background (X2
(3)=73,753 P< .01). The follow-up Mann-Whitney U test (U= 18250,000, P< .01) revealed that the household education expenditures of students whose fathers are high school graduates ( High school= 355,92) are higher than those of students whose fathers are secondary/ primary education graduates ( primary= 272,93). Also the household education expen-ditures of students whose fathers are undergraduate/university graduates ( University= 427,79) were found to be higher than those of students whose fathers are secondary/ primary education graduates ( primary= 272,93) and high school graduates ( High school= 355,92).
Mother’s Profession
Findings about household education expenditures by parents whose children at-tend public primary education schools according to mother’s profession with are gi-ven in Table 9.
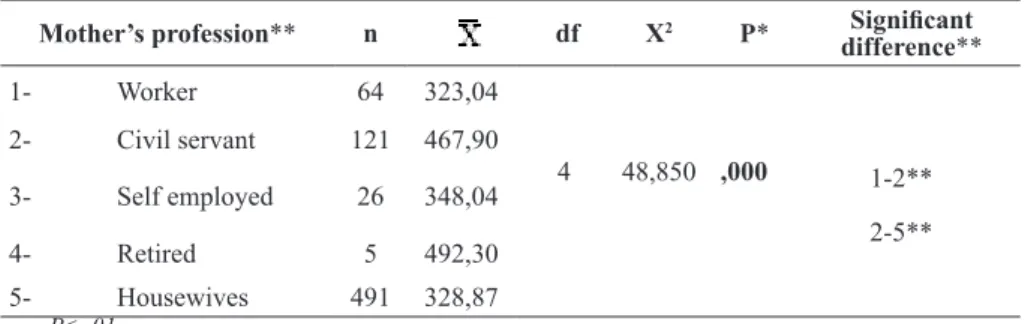
Table 9. Kruskal Wallis H Test Results about the Household Education Expendi-tures According to Mother’s Profession
Mother’s profession** n df X2 P* Significant
difference** 1- Worker 64 323,04 4 48,850 ,000 1-2** 2-5** 2- Civil servant 121 467,90 3- Self employed 26 348,04 4- Retired 5 492,30 5- Housewives 491 328,87 P< .01
According to Table 9, a statistically significant difference was found between le-vels of household education expenditures by parents of students attending public pri-mary education schools in terms of their mother’s profession (X2
(4)= 48,850, P< .01). The follow-up Mann-Whitney U test revealed that the household education expendi-tures of students whose mothers are civil servants ( Civil servant= 467,90) were higher than those of students whose mothers are workers ( Worker= 323,04) (U= 2271,000, P< .01) and those of students whose mothers are housewives ( Housewives= 328,87) (U= 17947,500, P< .01).
Father’s Profession
Findings about household education expenditures by parents whose children at-tend public primary Education Schools according to father’s profession with are given in Table 10.
Table 10. Kruskal Wallis H Test Results about The Household Education Expen-ditures According to Father’s Profession
Father’s profession** n df X2 P* Significant difference**
1- Worker 200 320,28 4 58,887 ,000 1-2** 2-3** 2-5** 2- Civil servant 267 427,38 3- Self employed 195 306,50 4- Retired 30 301,25 5- Unemployed 15 220,37 * P< .01
According to Table 10, a statistically significant difference was found between levels of household education expenditures by parents of students attending public primary education schools according to father’s profession (X2
(4)= 58.887, P<.01). The follow-up Mann-Whitney U test revealed that the household education expendi-tures of students whose fathers are civil servants ( Civil servant= 427,38) are higher than those of students whose fathers are workers ( Worker= 320,28 TL) (U=18458,000, P< .01), those of students whose fathers are self-employed ( Self-employed= 306,50) (U= 17094,500, P<.01), and those of students whose fathers are unemployed ( Unemployed= 220,37) (U= 914,500, P<.01).
Monthly Income
Findings about household education expenditures by parents whose children at-tend public primary education schools according to family’s monthly income are gi-ven in Table 11.
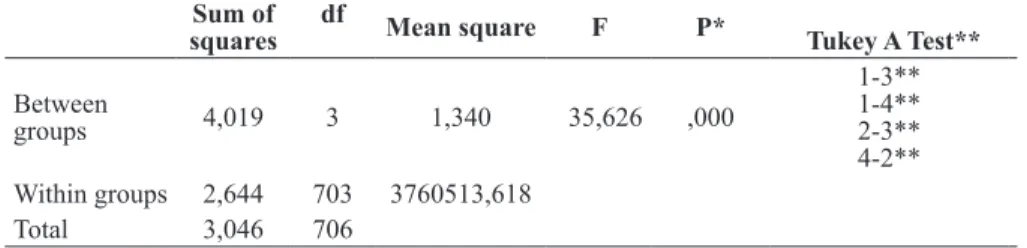
Table 11. F Test Results about the Household Education Expenditures According to Family’s Monthly Income
Sum of
squares df Mean square F P* Tukey A Test**
Between groups 4,019 3 1,340 35,626 ,000 1-3** 1-4** 2-3** 4-2** Within groups 2,644 703 3760513,618 Total 3,046 706 * P< .01 1**. 750 TL or less 2**. 751-1500 TL 3**. 1501-2500 TL 4**. 2501 TL or over
As it is seen in Table 11, the level of household education expenditures by parents of students attending public primary education schools differ significantly according to the family’s monthly income (F(3-703)= 35,626; P<.01). The Post-Hoc Tukey A test
re-vealed that the household education expenditures made by parents whose monthly in-come is 2.501 TL or more ( 2501 TL or more = 2.840,81) are significantly higher than those of parents whose monthly income is between 751-1500 TL ( 751 -1500 TL = 1.329,97) and those of parents whose monthly income is 750 TL or less ( 751 -1500 TL = 1.329,97). Also it was found that the household education expenditures made by parents whose monthly income is between 1501-2500 TL ( 1501 -2500 TL= 2.332,27) are significantly higher than those of parents whose monthly income is between 751- 1500 TL ( 751 -1500 TL = 1.329,97) and those of parents whose monthly income are 750 TL or less ( 751 -1500 TL = 1.329,97).
Number of Children Studying at Primary education
Findings about household education expenditures by parents whose children at-tend public primary education schools according to the number of children studying at primary education are given in Table 12.
Table 12. F Test Results about the Household Education Expenditures According to The Number of Children Studying at Primary Education
Sum of
squares df Mean square F P* Tukey A Test**
Between groups 5,486 2 2,743 6,457 ,002 1-2**1-3**
Within groups 2,991 704 4248157,276
Total 3,046 706
* P< .05 1 child **. 2 children 2**. 3 children 3**. 4 children 4**. 5 children 5**. 6 children or more As it is seen in Table 12, the level of household education expenditures by parents of students who attend public primary education schools differ significantly accor-ding to the number of children studying at primary education (F(2-704)= 6,457; P<.05). The Post-Hoc Tukey A test revealed that the household education expenditures made by parents who have three children studying at primary education ( Three children = 2.475,21) are higher than those of parents have two children studying at primary education ( Two children= 2.115,24) and those of parents who have one child studying at primary education ( One child = 1.641,76).
The Grade Level
Findings about household education expenditures by parents whose children at-tend public primary Education Schools according to the students’ grade level are gi-ven in Table 13.
Table 13. F test Results about the Household Education Expenditures According to The Students’ Grade Level
Sum of squares df Mean square F P* Tukey A Test**
Between groups 1,433 8 1,791 4,307 ,000 2-8**
2-9**
Within groups 2,902 698 4158029,265
Total 3,046 706
* P< .01 1**-1st class 2**- 2nd class 3**- 3rd class 4**- 4th class 5**- 5th class 6**- 6th class 7**- 7th
class 8**- 8th class 9**- more than one child
As it is seen in Table 13, the level of household education expenditures by parents of students attending public primary education schools differ significantly according to the students’ grade level (F(8-698)= 4,307; P<.01). The Post-Hoc Tukey A test revea-led that the household education expenditures made by parents whose children attend to 8th grade (
8th class = 3.189,07) are significantly higher than those of parents whose children attend 2nd grade (
2nd class= 1.305,75). It was also found household education expenditures made by parents who have more than one children attending primary education ( More than one=2.342,30) are significantly higher than those of parents whose children attend 2nd grade (
2nd class= 1.305,75).
4. Conclusion, Discussion and Recommendations
The purpose of the study was to find out the amount of household expenditures by parents of the primary education students and whether these expenditures differ in terms of some school-related variables and socio-economic variables. The findings of the research showed that parents make considerable expenditures at primary education level, and these expenditures differ significantly according to school-related variables and socio-economic variables.
The data about the household education expenditures of the parents who send their children to public primary education schools in 2011-2012 school year indicated that parents made a considerable contribution to educational costs. This considerable incre-ase in parents’ household education expenditures can be explained with the large share of direct educational expenditures such as a child’s school fee, books, stationary, uni-form, school bag and transportation in the total education expenditures. Based on the research findings, the ratio of direct education expenditures in total education expendi-ture is 70,2%, while it is 29,2 indirect education expendiexpendi-tures for food, shelter, pocket tip, clothing etc. According to OECD (2013) statistics considerable decreases in public education expenditures in many European Union countries including Estonia, Greece, Hungary, Ireland, Italy, Portugal, Spain and UK have been accompanied with an incre-ase in parents’ household education expenditures. When public education expenditures
per student increased by 1000 Yuan in China, parents’ expenditures for private courses decreased by 36 Yuan, which is in consistency with what has been said above (Yuan and Zhang, 2012).
Parents’ educational expenditures at primary education level differed significantly according to the type of transportation to school. Educational expenditures by parents who send their school via school bus are higher than those of parents who send their children on foot. Using school service or personal cars for student to school increase pa-rents’ household education expenditures at primary education level, as well as causing adverse outcomes in terms of equality of opportunities in education. In this case, parents from middle or upper SES groups send their children to public schools which they think have a more favourable learning environments; parents from lower SES groups are dep-rived of this opportunity. This finding is consistent with the findings of previous research in the literature (Aktaş, 2004; Lai-ngok, 2004; Bernal, 2009). Aktaş (2004) reported that families from lower and middle SES groups mostly prefer close schools avoiding transportation costs, whereas upper SES families send their children to schools which are believed to provide better education breaching the address-based registration system and putting up with certain amount of transportation costs. Lai-ngok (2004) found that parents who usually prefer schools out of designated school district in Guangdong State of China were from upper SES groups. Bernal (2009, 2013) states that parents who represent the poorest part of the society in economic terms in Zaragoza prefer the closes school instead of more suitable learning environments for their children.
Household education expenditures of parents at primary education level differed significantly in terms of schools’ SES. Accordingly, parents who send their children to low SES public primary Education schools made an average household education ex-penditure of 444,24 ₺, while parents of students in middle SES public primary education schools spend 1.262 ₺ in education, and lastly parents of students in upper SES spend an average of 3.678,72 ₺. Considering this data together, the educational expenditures at primary level by parents who send their children to schools located in upper SES envi-ronments are about eight times more than those of parents whose children study at a low SES public primary education schools, and about nine times more than those of parents whose children study at a middle SES public primary education schools. This result is in consistency with the research findings by Özdemir (2011). According to Özdemir’s (2011) findings while parents from upper SES make direct education expenditures of about 180 ₺ per student for the upper SES schools their child attends, this amount of ex-penditure ranged between 66 ₺ and 32 ₺ in middle and lower SES schools. Considering that primary education represents the first and basic stage of education, this situation is very remarkable in terms of showing how the ability to access quality knowledge and learning environment in this basic school level which is insistently stressed in relevant Articles in Constitution for being free is associated with market conditions. With the educational expenditures by parents the learning environments in schools are no more public places based on the SES of the environment the school is located, and they
be-come educational places claimed by different socio-cultural groups and excluding other (Ünal et al., 2010).
It is acknowledged that living with single parent or both parents is effective in terms of household educational expenditures. The findings of the research also support this supposition. Accordingly, families with two parents were found to make significantly more educational expenditures at primary level than families with mother as the single parent. Kim and Lee (2004) also reported that single mothers spend more on private courses. According to Baum and Payea (2005) 49 % of the children aged under 18 and living with their mothers only cannot continue their high school education, and this rate is only 19% for the children living with both parents. That means children living with their mothers and fathers are more likely to progress more through school stages, and make more educational expenditures. On the contrary, Tansel and Bircan (2004) found that single mothers make more expenditures on private courses compared to married mothers. Similarly Omori (2010) found that single mothers make more expenditure on their children’s education compared to families with both parents.
Mother’s and father’s profession are also decisive in household education expendi-ture. In this case, parents may not be willing to make expenditure on education when they work at low paying jobs. On the contrary, when single parent or both parents work at a high paying job this may lead them to be more willing to make more educatio-nal expenditure (European Commission Report, 2005). For example, in China, fathers working at white colour jobs make an average of 20 $ more expenditure on their child-ren at primary education level compared to others working as blue colour workers and others. Mothers working as white colour workers and as blue colour workers differ very slightly in their expenditures on education (Shi, 2006). Tilak (2002) found out that household working in agricultural sector in India make considerable investment in their children attending primary schools. In the present research, the findings regarding the association between mother’s and father’s profession and educational investment at primary education level are in consistency with the previous research. Considering the mothers’ professions, there seems to be a difference between educational expenditures of families in which mothers work at low-status professions and high-status professi-ons. This difference is observed especially between civil servant mothers and worker mothers and housewives. Accordingly, families in which mother works as civil servant make more expenditure on education at primary education level compared to families with the mother working as worker or housewives. This difference can be explained with the differences with regard to their educational background. Also the superiority of civil servant mothers over unemployed mothers in terms of educational expenditures can be explained with the higher rates of savings in families with employed mothers. Because working women spend more on their families unlike the working men. Men on the other hand spend relatively more on alcohol, cigarette, and entertainment, whereas women spend more on the education and health of their children (Gürsel, Uysal and Acar, 2011). As for the differences between parental expenditures on education in terms
of father’s profession, families with fathers working as civil servants were found to make more expenditures on their children’s education compared to families with fathers who are workers, self-employed or unemployed. Similarly, Huy (2012) reported that Vietnamese fathers working at white colour jobs make expenditures on their children’s education 2.65 times more than fathers working at blue colour jobs.
According to human capital theory, higher levels of education refer to higher inco-me. Therefore, it is expected that as the level of parental educational level increases the amount of expenditures on their children’s education will also increase. This is because more educated individuals regard investment in education as an investment in human capital. For example, Tansel and Bircan (2004) indicated that parents with higher edu-cational background spend more on private courses compared to parents with lower educational backgrounds. In USA, the educational expenditures of high school graduate parents are 65% more than parents who are not high school graduates. This increases the rate of 2.38 among college or university graduates (Omori, 2010). It was reported that in China, the expenditures of families with both parents graduated from colleges on course books are 50 Yuan more than those of families with both parents not graduated from high school (Yuan and Zhang, 2012). In Vietnam, the increase of education level of the head of the family positively affects parents’ expenditures on their children’s education. For example, the educational expenditures in families with a secondary school or colle-ge graduate head parent are approximately 2.2 times more than those of families with an uneducated head parent (Huy, 2012). In the present study, the educational expenditures of families with a university graduate mother were found to be more than those of fa-milies with mothers who are literate, primary education graduates, or high school gra-duates. Likewise, parents’ household education expenditures at primary education level differed significantly in terms of fathers’ educational background. Accordingly, families with a high school graduate father make more educational expenditures at primary edu-cation level compared to families with fathers who are literate and primary eduedu-cation graduates. Also families with university graduate fathers make educational expenditures at primary level more than families with fathers who are primary education graduates and high school graduates. That means as the fathers’ level of educational background increases, their educational expenditures also increase.
Income is of considerable importance since it is a means of meeting basic human ne-eds. Therefore, income inequality causes serious inequalities among people when basic public services are delivered under market conditions (Boğaziçi Üniversitesi Sosyal Po-litika Forumu, 2010). In this regard, it is inevitable that income level is decisive in terms of inequalities in parental expenditures on education which actually should be offered free of charge as a public service. The income elasticity of educational decisions is con-sidered as a parameter in market and macro economy (Acemoğlu and Pischke, 2001). In more concrete words, as the level of income increase the demand for education is also expected to increase. For example, in Tanzania while families representing the poorest part of the population invest 2,6% of the household budget to education, this ratio is 5.4
percent among most well off part of the population (Nations Educational, Scientific and Cultural Organization, 2012). According to a research in China, an increase of 1000 Yuan in the incomes of urban families causes an increase in these families’ expenditu-res on private courses by about 80 Yuan and on course books by about 8 Yuan (Yuan and Zhang, 2012). In the present study, a significant difference was observed between parents’ education expenditures at primary education level in terms of monthly income levels. Accordingly, families with a monthly income between 1,501-2,500 ₺ make more educational expenditure at primary education level compared to families with a monthly income level of 750 ₺ or less and families with monthly income level between 751 and 1,500 ₺ and also families with a monthly income level of 2,501₺ or above were found to make more educational expenditure at primary education level compared to families with monthly income level of 751 ₺ or less and families with monthly income level between 751-1500 TL. Therefore, the findings of the present research are consistent with the findings of previous research. Among the participating families those with a monthly income level of 750 ₺ or less made an average education expenditure of 910 TL for 2011/2012 school year, while those families with a monthly income level of 2,501 ₺ or more spent 2,840.81 ₺ on average. Based on these data, it can be said that educational expenditures of families at the top of income level are about threefold of educational expenditures of families at the bottom of income level. Considering that minimum net wages in Turkey in 2011 was 658,95 TL, families with the lowest monthly income level seems to spend for the education of their children exceeding their actual income level. Tansel and Bircan (2004) also investigated the income levels of parents whose children attend to private courses and found that parents with low and middle income levels send to private course more. This finding of the present study is in agreement with Tilak’s (2002) and De’s (2012) research findings about Indian context. Tilak (2002) found that in India while families from lower income groups spend 6,9% of their total incomes on their children’s education, for families from upper income groups this ratio is 0.63%. De (2012) similarly reported in a research covering 23 states that in many states the poorest part of the population spend a considerable part of their income on education compared to more well of parents.
In the present research, it was also found that amount of parents’ household expendi-tures on primary education differed significantly according to the students’ grade level. This is an already expected result. The results suggested that parents make the most ex-penditure for the children attending 8th grade. This is because entrance to academically selective high schools after eight grade is through a central national exam in Turkey. Mo-reover, parents’ are not satisfied with the quality of education services provided in public schools, which compels the parents to make expenditures on these exams. Those parents who send their children either to public or private schools need to send their children to private courses, etude centres or paying for private lessons in order to have their child-ren prepare for the high school institution selection exams (SBS/OKS) increase their amount of expenditure at this education level. In South Korea parents’ expenditures on private courses at primary and secondary education levels constitutes 2.9% of the
gross domestic product (Kim, 2005). In Turkey, according to İstanbul Chamber of Free Accountants and Financial Counsellor (2010), parents’ total expenditure on SBS/OKS courses is 1.2 billion ₺. Moreover, previous research in the relevant literature reveal that the private course or lesson expenditures of the families whose children study at public schools are higher than those of families whose children attend to private schools. This is because parents who send their children to private courses or invest on private lessons are concerned about the quality of education provided in the public schools thus trying to compensate this disadvantage of their children. Those parents whose children study at a private school believe that their children need no private course or lesson since the education provided in private school is already qualified (Akça, 2002). According to the a TSI survey in 2002, private course or lesson expenditures of parents whose children study at public schools constitutes about 8% of their total education expenditures, this ratio is limited to about 1.5% among parents whose children study at private schools. Similarly, Tansel and Bircan (2004) investigated the students attending private course in terms of their parent’s income level and found that those parents from middle or low income groups send their children to private course more. Considering all these research findings together, parents from lower socio-economical groups are strictly adhered to the myth that education is a critical area of social mobility.
Considering that the findings of the present research is confined to primary edu-cation level, it can be recommended that further research with a more collective and longitudinal scope can be done.
5. References
Acemoglu, D. and Pischke, J. S. (2001). Changes in the Wage Structure, Family Income, and Chil-dren’s Education. European Economic Review, 45 (4-6), 890-904
Akça, Ş. (2002). Ailelerin ilköğretim kademesine yaptıkları eğitim harcamaları (Ankara İli Örneği). Yayınlanmamış Yüksek Lisans Tezi, Ankara Üniversitesi Eğitim Bilimleri, Ankara.
Aktaş, T. (2004). İlköğretim Okullarının Bütçe Dışı Gelirleri. Yayınlanmamış Yüksek Lisan Projesi, Ankara Üniversitesi Eğitim Bilimleri Enstitüsü, Ankara.
Arthaud, K. (2008). Household Expenditure for Children’s Education. Unpublished Doctoral Disser-tation. School of Applied Statistics National Institute of Development Administration. Baum, S. and Payea, K. (2005). The benefits of higher education for individuals and society. www.
collegeboard.com Accessed 10.05.2011.
Bernal, J. L. (2005). Parental Choice, Social Class and Market Forces: The Consequences of Privati-zation of Public Services in Education, Journal of Education Policy, 20 (6), 779-792.
Bircan, İ. (1998). Eğitimde Maliyet ve Harcamalar. Ankara: DPT Sosyal Planlama Başkanlığı. Boğaziçi Üniversitesi Sosyal Politika Forumu (2010). Türkiye’de Eşitsizlikler: Kalıcı Eşitsizliklere
Genel Bir Bakış İstanbul: Boğaziçi Üniversitesi Yayını
De, S. (2012). New Measures of Household Educational Expenditure Propensities Across Indian States. Income Inequality, Regional Variations and Policy Implications https://cde.buse-co. monash.edu/site/DefaultSite/filesytem/document/ADEW/De%20Household%20education%20
expenditure%20propensity.pdf Accessed 12.3.2013.
Ekinci, C. Ergin. (2009). Türkiye’de Yükseköğretimde Öğrenci Harcama ve Maliyetleri. Eğitim ve Bilim, 34(154) 119-133.
Eğitim Reform Girişimi (ERG) (2013). İlköğretim Kurumlarının Mali Yönetimi. İstanbul: Sabancı Üniversitesi Yayını.
European Commission Report (2005). Private Household Spending On Education And Training Final Project Report. http://cie.ed.asu.edu http://ec.europa.eu/education/pdf/ doc274_en.pdf Accessed September 15, 2010.
Gürsel, S., Uysal, G. ve Acar, A. (2011). Toplumsal Değerler Kadınların Işgücüne Katılmalarına Engel. Bahçeşehir Universitysi Ekonomik ve Toplumsal Araştırmalar Merkezi Araştırma Notu 11/115.
Huy, V. Q. (2012). Determinants of Educational Expenditure in Vietnam. International Journal of Applied Economics, 9(1), 59-72.
İstanbul Serbest Muhasebeci Mali Müşavirler Odası’nın (İSMMMO). (2010). Toplumsal Raporlar: Hayatımız Sınav Raporu. http://archive.ismmmo.org.tr/docs/yayinlar/kita-plar/2010/10_5%20sinav.pdf Erişim tarihi: 12.10.2013
Kastamonu İl Milli Eğitim Müdürlüğü (2012). Örgün Eğitim Istatistikleri. Kastamonu: Kastamonu İl Müdürlüğü İstatistik Şube Müdürlüğü.
Keskin, N. E. and Demirci, A. A. (2003). Eğitimde Çürüyüş. Ankara: KİGEM Özelleştirme Değerlendirmeleri.
Kim, S. and Lee, Ju-Ho. (2004) Private Tutoring and Demand for Education in South Korea. http://www.rrojasdatabank.info/devstate/southkorea1.pdf adresinden Accessed 18.09.2013 .
Kim, T. (2005). Shadow Education: Quality and Demand for Private Tutoring In Korea. Discussion Paper No. 055.
Köktaş, A. M. (2009). Türkiye’de Household Education Expendituresn Analizi. Yayınlanmış Yüksek Lisans Tezi, Ankara Üniversitysi Eğitim Bilimleri Enstitüsü, Ankara.
Küçüker, E. and Aslan, G. (2010). Ailelerin çocuklarının özel okullara gönderme nedenleri. XIV World World Congress of Comparative Education Societies. June 14-18 2010. Istanbul, Turkey. Kurul, N. (2013). Eğitim Finansmanı. Akara: Siyasal Kitapevi.
Lai-ngok, J, Wong (2004). School Autonomy in China: A Comparison between Government and Private Schools within the Context of Decentralization. International Studies of Educational Ad-ministration, 32 (3), 54-73.
Nations Educational, Scientific and Cultural Organization (2012). Household Education Spending. an Analytical and Comparative Perspective for 15 African Countries. Published by UNESCO Office in Dakar.
Organisation for Economic Co-operation and Development (OECD). Education at a Glance 2013 OECD Indicators. OECD Publishing.
Omori, M. (2010). Households’ Expenditures on Children 2007-08. Monthly Labor Review (Sep-tember). p. 2-16.
Özdemir, N. (2011). İlköğretim finansmanında bir araç: okul aile birliği bütçe analizi (Ankara ili örneği). Yayınlanmamış Yüksek Lisans Tezi, Hacettepe Üniversitesi Sosyal Bilimler Enstitüsü, Ankara.
Qian, X. and Smyth, R. (2008). Educational Expenditure In Urban China: Income Effects, Family Characteristics And The Demand For Domestic And Overseas Education. Asian Business and Economics Research Unit Discussion Paper 60.
Sakallı, F. (2010). İlköğretim okulu öğrenci velilerinin eğitim harcamaları. Yayınlanmamış yüksek lisans tezi, Gazi Universitysi Eğitim Bilimleri Enstitüsü, Ankara.
Shi, Y. (2006). The Private Direct Costs Of Primary Education In Urban China. Education and Po-verty in in International Context. (Eds: R. Bangura, T. D. Jules, C. J. Calcagno and Y. Zha.). New York: Columbia University. pp. 51-64.
Tansel, A. ve Bircan, F. (2004). Private Tutoring Expenditures in Turkey. IZA Discussion Paper Se-ries no. 1255.s
Tilak, J., B. G. (2002). Determinants of Household Expenditure on Education in Rural Indiana. Rese-arch Working Paper Series No: 88. New Delhi: The Department of National Council of Applied Economic.
Türk Eğitim Derneği (TED) (2010). Ortaögretime Ve Yüksekögretime Geçis Sistemi. Ankara: Türk Eğitim Derneği Yayını.
Turkish Statistics Institution (TSI) (2006). Turkey Education Expenditure Research 2002. Ankara: Turkish Statistics Institution Press.
Ünal, I., Özsoy, S., Yıldız, A., Güngör, S., Aylar, E., and Çankaya, D. (2010). Eğitimde Toplumsal Ayrışma. Tübitak 1001-AraştırmaProjeleri Destek Programı Çerçevesinde Sosyal ve Beşeri Bilimler AraştırmaGrubu Yürütme Komitesi Tarafından Desteklenen Araştırma Raporu. Ünal, L. I. (1996). Eğitim ve Yetiştirme Ekonomisi. Ankara: Epar Yayınları.
Yolcu, H. (2011). Hanehalkı Eğitim Harcamalarını Etkileyen Etmenler: Kuramsal Bir Çalışma. Mehmet Akif Ersoy Üniversitesi Sosyal Bilimler Enstitüsü Dergisi, 5 (3), 12-35.
Yuan, C. and Zhang, L. (2012). Public School Resources and Private Substitutes in Urban China. http://igov.berkeley.edu/content/public-school-resources-and-private-substitutes-urban-china Accessed 20.08.2013.