RECOGNITION OF VESSEL ACOUSTIC SIGNATURES USING NON-LINEAR TEAGER ENERGY BASED FEATURES
G¨okmen Can, Cem Emre Akbas¸, A. Enis C¸ etin Department of Electrical and Electronic Engineering
Bilkent University, 06800 Bilkent, Ankara, Turkey
[email protected], [email protected], [email protected]
ABSTRACT
This paper proposes a vessel recognition and classification sys-tem based on vessel acoustic signatures. Teager Energy Operator (TEO) based Mel Frequency Cepstral Coefficients (MFCC) are used for the first time in Underwater Acoustic Signal Recognition (UASR) to identify platforms the acoustic noise they generate. TEO based MFCC (TEO-MFCC), being more robust in noisy conditions than conventional MFCC, provides a better estimation platform energy. Conventionally, acoustic noise is recognized by sonar oper-ators who listen to audio signals received by ship sonars. The aim of this work is to replace this conventional human-based recognition system with a TEO-MFCC features-based classification system. TEO is applied to short-time Fourier transform (STFT) of acoustic signal frames and Mel-scale filterbank is used to obtain Mel Teager-energy spectrum. The feature vector is constructed by discrete cosine transform (DCT) of logarithmic Mel Teager-energy spec-trum. Obtained spectrum is transformed into cepstral coefficients that are labeled as TEO-MFCC. This analysis and implementation are carried out with datasets of 24 different noise recordings that belong to 10 separate classes of vessels. These datasets are par-tially provided by National Park Service (NPS). Artificial Neural Networks (ANN) are used as a classification method. Experimental results demonstrate that TEO-MFCC achieves 99.5% accuracy in classification of vessel noises.
Index Terms— MFCC, Teager energy, Vessel Recognition.
1. INTRODUCTION
Detection, classification and tracking of vessels are very significant for war strategies and improving coast and off-shore security. Pas-sive underwater acoustic sensors are used to detect vessels noise and gather data. Vessel noise is an acoustic signature and it can be used for vessel detection and classification.
Underwater acoustic signal detection methods are based on sounds produced by moving vessels. Passive acoustic methods have been used in submarines for years, and these works were published after World War II. The main sources of vessel noise are propellers and engine mechanisms (blades, rotation and propeller radiated pres-sure). There is also environmental noise such as the noise generated by waves, wind, rainfall, etc. [1].
Every person has a unique voice and the characteristic of this voice is used for speaker identification in speech recognition. As mentioned previously, every ship also has a different noise source
978-1-5090-5524-1/16/$31.00 c 2016 IEEE
combination (number of blades, rotational speed and propeller radi-ated pressure etc.).This combination creates a unique noise for every vessel. This uniqueness can be considered as an “acoustic signature” for vessels. As a result, automatic speaker recognition (ASR) and classification algorithms in speech recognition can be used for Un-derwater Acoustic Signal Recognition (UASR) to identify platforms using their acoustic signatures.
Conventionally, classification of vessel signatures is carried out by an experienced submarine sonar operator who listens to the acoustic noise coming from the ship sonars. It is evident that it would be more feasible to develop a computer based vessel signa-ture recognition system using ASR methods. MFCC algorithm is widely used in speech recognition systems and it produces good results on speech recognition and identification. This work offers a technique that extracts feature vectors using MFCC frame by frame for classification of acoustic vessel signatures. Our work suggests that MFCC can easily be adapted to classification of vessel noise at high classification accuracies [2].
This work offers a modified version of MFCC that utilizes TEO for classification of vessel signatures. Applying non-linear Teager-energy operator can suppress environmental noise and increase the classification performance [3, 4]. TEO is used in various speech recognition applications and it is a good candidate for proposed fea-ture parameters in vessel acoustic signafea-tures. The proposed feafea-tures are evaluated to show that TEO-MFCC is more robust than MFCC and it produces higher classification success rate. Neural Network (NN) classifier is used for feature matching.
This paper is organized as follows: In section 2, the conventional MFCC and TEO are presented. In section 3, TEO based MFCC for acoustic vessel noise recognition algorithm is proposed. In section 4, the performance of the proposed features is evaluated. Conclusion is presented in section 5.
2. THEORETICAL BACKGROUND 2.1. Mel Frequency Cepstral Coefficients (MFCC)
The first step of automatic speech recognition (ASR) is extracting features in order to identify the linguistic content of the signal and discard noise and other carried irrelevant information. Sound is gen-erated in humans by vocal cords and the shape of the vocal tract (tongue, teeth etc.) filters this sound. This shape or filtering deter-mines what sound comes out. If shape is determined accurately, an accurate representation of the produced phoneme can be obtained. This shape appears in the envelope of the power spectrum of the gen-erated sound. Since the shape of the vocal tract can be represented by MFCC accurately, this method is widely used in ASR [3].
The block diagram of the MFCC algorithm is given in Figure 1. Each block is explained in the following subsections.
Fig. 1. Block Diagram of MFCC
2.1.1. Pre-emphasis Block:
This step is the filtering of the vessel acoustic noise by the filter de-fined in Eq.1. This filter boosts higher frequencies so that the energy of the signal increases at higher frequencies after filtering [4]. The noise signal has smaller amplitudes at high frequency components with respect to low frequencies. After this block, high frequency components of the signal become more significant and more infor-mation about the acoustic model is obtained [5].
y[n] = x[n] − 0.95x[n − 1] (1) 2.1.2. Framing Block:
The importance of this block is that much shorter frames have unreli-able spectral estimate and longer frames change too much. Although speech signal is non-stationary, short time scales will be stationary. The reason for this is that the width of the frames is chosen as 30ms with 20ms overlap. In this case frames are 10ms shifted.
2.1.3. Windowing Block:
Windowing function smooths the attenuation at both ends of the sig-nal. Ends reduce toward zero and unwanted artifacts can be avoided. In our work, Hamming window is used for this purpose since its spectrum falls off rather quickly and the resulting frequency resolu-tion is better [6].
w[n] = (
0.54 − 0.46cos(N −12πn) 0 ≤ n ≤ N − 1
0, otherwise (2)
2.1.4. Mel-Filter Bank Block:
Sensitivity of human hearing system is not the same in all frequency bands. Mel (melody) is a unit of measure based on human ear’s per-ceived frequency. Human ears are less sensitive at higher frequen-cies, and more sensitive to small changes in low frequencies than high frequencies. This scaling makes our features closer to what humans hear. 1 kHz is defined as 1000 Mels as reference [7].
Converting formula from linear-scale to Mel-scale in frequency domain:
M el(f ) = 1125 × ln(1 + f
700) (3)
Below 1 kHz, Mel-Scaling is similar to linear frequency spacing. Above 1 kHz, it is similar to logarithmic spacing. Triangular filters are uniformly spaced in the Mel-Scale [8].
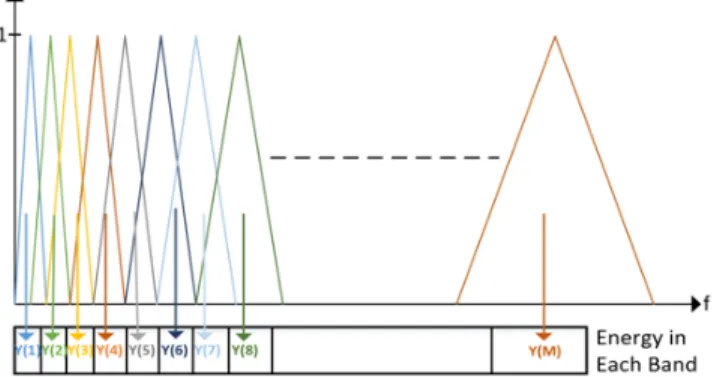
Fig. 2. Triangular Mel-Scale filter bank
After calculating Mel-Scale filter bank in frequency domain, ap-ply them to the spectrum of the signal. The figure below summarizes this part:
Fig. 3. Mel-Filter Bank Processing
Last step of the Mel-Filter bank block is to calculate the energies of the filter bank. Multiplying each filter bank with the magnitude spectrum of the signal and then adding up the coefficients yields how much energy there is in each filter bank. In previous figures, “Y” is the energy of the filter bank and “M” is the indicator of which filter bank it is.
2.1.5. Logarithm Block:
The human perception of sound intensity approximates the logarith-mic scale rather than linear. This means that, humans are less sensi-tive to small changes at high amplitudes than low amplitudes. 2.1.6. Discrete Cosine Transform Block (DCT):
This block converts logarithmic Mel-spectrum into time domain and the result is labeled as MFCC. Logarithmic magnitude spectrum is real and symmetric, so inverse DFT reduces to DCT.
y[k] = M X m=1 log(|Y (m)|)cos(k(m − 0.5)π M) k = 0, 1, ...M − 1 (4)
2.2. Teager Energy Operator (TEO)
TEO is an energy operator and it can eliminate the effect of noise in feature extraction. It provides a good estimation of the “real” source of energy and ensures that the system will be more robust in noisy environments. For clean conditions, the system performs similarly [9].
Teager Energy Operator is defined for real continuous-time sig-nals in the following equation:
Ψ(x(t)) = ˙x(t)2− x(t)¨x(t) (5) and for real discrete-time signals can be written as follows:
Ψ(x[n]) = x[n]2− x[n − 1]x[n + 1] (6) For the case of complex continuous-time signals, the equation is given as:
Φ(x(t)) = Ψ(Real{x(t)}) + Ψ(Im{x(t)}) (7) and for discrete time:
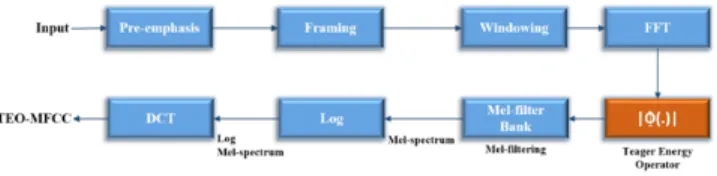
Φ(x[n]) = Ψ(Real{x[n]}) + Ψ(Im{x[n]}) (8) 3. PROPOSED TEO-MFCC FEATURE PARAMETERS Applying non-linear Teager-energy operator (TEO-MFCC) requires the following process:
Fig. 4. Block Diagram of TEO-MFCC
Blue blocks in TEO-MFCC flow diagram is the same with MFCC computation. TEO (red block) is applied to the output of the FFT block for each frame in frequency domain. The TEO of X[k], Φ(X[k]) is calculated and the magnitude ofΦ(X[k]) is then weighted by Mel-filter bank processing explained in Figure-3. Cal-culation of the energy of each filter bank and other following steps are the same as MFCC computation. Output of the block diagram in figure-4 is labeled as TEO-MFCC [10].
4. EXPERIMENTS AND RESULTS 4.1. Experimental Setup
The data sets containing the records of 19 acoustic signatures from 6 types of vessels are used in the experiments. The acoustic signa-tures are recorded by an acoustic sensor submerged underwater from a stationary vessel while another vessel moves and produce noise (its acoustic signature). The moving vessel approaches and moves away from the stationary sensor at different velocities and records are taken at varying distances. The distance between the moving and stationary vessels is measured both by GPS and laser range-finder and this distance is synchronized with the acoustic recordings.
Fig. 5. Map of experiment and position of vessels
On the stationary vessel, Reson TC4032 hydrophone is used as the acoustic sensor. Data acquisition is performed at 100 kHz or 200 kHz sampling rate. Records are decimated by a factor of 5 or 10 to provide 20 kHz sampling rate. As shown in Figure 6, acoustic noise of a cruise ship decreases significantly after 9 kHz, hence 20 kHz is a sufficient sampling rate for this application. Records are also divided into smaller frames in order to be treated as a short record of the underwater acoustic signatures.
Fig. 6. Power Spectral Density of Acoustic Noise of a Cruise Ship
In addition, records in NPS dataset are used in the experiments in order to get more realistic experimental results [11]. However, distance between sensor and vessel and velocity are generally un-known in this dataset. Different classes of vessels are chosen (ferry, freighter, cruise ship, and outboard) with respect to previous vessels to increase database.
4.2. Results
The data set contains 24 noise records coming from 10 different types of vessels and duration of each record frame in the database is 3 seconds long. Our proposed method is tested with various ve-locities of vessels between 5 knots and 26 knots. Table-1 shows acoustic noise of platforms and their velocities.
Following parameters are used to extract the feature vectors of our MFCC and TEO-MFCC methods: Frame size is 25ms with an overlap of 10 ms, pre-emphasis coefficient is 0.97, number of filter-bank and Cepstral Coefficients varies between 10 and 22 to analyze the effect of these parameters and the lower and upper frequencies of the filter-bank are 40 Hz and 4 kHz.
Table 1. Vessel Database and Description Type of Vessel Description Velocity (knot) #of Round Trip Total # of frame Type-A Tug-Vessel 5, 7.5, 10 2 1788 Type-B Tug-Vessel 5, 10 2 1192 Type-C Tug-Vessel 6, 8, 8.5 1 894 Type-D Military Vessel 5, 13 1 596 Type-E Military Vessel 20, 26 1 596 Type-F Military Vessel 20, 26 1 596 Type-G Outboard 60hp 10, 20 1 596 Type-H Freighter - 1 298 Type-I Cruise Ship - 1 298 Type-J State-Ferry - 1 298
A vessel at various velocities is the same target, so we need to show that MFCC values and distribution are similar regardless of the speed of the vessel. However, different types of vessels at the same velocity are different targets, so MFCC values and distribution should be different. This is a significant point because MFCC val-ues are feature vectors and inputs for classification. Figures 7, 8 and 9 show MFCC distribution and filter-bank energies, when Cepstral Coefficients (C) and number of filter-bank (M) are equal to 20. Al-though type-B 5 knots and 10 knots are similar, type-B and type-A 5 knots have different distributions.
Fig. 7. Type-A 5knot filterbank energy and MFCC
Classification of feature vectors problem is solved by Neural Pattern Recognition Application in Matlab Neural Network toolbox [12]. Application classifies features into a set of target categories using a two layer feed-forward network. Network structure has one hidden layer and one output layer. The length of input is equal to the length of the feature vector, the number of output layer neurons is equal to the number of classes and the number of hidden layer
Fig. 8. Type-B 5knot filterbank energy and MFCC
Fig. 9. Type-B 10knot filterbank energy and MFCC
neurons is chosen as 10. Changing the number of hidden layer neu-rons does not change the overall classification accuracy. Thus, the number of hidden layer neurons is not a significant parameter in this application. These layers are trained to classify test data according to target classes. This application is supervised learning, so it updates the weights according to the scaled conjugate gradient backpropaga-tion method. Randomly chosen; 70% samples of input data is used for training, 15% is used for validation and 15% is used for testing.
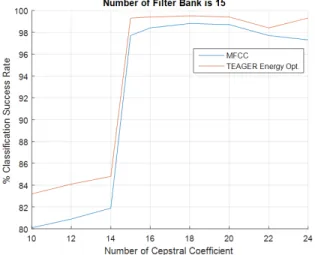
Robustness and performance of the MFCC and TEO-MFCC fea-ture parameters are compared with various parameters. It is shown that; when the numbers of MFCC and TEO-MFCC are equal or greater than the number of the filter bank, classification success rate increases rapidly and it is stable after that point with a high suc-cess rate. This information should be considered when choosing the number of cepstral coefficients.
ef-fective when the number of filter-banks increases. Success rates are given in the following figures with various parameters. The maxi-mum recognition accuracy is 99.5% with the implementation of Tea-ger energy operator.
Fig. 10. Performance of methods according to # of filterbank
Fig. 11. Performance of methods according to # of Cepstral Coeffi-cients
5. CONCLUSIONS
In this paper, a vessel acoustic signature classification algorithm is proposed. This algorithm uses TEO based MFCC features for classification. MFCC method is widely used in speech recogni-tion, and TEO increases the performance of classification. MFCC and TEO-MFCC are extracted as feature vectors and their per-formances are compared to the conventional MFCC. TEO-MFCC based proposed algorithm is a new method in UASR and it is shown that TEO-MFCC is more robust in noisy conditions than MFCC since non-linear Teager-energy operator suppresses noise. NN is
used for classification and experimental results show that the ves-sel recognition system achieves 99.5% classification accuracy with TEO-MFCC features.
The acoustic data of the vessels are recorded in clean conditions. Our major future work is to collect acoustic data of more than one vessel at the same time using hydrophone arrays instead of a single hydrophone and classify different types of vessels at the same time using this beam-formed data. Performance of our proposed methods are tested in these conditions.
As minor future work, different learning techniques and plat-forms will be used to increase recognition accuracy and develop our proposed method.
References
[1] K. W. Chung, A. Sutin, A. Sedunov, and M. Bruno, “Demon acoustic ship signature measurements in an urban harbor,” Ad-vances in Acoustics and Vibration, vol. 2011, 2011.
[2] T. Lim, K. Bae, C. Hwang, and H. Lee, “Classification of un-derwater transient signals using mfcc feature vector,” in Signal Processing and Its Applications, 2007. ISSPA 2007. 9th Inter-national Symposium on. IEEE, 2007, pp. 1–4.
[3] “Mel frequency cepstral coefficients (mfcc) tutorial,” http://practicalcryptography.com/miscellaneous/machine-learning/guide-mel-frequency-cepstral-coefficients-mfccs/, Accessed: 2016-06-04.
[4] R. Vergin, D. O’Shaughnessy, and V. Gupta, “Compensated mel frequency cepstrum coefficients,” in Acoustics, Speech, and Signal Processing, 1996. ICASSP-96. Conference Pro-ceedings., 1996 IEEE International Conference on, May 1996, vol. 1, pp. 323–326 vol. 1.
[5] F. Karabiber, “Feature extraction-mel frequency cepstral coef-ficients,” Yıldız Technical University Department of Computer Engineering Lecture Notes, Accessed: 2016-05-29.
[6] V. Divyateja, P. A. Kumari, and D. K. Sethi, “Performance evaluation of feature extraction algorithms used for speaker de-tection,” European Journal of Advances in Engineering and Technology, vol. 3, no. 1, pp. 34–39, 2016.
[7] A. Das, M. R. Jena, and K. K. Barik, “Mel-frequency cepstral coefficient (mfcc) - a novel method for speaker recognition,” Digital Technologies, vol. 1, no. 1, pp. 1–3, 2014.
[8] K. S. Rao and S. G. Koolagudi, Robust Emotion Recogni-tion using Spectral and Prosodic Features, Springer Science & Business Media, 2013.
[9] D. Dimitriadis, P. Maragos, and A. Potamianos, “Auditory teager energy cepstrum coefficients for robust speech recog-nition.,” in INTERSPEECH, 2005, pp. 3013–3016.
[10] A. Georgogiannis and V. Digalakis, “Speech emotion recog-nition using non-linear teager energy based features in noisy environments,” in Signal Processing Conference (EUSIPCO), 2012 Proceedings of the 20th European. IEEE, 2012, pp. 2045–2049.
[11] “National park service underwater sounds dataset,” https://www.nps.gov/glba/learn/nature/soundclips.htm, Ac-cessed: 2016-06-04.
[12] H. Demuth, M. Beale, and M. Hagan, “Neural network toolboxTM6,” User’s guide, 2008.