LEISURE & TOURISM | RESEARCH ARTICLE
Determination of tourism activities of the world’s
best tourism destinations using the multi-criteria
decision-making method
Mehmet Oğuzhan Ilban1* and Hasan Hüseyin Yıldırım1
Abstract: In this study, the tourism performance of the 15 countries that are the
most popular global tourist destinations are analyzed using the TOPSIS method.
Four factors are employed to measure the tourism activities in these countries:
in-ternational tourism expenditures, inin-ternational tourism receipts, number of
interna-tional tourism arrivals and number of internainterna-tional tourism departures. The TOPSIS
method is applied to combine the four factors and convert them into a single
perfor-mance score. The countries are then ranked and rated. Tourism activities are used
to grade the countries’ performance scores. In this way, the valuation of tourism
activities in the 15 countries is determined for the 6 years between 2009 and 2014.
The results are compared with the results of international tourism organizations.
Subjects: Social Sciences; Tourism, Hospitality and Events; Economics, Finance, Business & IndustryKeywords: tourism industry; tourism activities; TOPSIS method 1. Introduction
International tourism, which is the third largest economic sector (surpassed only by the petrochemi-cal and automotive sectors), has grown rapidly over the past half century. Currently, tourism ac-counts for 9.5% of the global economy and 4.4% of all investment globally. Furthermore, 5.4% of world exports are based on tourism, which indicates the importance of tourism to the global econo-my (World Travel & Tourism Council, 2014). According to a study conducted by the World Tourism Organization (UNWTO), by 2020, 1.4 billion people will be involved in international tourism, and by *Corresponding author: Mehmet
Oğuzhan Ilban, The School of Applied Sciences, The University of Balikesir, Burhaniye, Balikesir, Turkey E-mails: [email protected], ilban@ balikesir.edu.tr
Reviewing editor:
John Martyn Chamberlain, Swansea University, UK
Additional information is available at the end of the article
ABOUT THE AUTHOR
Mehmet Oğuzhan Ilban received his Master’s Degree (2002) in Tourism Management and he obtained a PhD Degree (2007) from the University of Balikesir in Turkey. Currently, Mr Mehmet Oguzhan Ilban is an associate professor in the High School of Applied Sciences at the University of Balikesir. Mr Ilban has extensive experience in the tourism and hotel industry. His main research interests include tourism education, tourism marketing and hotel management.
PUBLIC INTEREST STATEMENT
Today’s tourism sector has high competition like other sectors. Incomes from the tourism sector contributes to the economic size of the countries with tourism potential. Countries are graded to describe the situation of World tourism in some reports and outlook. As a result of this rating and ranking, the countries are ranked from the best to the worst as according to the tourism activity status. In this study, the countries are ranked according to the status of tourism activity using the TOPSIS method of multi criteria decision making methods. With the results of such alternative models being used, a more sound evaluation can be made by comparing the annual results of the institutions that are rating the tourism activities of the countries on annual basis and in reports.
Received: 01 July 2016 Accepted: 27 February 2017 Published: 14 March 2017
Mehmet Oğuzhan Ilban
© 2017 The Author(s). This open access article is distributed under a Creative Commons Attribution (CC-BY) 4.0 license.
2030, this figure is expected to reach 1.8 billion people (WTTC, 2014). Figures from the UNWTO show that tourist arrivals reached 1.087 billion people in 2013, up from 25 million people in 1950. The amount of trade from tourism in the international arena is $1.159 trillion.
Between 1980 and 1995, the increase in the number of tourists throughout the world was 4.4%, and between 1995 and 2010, the increase was 3.9% despite numerous wars, terrorist activities and global crises that affected every almost location in the world. Tourism was among the few sectors that were not seriously affected by these factors. In 2013, the number of tourists travelling to other countries reached 1.087 billion people.
The global tourism market has undergone a significant quality change in recent years. Tourism activities have been diversified, tourism expenditures (per person) have increased rapidly compared to the past, new regions have been opened to international tourism, and traditional regions have made a great effort to innovate and be competitive. Many countries have attempted to improve their accessible tourism products and recreational activities to meet the ever-changing demand for tourism.
The dispersion of tourism activities throughout the world indicates that Europe and North America account for the largest share of global tourism activities. The largest suppliers in the global tourism and travel sectors are the European Union (EU) countries. Tourism activities toward developing countries have increased rapidly as an effect of the globalization process. Through globalization, the minimizing of border formalities between countries, greater democratic policies in transportation facilities, quality and prices, the harmonization of information and communication technologies to all service sectors including tourism, and publicity and advertising, potential tourists have been in-formed of the supply sources of many new destinations throughout the world. Developing countries have increased their share of the tourism market in recent years. The 15 countries in this study ac-count for approximately 70% of total global tourism activities. However, the ranking for these 15 countries (WTO, etc.) is a ranking that is revealed by taking the basic input variables in tourism sepa-rately. We can say that the tourism performances of the countries are very important both for the investors and for the potential tourists. In this respect, it will be more realistic and useful to deter-mine more than one variable at the same time in order to create these rankings which will affect competition, investments and tourists’ preferences.
This study for this proposes the TOPSIS approaches together for evaluating the ranking and rating of best of world 15 tourism destinations. Criteria can be quantitative, such as number of interna-tional inbound and outbound tourists, internainterna-tional tourism receipts and expanditures. Therefore, this study aims to determine whether (1) these four criteria affect the tourism destination’s perfor-mance and (2) these four criteria affect the ranking destinations. The result of evaluation may help strategy makers of tourism sector, goverments, investors and entrepreneus, management of tour agencies, international tourists/traveler and academicians in tourism industries etc.
2. Assessment criteria for tourism activities
There are three key drivers of the tourism sector: international tourism expenditures, international tourism receipts and the number of international tourist arrivals in countries (Zaman, Shahbaz, Loganathan, & Raza, 2016, p. 276). However, international outbound tourists are the most important factor to enhance a country’s competitive advantage (Hong, 2009, p. 125). The definitions of these assessment values are provided below (data.worldbank.org: The World Bank, 2016):
International tourism expenditures are expenditures by international outbound visitors in other
countries, including payments to foreign carriers for international transport. These expenditures may include those by residents traveling abroad as same-day visitors, except in cases where these are important enough to justify separate classification.
International tourism receipts are expenditures by international inbound visitors, including
pay-ments to national carriers for international transport. These receipts include any other prepayment for goods or services received in the destination country. They may also include receipts from same-day visitors, except when these are important enough to justify separate classification.
International inbound tourists (overnight visitors) are tourists who travel to a country other than
the country of their usual residence outside their usual environment for a period not exceeding 12 months and whose main purpose in visiting is an activity other than one remunerated from with-in the country visited.
International outbound tourists includes the departures that people make from their country of
residence to any other country for any purpose other than a remunerated activity in the country visited.
Each of these assessment criteria is of great significance (Hong, 2009; Lim, 1997; Zaman et al., 2016). International tourism receipts seem to be the only criterion for assessing tourism incomes to the economy of a country, but this is not the case. The number of inbound tourists to a country, for example, is also very important in the advertising of that country and can attract more tourists in the future. Tourism is a good example of a sector in which tourists share their opinions both offline and online. Interpersonal influence is important because of its intangible nature and the fact that it can-not be evaluated before purchasing (Litvin, Goldsmith, & Pan, 2008; Phillips, Wolfe, Hodur, & Leistritz, 2013). Expenditures as a result of tourism activities are not only relevant to countries’ development levels but also provide important clues about the frequency of the participation of the citizens of a country in tourism activities (Latham & Edwards, 2003, p. 61). However, these expenditures are also very important assessment criteria for improving concepts such as customer satisfaction and quality service, which are used as data in this study. Thus, all of these factors are significant criteria for countries’ tourism performance (Dwyer & Forsyth, 2007, pp. 46–54). This study considers these crite-ria equally in the assessment of tourism activities. The tourism performance of 15 countries that have attractive destinations on a global scale are assessed accordingly.
3. Literature review
Charnes, Cooper, and Rhodes (1978) focused on the importance of using different calculation tech-niques for the financial assessment of companies. Deng, Yeh, and Willis (2000) determined that the technique for order preference by similarity to an ideal solution (TOPSIS) method is a simple and ef-ficient way to measure and evaluate the internal performance of companies by using financial rates. The financial rates used in China in the assessment of companies provide meaningful and helpful data about countries and play an important role in the decision-making process. In their study, which aimed to examine the performance of airline companies, Feng and Wang (2000) em-ployed the TOPSIS method by using 22 variables as transportation and financial indicators for five Taiwanese airline companies and concluded that these indicators are effective in the assessment of these companies.
In their study of the selection of the best offer in bids made in a manufacturing company, Hao and Qing-sheng (2006) used the TOPSIS method to determine the best tender offer from 4 competing companies for certain electronic devices and considered 12 indicators. Shih, Shyur, and Lee (2007) also used the TOPSIS method in the personnel selection process for the human resources depart-ment of a local chemistry company and demonstrated that the method is a strong one.
Luo, Wang, Wu, and Wu (2008) conducted a study of coordination between urban tourism and urban development in Hangzhou by applying the TOPSIS method. Based on an in-depth analysis of the present literature on urban tourism, the paper introduced a coordinative evaluation index sys-tem of urban tourism and urban development, calculated the coordinative index in Hangzhou and determined the rank of the coordinative state. The study results indicated that the coordinative in-dex between urban tourism and urban development increases with each passing year. As time
passes, the coordinative index value gradually approaches an optimum, which was 0.8631 in 2005. With the maturity of urbanization and tourism development, the coordinative state gradually be-comes optimized. The coordinative state in Hangzhou shifted from relative non-coordination in 2001 to high coordination in 2005.
Eleren and Karagül (2008) evaluated the performance of the Turkish economy, which benefitted from 7 basic indicators between the years 1986 and 2006. Using a single performance point for each year with the TOPSIS method, they found that 1986 was the year with the best economic perfor-mance and that 1999 was the worst.
Karimi, Yusop, and Hook (2010) examined the location decision for foreign direct investment in ASEAN countries using the TOPSIS approach, which provides a relatively simple tool for this strategic decision-making problem. By using the TOPSIS method, the capacity and attraction of ASEAN coun-tries is evaluated and given a final rank for the 2000–2005 period. Within the model, ten indicators are defined as determinants of FDI inflows. Their empirical results indicate that Singapore is the most attractive for investment among ASEAN countries, although the ranking of some countries changed during those years.
Demireli (2010) attempted to determine the performance of the state-owned banks in Turkey by using the TOPSIS method. He discovered that the banks that had a nationwide operation network were influenced by the regional and global crises between 2001 and 2007. Their performance points fluctuated continually based on international data, and the banking sector could not record any striking improvement in the given period.
Yükçü and Atağan (2010) attempted to measure which company showed the best performance by using the TOPSIS method with the performance indicators of three companies in the sector and under the same holding. They ordered these three companies in terms of holding after analyzing the companies’ performance. They concluded that the TOPSIS method allows the decision-maker to make a more objective evaluation because the method combines different evaluation options into a single criterion.
Zhang and Zhang (2010) studied the regional competitiveness of the tourism resources of 16 cities in the Yangtze River Delta. Their analysis indicates that there are significant differences among the 16 cities in terms of tourism resource competitiveness. Suzhou and Hangzhou are the most competi-tive, whereas Taizhou and Nantong are the least competitive. Their conclusion suggests that the weighted TOPSIS method can be applied to a comparative analysis of the regional competitiveness of tourism resources and can both reduce the subjective influence and improve the reliability of the evaluation results.
Mangir and Erdogan (2011) aimed to analyze the determinants of the worldwide financial crisis and recession. In particular, they used the TOPSIS method to focus on the following countries where the effects of the global financial crisis were severe: Italy, Greece, Spanish, Portugal, Ireland and Turkey. The evaluation criteria and sub-criteria used to evaluate the macroeconomic performance were defined as follows: Economic Growth (EG), Inflation rate (IR), Unemployment rate (UR), Current Account Balance (CAB), and Budget Balance rate (BB). They found that all of the countries were af-fected by the crisis in 2008 but that Turkey was the country that felt the least impact.
Shamai and Mosivand (2011) studied the factors that attract tourists to a destination and deter-mined the hierarchy of towns in Isfahan (Iran) based on these factors. The factors assessed for each town included hotels, motels, suburban units, restaurants, tour and travel agencies, travel service offices, transportation companies, art galleries and cultural exhibitions, public parks, number of pub-lic transport systems, special tourism areas, and capitalization opportunities. The TOPSIS model was used to create a hierarchy of tourism substructures, and the AHP approach was used for the final
ranking. Isfahan ranked first, with Kashan and ShahinShahr in second and third place, respectively. The authors also presented suggestions for tourism development.
Mohamad and Jamil (2012) evaluated the critical factors that influence local tourists’ choice of destinations in Kedah and determined tourists’ preference for the destinations with respect to these factors using the Fuzzy Hierarchical TOPSIS (FHTOPSIS) method. This study focused on the internal factors that motivate tourists to choose their destination. Their results show that visiting friends and relatives is the most important factor that motivates visits to Kedah, whereas novelty seeking is the least motivating factor that influences the choice of destination. The best destination among the five destinations under consideration in their study was Langkawi, followed by AlorSetar, Sedim River, Bujang Valley and Bukit KayuHitam. This study can help relevant authorities and travel agen-cies plan and promote attractions in Kedah by using effective marketing strategies and can help tourists decide which main attractions in Kedah to visit.
Huang and Peng (2012) analyzed the Tourism Destination Competitiveness (TDC) of nine Asian countries: China, Hong Kong, Japan, Korea, Malaysia, Singapore, Taiwan, Thailand and the Philippines. The study was conducted in 2009 and used 6 criteria and 15 indices. The results in 2009 indicated that the Asian countries ranked from most to least competitive as follows: China, Japan, Hong Kong, Malaysia, Thailand, Singapore, Taiwan, Korea and the Philippines.
Supçiler and Çapraz (2011) focused on the problem of supplier selection in their study. They se-lected the most appropriate supplier by using both the TOPSIS method and the multi-criteria deci-sion-making method. They selected the best supplier with the highest score among the present suppliers, which was the one that would provide the maximum benefit to the company. The main criteria they used in the selection of the supplier were quality, cost, delivery and service.
Uygurtürk and Korkmaz (2012) analyzed the financial performance of the 13 main metal industry companies in Borsa, Istanbul, using the financial tables of the companies from 2006 to 2010 with the TOPSIS method. They converted the general company performance of the companies into a single point by means of the TOPSIS method and used this point to rank the companies from best to worst. They found that the performance points of the companies in the metal sector generally changed during the analysis periods.
Önder, Yıldırım, and Özdemir (2013) studied the competitiveness of the Turkey tourism destina-tions by using the Analytical Hierarchy Process (AHP) and TOPSIS method. The study was conducted two main criteria with qualitative and quantitative and used 31 attributes and 13 region. The results indicated that the Turkey tourist regions ranked from most to least competitive as follows: Alanya, Bodtum, Çeşme, Didim, Fethiye etc.
Urfalıoğlu and Genç (2013) used the TOPSIS method to determine the economic situation of Turkey in the EU process. The decision criteria in the study were gross national product per capita, the rate of growth, export, import, employment and inflation, which were applied to the 27 full member countries and 5 candidate countries of the EU (Turkey, Macedonia, Iceland, Croatia and Montenegro). They compared the results obtained using the TOPSIS method with those obtained using other making methods and noted very close findings to other multi-criteria decision-making methods.
4. Research method
A general overview of all tourism activities shows that there are 15 important destinations in the world. These destinations account for 70% of global tourism activities. Four main factors are in-cluded in the analysis from 2009 to 2014 to visualize the comparative performance of the 15 impor-tant destinations. Information for these 6 years about tourism expenditures, tourism receipts, inbound tourists and outbound tourists is taken from the annual UNWTO, Tourism Highlights and
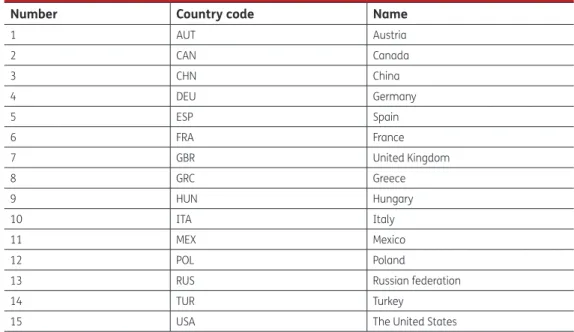
World Bank Tourism Data. The information and codes of the 15 countries used as important destina-tions for the analysis are presented in Table 1.
The analysis of the study consists of two steps. In the first step, four pieces of tourism data are determined to define the tourism performance of the destinations. Then, data for the period from 2009 to 2014 are compiled for each of the 15 countries. In the second step, the TOPSIS method converts the general tourism performance of the countries into a single point. Finally, the destina-tion rating is completed, and the countries are ordered according to their points from largest to smallest. Table 2 shows a list of the codes of the tourism activities used in the study.
In general, only the top 10 countries are given for each criterion in the ratings. The study was ap-plied to the years from 2009 to 2014, and the top 10 countries differed in each of the six years. For this reason, considering the change in countries, the four assessment criteria are employed for the 15 countries with regard to the results for the mentioned years.
This study uses the TOPSIS method, one of the most common decision-making methods, to ana-lyze the performance of the 15 most popular countries in the world and to rate their tourism activi-ties. These counties account for 70% of all tourism activiactivi-ties.
5. TOPSIS method
The decision problem involves the process of determining the best option among the most appropri-ate options. There are a wide variety of methods, such as TOPSIS, ELECTRA, AHP, Fuzzy AHP, and Fuzzy TOPSIS, to make decisions in the face of multivariate decision-making problems. In recent years, a multi-purpose, commonly used method, the TOPSIS method, which is based on multiple criteria evaluation and decision makers, has been used successfully.
Table 1. The countries included in the study
Number Country code Name
1 AUT Austria 2 CAN Canada 3 CHN China 4 DEU Germany 5 ESP Spain 6 FRA France 7 GBR United Kingdom 8 GRC Greece 9 HUN Hungary 10 ITA Italy 11 MEX Mexico 12 POL Poland
13 RUS Russian federation
14 TUR Turkey
15 USA The United States
Table 2. Tourism activities and codes
No KOD Rates
1 EXP International tourism expenditures ($)
2 REC International tourism receipts ($)
3 ARR International tourism, number of arrivals 4 DEP International tourism, number of departures
The TOPSIS method was presented by Chen and Hwang (1992), with reference to Hwang and Yoon (1981). TOPSIS is a multiple criteria method for identifying solutions from a finite set of alternatives. The basic principle is that the chosen alternative should have the shortest distance from the positive ideal solution and the farthest distance from the negative ideal solution. The TOPSIS procedure can be expressed in a series of steps.
Step 1: Creating a decision matrix (A)
Decisions related to the listed advantages of the line matrix occur with the desired decision points. The decision matrix is located in the columns of the assessment factors to be used in decision-making. The initial matrix is formed by decision makers. The decision matrix is shown as follows:
where “m” is the number of decision points in the Aij matrix and “n” represents the number of evalu-ation factors.
Step 2: Create a standard decision matrix (R).
Step 3: Calculate the weighted normalized decision matrix (V).
The weighted normalized value vij is calculated as follows:
where wj is the weight of the jth criterion or attribute and
n
∑
j=1
w
j= 1
.Step 4: Determine the ideal (A*) and negative ideal (A−) solutions.
Step 5: Calculate the separation measures using the m-dimensional Euclidean distance.
The separation measures of each alternative from the positive ideal solution and the negative ideal solution, respectively, are as follows:
A
ij=
⎡
⎢
⎢
⎢
⎢
⎣
a
11a
12…
a
1na
21a
22…
a
2n⋮
⋮
⋮
⋮
a
m1a
m2…
a
mn⎤
⎥
⎥
⎥
⎥
⎦
,
(1)r
ij=
x
ij√
√
√
√
∑
m i−1x
ij2i = 1, 2, … , m and j = 1, 2, … , n.
Matrix R is obtained as shown on R
ij=
⎡
⎢
⎢
⎢
⎢
⎣
r
11r
12…
r
1nr
21r
22…
r
2n⋮
⋮
⋮
⋮
r
m1r
m2…
r
mn⎤
⎥
⎥
⎥
⎥
⎦
.
v
ij=
r
ij×
w
ji = 1, 2, … , m and j = 1, 2, … , n,
v
ij=
⎡
⎢
⎢
⎢
⎢
⎣
w
1r
11w
2r
12…
w
nr
1nw
1r
21w
2r
22…
w
nr
2n⋮
⋮
⋮
⋮
w
1r
m1w
2r
m2…
w
nr
mn⎤
⎥
⎥
⎥
⎥
⎦
.
(2)A
∗= {(max
iv
ij|j ∈ C
b), (min
iv
ij|j ∈ C
c)} = {
v
∗ j|j = 1, 2, … , m}
(3)A
−= {(min
iv
ij|j ∈ C
b), (max
iv
ij|j ∈ C
c)} = {
v
− j|j = 1, 2, … , m}
(4)S
∗ i=
√
√
√
√
∑
m j=1(
v
ij−
v
∗ j)
2, j = 1, 2, … , m
Step 6: Calculate the relative closeness to the ideal solution.
The relative closeness of the alternative Ai with respect to A* is defined as follows:
Rank the preference order, and then find the values of the order of magnitude sequenced in order of importance that are determined by the decision point.
6. Results of the study
Fifteen countries with tourism destinations are analyzed in this study. The codes of these 15 coun-tries are AUT, CAN, CHN, DEU, ESP, FRA, GBR, GRC, HUN, ITA, MEX, POL, RUS, TUR and USA. To see the destination performance of these countries, the tourism activity criterion is used for the years from 2009 to 2014.
The study is composed of two steps. In the first step of the analysis, 4 pieces of tourism data are determined to define the tourism performance of the countries. Then, the data are calculated for each of the 15 countries for the years from 2009 to 2014 according to these criteria. In the second step, the four factors chosen to determine the performance of these attractive tourism destinations are used to calculate a single tourism performance score for each country by means of TOPSIS. The countries are ordered according to this score. After calculating the general score of each country individually for 2009–2014, the countries are rated for the study. The Excel program is used to apply the TOPSIS method.
The first step in the TOPSIS method is to make a Decision Matrix (A). The rows of the Decision Matrix contain decision points that can be used to rank the superiority of the countries, and the col-umns contain evaluation criteria that should be used for decision-making. Matrix A is the beginning matrix for the decision-maker. The matrix for 2009 is given as a sample. The other matrixes are not given here because they include the same application.
(5)
S
− i=
√
√
√
√
∑
m j=1(
v
ij−
v
− j)
2, j = 1, 2, … , m
(6)C
∗ i=
S
− iS
∗ i+
S
− i, i = 1, 2, … , m
Table 3. Decision-making matrix for 2009
Number Country code EXP ($) REC ($) ARR DEP
1 AUT 12.767.000.000 21.220.000.000 21.355.000 10.121.000 2 CAN 30.065.000.000 15.568.000.000 15.737.000 26.204.000 3 CHN 47.108.000.000 42.632.000.000 50.875.000 47.656.000 4 DEU 92.829.000.000 47.462.000.000 24.220.000 72.300.000 5 ESP 22.787.000.000 59.743.000.000 52.178.000 12.017.000 6 FRA 45.806.000.000 58.857.000.000 76.764.000 25.140.000 7 GBR 61.133.000.000 38.564.000.000 28.199.000 58.614.000 8 GRC 3.401.000.000 14.796.000.000 14.915.000 3.835.000 9 HUN 3.251.000.000 7.013.000.000 9.058.000 16.640.000 10 ITA 34.399.000.000 41.938.000.000 43.239.000 29.060.000 11 MEX 8.737.000.000 12.542.000.000 22.346.000 14.104.000 12 POL 7.888.000.000 9.843.000.000 11.890.000 39.270.000 13 RUS 23.785.000.000 12.369.000.000 21.339.000 34.276.000 14 TUR 5.061.000.000 26.331.000.000 30.187.000 5.561.000 15 USA 102.953.000.000 146.002.000.000 55.103.000 62.051.000
Step 1: Forming matrix A: There are 15 decision points (alternatives/destinations) and 4
assess-ment factors (criteria/tourism evaluation criteria) in the study. First, a standard decision-making matrix is created with the dimensions (15 × 4). Based on this matrix, the decision matrix of the 15 countries is presented in Table 3.
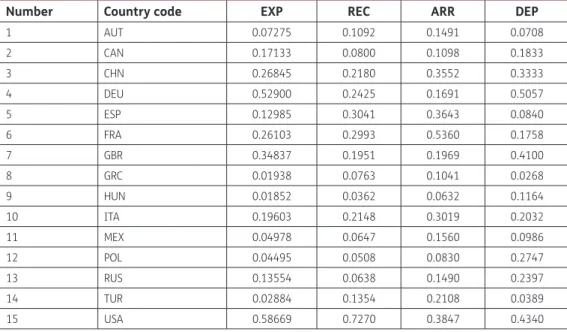
Step 2: Forming the standard decision matrix (R): The normalized decision matrix is calculated by
using the elements of Matrix A and Equation (1) (Table 4).
Step 3: forming weighted standard decision matrix (V): In this step, weight rates (Wi) are calcu-lated for the assessment factors. Then, the standard values are calcucalcu-lated by multiplying the nor-malized standard values, calculated above, by the (Wi) values to determine the weighted standard values. The assessment factors are weighted equally in decision-making for 2009. When all of the factors are valued 1 equally for dispersion, the weighted assessment value is 25% for each factor. To create the weighted standard decision matrix, the columns of Matrix V are calculated by multiplying the values in the columns of Matrix R by the weight values of the assessment factors (here, all are 25%). Table 5 presents the weighted standard decision matrix of the countries together with the solution sets ideal A*and ideal A−.
Step 4: Forming the analysis of ideal (A*) and negative ideal (A−): In this step, solution sets of
ideal A*and negative ideal A− are formed. For set A*, the largest value in each column of Matrix V and
the smallest for set A− in the same column are selected, and the sets are arranged according to the
appropriateness of the criteria to the goal:
According to the formula,
A
∗=
{
(max
iv
ij||
||
j ∈ J), (min
iv
ij||j ∈ J
�}
A
−=
{
(min
iv
ij||
||
j ∈ J), (max
iv
ij||j ∈ J
�}
.
A
∗=
{
0.1466; 0.1817; 0.1340; 0.1264
}
A
−=
{
0.0046; 0.0090; 0.0158; 0.0067
}
Table 4. Standard decision matrix for 2009
Number Country code EXP REC ARR DEP
1 AUT 0.07275 0.1092 0.1491 0.0708 2 CAN 0.17133 0.0800 0.1098 0.1833 3 CHN 0.26845 0.2180 0.3552 0.3333 4 DEU 0.52900 0.2425 0.1691 0.5057 5 ESP 0.12985 0.3041 0.3643 0.0840 6 FRA 0.26103 0.2993 0.5360 0.1758 7 GBR 0.34837 0.1951 0.1969 0.4100 8 GRC 0.01938 0.0763 0.1041 0.0268 9 HUN 0.01852 0.0362 0.0632 0.1164 10 ITA 0.19603 0.2148 0.3019 0.2032 11 MEX 0.04978 0.0647 0.1560 0.0986 12 POL 0.04495 0.0508 0.0830 0.2747 13 RUS 0.13554 0.0638 0.1490 0.2397 14 TUR 0.02884 0.1354 0.2108 0.0389 15 USA 0.58669 0.7270 0.3847 0.4340
Step 5: Calculation of the selection criteria: The spaces between alternatives are found by means
of the Euclidean distance with dimension n. The distance of each alternative from both the positive ideal solution (
S
∗i) and the negative ideal solution (
S
−
i) is calculated using Formulas (4) and (5).
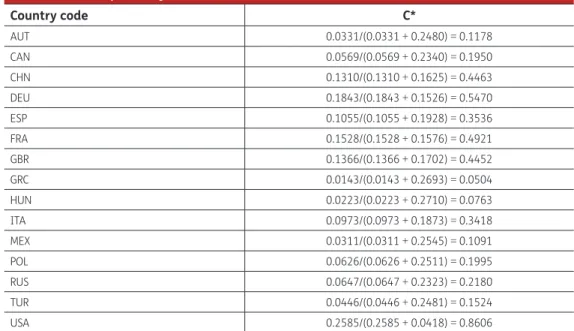
Step 6: Calculation of proximity according to ideal solution: In the calculation of relative
proxim-ity (
C
∗i) of the ideal solution to each decision point, the ideal and negative ideal distinction scores are
used. The calculation of the proximity value relative to the ideal solution is indicated in Formula (6).
C
∗i is normally valued between
0 ≤ C
∗
i
≤
1
for 2009. The equationC
∗
i
= 1
indicates proximity to theideal solution, and
C
∗i
= 0
indicates absolute proximity to the negative ideal solution. Table 6 showsthe calculation of the relative proximity of the countries to the ideal solution for the year 2009. In this step, the
C
∗i values are arranged according to how large they are, and an order of decision
points (alternatives) is made. The scores are arranged from largest to smallest to indicate which country is more attractive.
The order of scores for each destination is given in Table 7, which indicates that the country with code USA (United States of America) realized the best performance, whereas the country with code GRC (Greece) had the worst performance based on the four criteria chosen among the assessment factors from the destination performances for 2009. According to Table 7, the order of the destina-tions according to their 2009 performance is as follows: USA(1), DEU(2), FRA(3), CHN(4), GBR(5), ESP(6), ITA(7), RUS(8), POL(9), CAN(10), TUR(11), AUT(12), MEX(13), HUN(14), and GRC(15).
S
∗ i=
{
0.2480; 0.2340; 0.1625; 0.1526; 0.1928; 0.1576; 0.1702; 0.2693; 0.2710; 0.1873;
0.2545; 0.2511; 0.2323; 0.2481; 0.0418
}
S
− i=
{
0.0331; 0.0569; 0.1310; 0.1843; 0.1055; 0.1528; 0.1366; 0.0143; 0.0223; 0.0973;
0.0311; 0.0626; 0.0647; 0.0446; 0.2585
}
.
Table 5. Weighted standard decision matrix for 2009
Number Country code EXP REC ARR DEP
1 AUT 0.0181 0.0273 0.0372 0.0177 2 CAN 0.0428 0.0200 0.0274 0.0458 3 CHN 0.0671 0.0545 0.0888 0.0833 4 DEU 0.1322 0.0606 0.0422 0.1264 5 ESP 0.0324 0.0760 0.0910 0.0210 6 FRA 0.0652 0.0748 0.1340 0.0439 7 GBR 0.0870 0.0487 0.0492 0.1025 8 GRC 0.0048 0.0190 0.0260 0.0067 9 HUN 0.0046 0.0090 0.0158 0.0291 10 ITA 0.0490 0.0537 0.0754 0.0508 11 MEX 0.0124 0.0161 0.0390 0.0246 12 POL 0.0112 0.0127 0.0207 0.0686 13 RUS 0.0338 0.0159 0.0372 0.0599 14 TUR 0.0072 0.0338 0.0527 0.0097 15 USA 0.1466 0.1817 0.0961 0.1085 MAX (A*) 0.1466 0.1817 0.1340 0.1264 MİN (A−) 0.0046 0.0090 0.0158 0.0067
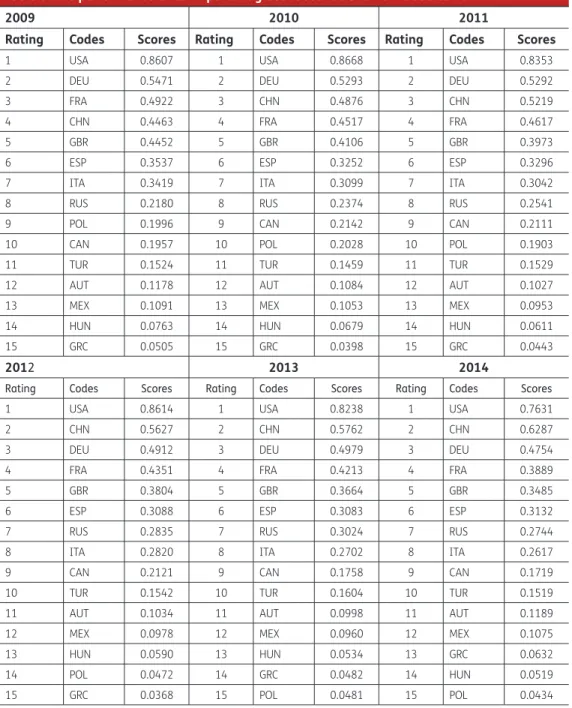
The analysis for 2009 is repeated for 2010, 2011, 2012, 2013, and 2014, and the findings are given in Table 8. Table 8 presents the results of the ratings of the 15 destinations for each year separately, calculating the tourism activity performance scores of each country from 2009 to 2014.
7. Conclusions
Fifteen important destinations are included in the analysis of this study. These are coded as AUT, CAN, CHN, DEU, ESP, FRA, GBR, GRC, HUN, ITA, MEX, POL, RUS, TUR and USA. The activity reports of these countries are used to analyze the performance of these countries. The study considers four tourism activities as criteria: international tourism expenditures, international tourism receipts, the number of inbound tourists and the number of outbound tourists.
Table 6. Relative proximity values to ideal solution in 2009
Country code C* AUT 0.0331/(0.0331 + 0.2480) = 0.1178 CAN 0.0569/(0.0569 + 0.2340) = 0.1950 CHN 0.1310/(0.1310 + 0.1625) = 0.4463 DEU 0.1843/(0.1843 + 0.1526) = 0.5470 ESP 0.1055/(0.1055 + 0.1928) = 0.3536 FRA 0.1528/(0.1528 + 0.1576) = 0.4921 GBR 0.1366/(0.1366 + 0.1702) = 0.4452 GRC 0.0143/(0.0143 + 0.2693) = 0.0504 HUN 0.0223/(0.0223 + 0.2710) = 0.0763 ITA 0.0973/(0.0973 + 0.1873) = 0.3418 MEX 0.0311/(0.0311 + 0.2545) = 0.1091 POL 0.0626/(0.0626 + 0.2511) = 0.1995 RUS 0.0647/(0.0647 + 0.2323) = 0.2180 TUR 0.0446/(0.0446 + 0.2481) = 0.1524 USA 0.2585/(0.2585 + 0.0418) = 0.8606
Table 7. Scores and order of destinations
2009
Order Country code Scores
1 USA 0.860671 2 DEU 0.547057 3 FRA 0.492196 4 CHN 0.446348 5 GBR 0.445202 6 ESP 0.353655 7 ITA 0.341890 8 RUS 0.218031 9 POL 0.199582 10 CAN 0.195728 11 TUR 0.152433 12 AUT 0.117846 13 MEX 0.109127 14 HUN 0.076328 15 GRC 0.050471
The analysis of the study comprises two steps. In the first step, the four tourism data sets are se-lected to define the performance of these tourism destinations. Then, the data from these 15 coun-tries from 2009 to 2014 are collected. In the second step, to show the councoun-tries’ performance more clearly, the four factors selected for the tourism destinations are converted into a single score by means of the TOPSIS method, which is one of the most common multi-criteria decision-making methods. Then, the countries are ordered according to their scores with respect to the criteria, and their ratings are completed. The ratings of the tourism destinations are made by calculating their separate general tourism performance for the six years from 2009 to 2014.
The evaluation of each destination is given in three separate tables for 2009–2014. Table 9 shows the destinations’ performance that remained constant through the years, Table 10 shows those
Table 8. The performance of 15 important global destinations from 2009 to 2014
2009 2010 2011
Rating Codes Scores Rating Codes Scores Rating Codes Scores
1 USA 0.8607 1 USA 0.8668 1 USA 0.8353
2 DEU 0.5471 2 DEU 0.5293 2 DEU 0.5292
3 FRA 0.4922 3 CHN 0.4876 3 CHN 0.5219
4 CHN 0.4463 4 FRA 0.4517 4 FRA 0.4617
5 GBR 0.4452 5 GBR 0.4106 5 GBR 0.3973
6 ESP 0.3537 6 ESP 0.3252 6 ESP 0.3296
7 ITA 0.3419 7 ITA 0.3099 7 ITA 0.3042
8 RUS 0.2180 8 RUS 0.2374 8 RUS 0.2541
9 POL 0.1996 9 CAN 0.2142 9 CAN 0.2111
10 CAN 0.1957 10 POL 0.2028 10 POL 0.1903
11 TUR 0.1524 11 TUR 0.1459 11 TUR 0.1529
12 AUT 0.1178 12 AUT 0.1084 12 AUT 0.1027
13 MEX 0.1091 13 MEX 0.1053 13 MEX 0.0953
14 HUN 0.0763 14 HUN 0.0679 14 HUN 0.0611
15 GRC 0.0505 15 GRC 0.0398 15 GRC 0.0443
2012 2013 2014
Rating Codes Scores Rating Codes Scores Rating Codes Scores
1 USA 0.8614 1 USA 0.8238 1 USA 0.7631
2 CHN 0.5627 2 CHN 0.5762 2 CHN 0.6287
3 DEU 0.4912 3 DEU 0.4979 3 DEU 0.4754
4 FRA 0.4351 4 FRA 0.4213 4 FRA 0.3889
5 GBR 0.3804 5 GBR 0.3664 5 GBR 0.3485
6 ESP 0.3088 6 ESP 0.3083 6 ESP 0.3132
7 RUS 0.2835 7 RUS 0.3024 7 RUS 0.2744
8 ITA 0.2820 8 ITA 0.2702 8 ITA 0.2617
9 CAN 0.2121 9 CAN 0.1758 9 CAN 0.1719
10 TUR 0.1542 10 TUR 0.1604 10 TUR 0.1519
11 AUT 0.1034 11 AUT 0.0998 11 AUT 0.1189
12 MEX 0.0978 12 MEX 0.0960 12 MEX 0.1075
13 HUN 0.0590 13 HUN 0.0534 13 GRC 0.0632
14 POL 0.0472 14 GRC 0.0482 14 HUN 0.0519
whose performance improved through the years, and Table 11 indicates the destinations whose performance worsened.
Table 9 shows that the United States of America (USA), the United Kingdom (GBR) and Spain (ESP) were able to sustain their tourism activities in the years from 2009 to 2014. According to the above analysis, these three countries maintained their performance over these years. They protected their position in tourism activities from 2009 to 2014 in the global competition.
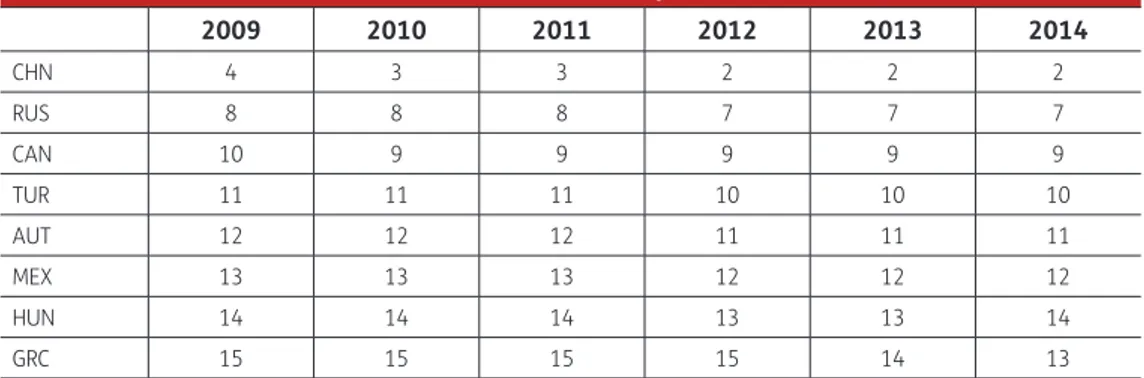
Table 10 indicates the change or improvement in the position of China (CHN). This destination rose to second place from fourth place in the 6 years examined. The other countries that improved their place were the Russian Federation (RUS), Canada (CAN), Turkey (TUR), Austria (AUT), Mexico (MEX) and Hungary (HUN). Greece was another destination that improved, particularly in 2013 and 2014. From its initial place at 15th in 2009, Greece moved to 14th in 2013 and 13th in 2014.
Table 11 lists the destinations whose performance worsened throughout the given years. Table 11 indicates that Germany (DEU), France (FRA) and Italy (ITA) fell one rank each in the period from 2009 to 2014. However, although these destinations are on this list with decreasing performance in the period from 2009 to 2014, they maintained an important place regarding the number of tourists they attracted and in the ranking they occupied in the competitive world of tourism. The place of Poland is also striking in this table. The tourism activities of this destination worsened since 2009. It ranked 9th in 2009 and fell gradually to 15th in 2014. However, this case is also an outstanding one: the data from the four factors indicate that all of the factors in this destination showed improvement from 2009 to 2014, but their rise was at a slower rate than that of the other countries, causing this desti-nation to fall behind.
Table 9. The destinations whose tourism activities remained constant (2009–2014)
2009 2010 2011 2012 2013 2014
USA 1 1 1 1 1 1
GBR 5 5 5 5 5 5
ESP 6 6 6 6 6 6
Table 10. The destinations whose tourism activities improved (2009–2014)
2009 2010 2011 2012 2013 2014 CHN 4 3 3 2 2 2 RUS 8 8 8 7 7 7 CAN 10 9 9 9 9 9 TUR 11 11 11 10 10 10 AUT 12 12 12 11 11 11 MEX 13 13 13 12 12 12 HUN 14 14 14 13 13 14 GRC 15 15 15 15 14 13
Table 11. The destinations whose performance worsened (2009–2014)
2009 2010 2011 2012 2013 2014
DEU 2 2 2 3 3 3
FRA 3 4 4 4 4 4
ITA 7 7 7 8 8 8
A survey of the related literature may find some studies that have used the TOPSIS method. The distinction between those studies and this study is that the results of this study yield a wide range (15 important destinations around the world, representing 70% of global tourism) and converts tourism activities such as international tourism expenditures, international tourism receipts, and the number of both inbound and outbound tourists into a single score using the TOPSIS method. The studies conducted using TOPSIS are mainly focused on the local or regional competition of countries or organizations. Rather than local or regional tourism, this study focuses on the global dimension of tourism and considers tourism from a global aspect to consider it in its entirety.
Few studies can be found in the related literature that process factors related to tourism activities, such as international tourism expenditures, international tourism receipts, and the number of in-bound and outin-bound tourists, using the TOPSIS method, which makes this study meaningful. Another important aspect of this study is that it uses data that are as recent as 2014.
8. Recommendations
In this study, all of the evaluation criteria are considered equal, and the performances of significant global tourism destinations, as represented by 15 countries, are evaluated. The study covers preva-lent tourism performance assessment criteria (international tourist arrivals and international tour-ism receipts) and includes the number of outgoing passengers and tourtour-ism expenditures. Prevalent methods of assessment do not produce a single point. Thus, there is no clear inference for the coun-tries’ tourism performance and rankings.
The findings reveal that when the number of outgoing passengers and tourism expenditures are considered in addition to more common criteria, the tourism performances of the 15 countries differ. In terms of tourism receipts, the top five countries are USA, ESP, FRA, DEU, and CHN, whereas in terms of international tourist arrivals, the top five countries are FRA, USA, ESP, CHN, and ITA. With regard to the single performance point based on the TOPSIS method, the country rankings are as follows: USA (0.7631), CHN (0.6287), DEU (0.474), FRA (0.3889), and GBR (0.3485).
The rankings according to tourism receipts and international tourist arrivals raise important points. Computing a single performance score allows the tourism performances of the countries to be evaluat-ed more accurately. However, more variables are requirevaluat-ed to provide meaningful results with the TOPSIS method. Because it is impossible to include at least the last 5 years’ worth of data and comparative data from the same countries, international tourist arrivals and tourism receipts were considered.
The fact that the TOPSIS method does not allow the use of more criteria is an important constraint in this study. Further studies may assess additional criteria, particularly “personnel employed in the tour-ism sector”, “number of beds in tourtour-ism facilities”, and “average bed prices per person”, which would provide the opportunity to evaluate more reliable results for countries’ tourism performance scores.
Funding
The authors received no direct funding for this research. Author details
Mehmet Oğuzhan Ilban1
E-mails: [email protected], [email protected] Hasan Hüseyin Yıldırım1
E-mail: [email protected]
1 The School of Applied Sciences, The University of Balikesir,
Burhaniye, Balikesir, Turkey. Citation information
Cite this article as: Determination of tourism activities of the world’s best tourism destinations using the multi-criteria decision-making method, Mehmet Oğuzhan Ilban & Hasan Hüseyin Yıldırım, Cogent Social Sciences (2017), 3: 1301763.
References
Charnes, A., Cooper, W. W., & Rhodes, E. (1978). Measuring the efficiency of decision making units. European Journal of Operational Research, 2, 429–444.
http://dx.doi.org/10.1016/0377-2217(78)90138-8 Chen, S. J., & Hwang, C. L. (1992). Fuzzy multiple attribute
decision making: Methods and applications. Berlin: SpringerVerlag.
http://dx.doi.org/10.1007/978-3-642-46768-4 Demireli, E. (2010). TOPSIS multi-criteria decision-making
method: An examination on state owned commercial banks in Turkey. Journal of Entrepreneurship and Development, 5, 101–112.
Deng, H., Yeh, C. H., & Willis, R. J. (2000). Inter-company comparison using modified TOPSIS with objective weights. Computers and Operations Research, 27, 963– 973.
Dwyer, L., & Forsyth, P. (2007). International handbook on the economics of tourism. Cheltenham: Edward Elgar. Eleren, A., & Karagül, M. (2008). Performance analysis of
Turkish economy between 1986–2006. Manisa Celal Bayar University, Journal of Management and Econonomics, 15, 1–14.
Feng, C. M., & Wang, R. T. (2000). Performance evaluation for airlines including the consideration of financial ratios. Journal of Air Transport Management, 6, 133–142. http://dx.doi.org/10.1016/S0969-6997(00)00003-X Hao, L., & Qing-sheng, X. I. E. (2006). Application of TOPSIS in
the bidding evaluation of manufacturing enterprises. 5th International Conference on e-Engineering and Digital Enterprise Technology, Proceeding of e-ENGDET, 16–18th August (pp. 184–188). Guiyang.
Hong, W. C. (2009). Global competitiveness measurement for the tourism sector. Current Issues in Tourism, 12, 105– 132.
http://dx.doi.org/10.1080/13683500802596359 Huang, J. H., & Peng, K. H. (2012). Fuzzy Rasch model in TOPSIS:
A new approach for generating fuzzy numbers to assess the competitiveness of the tourism industries in Asian countries. Tourism Management, 33, 456–465. http://dx.doi.org/10.1016/j.tourman.2011.05.006 Hwang, C. L., & Yoon, K. (1981). Multiple attribute decision
making. In Lecture notes in economics and mathematical systems (p. 186). Berlin: Springer-Verlag.
doi:10.1007/978-3-642-48318-9
Karimi, S. M., Yusop, Z., & Hook, L. S. (2010). Location decision for foreign direct investment in ASEAN countries (A TOPSIS Approach) (MPRA Paper No. 15000). Retrieved from http:// mpra.ub.uni-muenchen.de/15000/
Latham, J., & Edwards, C. (2003). The statistical measurement of tourism. In C. Cooper (Ed.), Aspect of tourism classic reviews in tourism (pp. 55–76). Brisbane: University of Queensland.
Lim, C. (1997). Review of international tourism demand models. Annals of Tourism Research, 24, 835–849. http://dx.doi.org/10.1016/S0160-7383(97)00049-2 Litvin, S. W., Goldsmith, R. E., & Pan, B. (2008). Electronic
word-of-mouth in hospitality and tourism management. Tourism Management, 29, 458–468.
http://dx.doi.org/10.1016/j.tourman.2007.05.011 Luo, W. B., Wang, Y. J., Wu, Y. Z., & Wu, Z. B. (2008). A study on
the evaluation of coordination between urban tourism and urban development based on the method of TOPSIS-A Case study of hangzhou [J]. Tourism Tribune, 12, 9–17.
Mangir, F., & Erdogan, S. (2011). Comparison of economic performance among six countries in global financial crisis: The application of fuzzy TOPSIS method. Economics, Management and Financial Markets, 6, 122–136. Mohamad, D., & Jamil, R. M. (2012). A preference analysis
model for selecting tourist destinations based on motivational factors: A case study in Kedah, Malaysia.
Procedia-Social and Behavioral Sciences, 65, 20–25. http://dx.doi.org/10.1016/j.sbspro.2012.11.085 Önder, E., Yıldırım, B. F., & Özdemir, M. (2013). Multi criteria
decision making approach for evaluating tourism destinations in Turkey. Academıc Journal of Tourısm and Management Researches, 1, 1–15.
Phillips, W. J., Wolfe, K., Hodur, N., & Leistritz, F. L. (2013). Tourist word of mouth and revisit intentions to rural tourism destinations: A case of North Dakota, USA. International Journal of Tourism Research, 15, 93–104. http://dx.doi.org/10.1002/jtr.v15.1
Shamai, A., & Mosivand, J. (2011). Classification of cities of Isfahan province in view point of tourism infrastructure by using TOPSIS and AHP models. Journal of Urban-Regional Studies and Research, 3, 23–40.
Shih, H. S., Shyur, H. J., & Lee, E. S. (2007). An extension of TOPSIS for group decision making. Mathematical and Computer Modelling, 45, 801–813.
http://dx.doi.org/10.1016/j.mcm.2006.03.023
Supçiller, A. A. & Çapraz, O. (2011). Supplier selection based on according to AHP-TOPSIS application. Istanbul University Journal of Econometrics and Statistics, 13, 1.
The World Bank. (2016). Data, international tourism statistics. Retrieved from Http://www.worldbank.Org/
Urfalıoğlu, F., & Genç, T. (2013). Comparison of the economic performance between Turkey and the European Union members with multi-criteria decision making methods. Marmara University Journal of Economic and Administrative Sciences, 35, 329–359.
Uygurtürk, H., & Korkmaz, T. (2012). The determination of financial performance with TOPSIS multiple criteria decision making method: An application on basic metal industry enterprises. Eskişehir Osmangazi University Journal of Economics And Administrative Sciences, 7, 95–115.
World Tourism Organization (UNWTO). (2015). UNWTO tourism highlights, 2015 Edition. Retrieved from Http://www2. Unwto.Org/
World Travel and Tourism Council (WTTC). (2014). Global Summit 2014. Retrieved September 1, 2015, from http:// www.wttc.org/
Yükçü, S., & Atağan, G. (2010, January). Performance evaluation according to TOPSIS. Journal of Accounting and Finance, 45, 28–36.
Zaman, K., Shahbaz, M., Loganathan, N., & Raza, S. A. (2016). Tourism development, energy consumption and Environmental Kuznets Curve: Trivariate analysis in the panel of developed and developing countries. Tourism Management, 54, 275–283.
http://dx.doi.org/10.1016/j.tourman.2015.12.001 Zhang, H., & Zhang, Y. (2010). Comparative Analysis on
regional competitiveness of tourism resources based on weighted TOPSIS method–A case study of the Yangtze River Delta. Resources and Environment in the Yangtze Basin, 19, 500–505.
© 2017 The Author(s). This open access article is distributed under a Creative Commons Attribution (CC-BY) 4.0 license. You are free to:
Share — copy and redistribute the material in any medium or format
Adapt — remix, transform, and build upon the material for any purpose, even commercially. The licensor cannot revoke these freedoms as long as you follow the license terms. Under the following terms:
Attribution — You must give appropriate credit, provide a link to the license, and indicate if changes were made. You may do so in any reasonable manner, but not in any way that suggests the licensor endorses you or your use. No additional restrictions
You may not apply legal terms or technological measures that legally restrict others from doing anything the license permits.
Cogent Social Sciences (ISSN: 2331-1886) is published by Cogent OA, part of Taylor & Francis Group. Publishing with Cogent OA ensures:
• Immediate, universal access to your article on publication
• High visibility and discoverability via the Cogent OA website as well as Taylor & Francis Online • Download and citation statistics for your article
• Rapid online publication
• Input from, and dialog with, expert editors and editorial boards • Retention of full copyright of your article
• Guaranteed legacy preservation of your article
• Discounts and waivers for authors in developing regions