INFORMED TRADING IN BORSA ˙ISTANBUL
The Graduate School of Economics and Social Sciences of
˙Ihsan Do˘gramacı Bilkent University
by
MURAT T˙IN˙IC¸
In Partial Fulfillment of the Requirements for the Degree of DOCTOR OF PHILOSOPHY IN MANAGEMENT
THE DEPARTMENT OF MANAGEMENT ˙IHSAN DO ˘GRAMACI B˙ILKENT UNIVERSITY
ANKARA
ABSTRACT
INFORMED TRADING IN BORSA ˙ISTANBUL
Tini¸c, Murat
Ph.D. in Department of Management Advisor: Asst. Prof. Dr. Ay¸se Ba¸sak Tanyeri
Co-Advisor: Prof. Dr. Aslıhan Salih
May 2019
This thesis investigates how information asymmetry a↵ects asset prices in Borsa ˙Istanbul. In the first chapter, we introduce the R package InfoTrad that estimates the probability of informed trading. Next, we examine the relationship between in-formation asymmetry and stock returns in Borsa ˙Istanbul. Firm-level cross-sectional regressions indicate an economically insignificant relationship between PIN and fu-ture returns. Moreover, univariate and multivariate portfolio analyses show that portfolios of stocks with high levels of informed trading do not realize significant return premiums. Consequently, our results, suggest that information asymmetry is a firm-specific risk and it can be eliminated with portfolio diversification. Finally, we compare the informational (dis)advantage of foreign investors trading in Borsa ˙Istanbul. We first show that an average foreign trade creates buy pressure whereas an average local trade generates a sell pressure. The permanent impact of foreign investors over and above local investors is significant only for 24 stocks which cor-respond to 7% of our sample. Importantly, we show that the foreign price impact occurs primarily in a period of political instability which started with the Gezi Park protests in June 2013. In a panel setting, we also show that adverse selection cost due to foreign trading significantly increases even when we control for firm-specific
factors along with global and local macroeconomic conditions. Domestic investors with undiversified portfolios may be more risk-averse during periods of increased tur-moil. This may enable foreign investors to have a better position to take advantage of potential price misalignments, especially for stocks of commercial banks.
Keywords: Asset Pricing, Market Microstructure, Political Turmoil, Probability of Informed Trading, R.
¨
OZET
BORSA ˙ISTANBUL’DA B˙ILG˙IYE DAYALI ALIM VE SATIMLAR
Tini¸c, Murat Doktora, ˙I¸sletme
Tez Danı¸smanı: Dr. ¨O˘gr. ¨Uyesi Ay¸se Ba¸sak Tanyeri 2. Tez Danı¸smanı: Prof. Dr. Aslıhan Salih
Mayıs 2019
Bu tez, bilgi asimetrisinin Borsa ˙Istanbul’da varlık fiyatlarını nasıl etkiledi˘gini incele-mektedir. Tezin ilk b¨ol¨um¨unde, bilgiye dayalı alım satım oranı (BDASO) ¨ol¸c¨ut¨un¨un hesaplanması ¨uzerine geli¸stirilen y¨ontemleri bir araya getiren, R diliyle hazırlanmı¸s InfoTrad istatistiksel paketini tanıtmaktayız. Bir sonraki b¨ol¨umde, Borsa ˙Istanbul’da i¸slem g¨oren t¨um hisseler i¸cin, bilgiye dayalı alım satım oranı (BDASO) ile hisse senedi getirileri arasındaki ili¸ski incelenmektedir. ˙I¸slem g¨oren her hisse i¸cin her ay BDASO de˘gerlerini g¨un i¸ci i¸slem defteri verilerini kullanarak hesapladık. BDASO de˘gerleri ile hisse senetlerinin aylık getirileri arasındaki ili¸skiyi, regresyon analizi, tek de˘gi¸skenli portf¨oy analizi ve ¸cift de˘gi¸skenli portf¨oy analizleri ile inceledik. Sonu¸clarımız Borsa ˙Istanbul’da BDASO ile ¨ol¸c¨ulen bilgi asimetrisinin hisse senedi fiyatları ¨uzerinde sis-tematik bir risk unsuru olmadı˘gını g¨ostermektedir. Bu kapsamda, sonu¸clarımız, literat¨urde bilgi asimetrisi riskinin portf¨oy ¸ce¸sitlendirmesiyle ortadan kaldırılması gerekti˘gini savunan teorik ¸calı¸smalarla uyumludur.
Son b¨ol¨umde, Borsa ˙Istanbul’da i¸slem yapan yerli ve yabancı yatırımcılar arasındaki bilgi asimetrisini incelemekteyiz. ˙Ilk olarak, ortalama bir yabancı yatırımcı i¸sleminin piyasada alım baskısı olu¸stururken, yerli yatırımcının satı¸s baskısı yarattı˘gını g¨oster-mekteyiz. Yabancı yatırımcıların fiyatlara kalıcı etkisini, veri k¨umemizin y¨uzde
7’sine tekab¨ul eden, 24 hisse de g¨ozlemlemekteyiz. Yabancı yatırımcıların fiyat etk-isinin, Haziran 2013’te Gezi Parkı protestolarıyla ba¸slayan siyasi olarak ¸calkantılı d¨onemde ger¸cekle¸sti˘gini g¨ostermekteyiz. Panel regresyon analizlerimizde, firmaya ¨ozg¨u fakt¨orler, yerel ve k¨uresel makroekonomik ko¸sulları kontrol etti˘gimizde bile, ya-bancı yatırımcılara ba˘glı ters se¸cim maliyetlerinin, Haziran 2013’den sonra arttı˘gını g¨ostermekteyiz. Portf¨oy ¸ce¸sitlili˘gi d¨u¸s¨uk olan yerli yatırımcılar artan karma¸sa d¨onem-lerinde riskten ka¸cabilirler. Bu durum, yabancı yatırımcıların, olası fiyat yanlı¸slıklarından kendilerine avantaj sa˘glamalarına neden olabilir.
Anahtar Kelimeler: Bilgiye Dayalı-Alım Satım Oranı, Piyasa Mikroyapısı, Politik Karı¸sıklıklar, R, Varlık Fiyatlaması.
ACKNOWLEDGEMENTS
First and foremost, I would like to express my gratitude to my advisors, Prof. Aslıhan Salih, Asst. Prof. Tanseli Sava¸ser and Asst. Prof. Ba¸sak Tanyeri for their constant support throughout my Ph.D. studies. I am thankful for the trust they have put on me and on my work, for their encouragement, valuable guidance, and immense knowledge. They are not only my advisors but also life-long mentors to me. Their support enables me to go forward, even when everything seems dark. It was an honor for me to have the chance to work with such great people. I sincerely hope that I continue to work with them long into the future.
Second, I would like to thank the members of my thesis committee Prof. Nuray G¨uner and Assoc. Prof. Levent Akdeniz for spending valuable time on the material I prepared for my committee meetings, for challenging me with their visionary questions and comments throughout my dissertation research. I am also very grateful to Prof. K¨ur¸sat Aydo˘gan and Asst. Prof. ˙Ilkay S¸endeniz Y¨unc¨u for accepting to serve as members of my dissertation examination committee, taking the time o↵ their busy schedules to read this thesis, and for their valuable
suggestions for future directions.
My special appreciation is reserved for Prof. Albert Menkveld, who gave me the opportunity to visit Vrije Universiteit Amsterdam. I genuinely enjoyed every moment I spent there and it turned out to be a quite productive period for my Ph.D. studies. I thank Prof. Menkveld for devoting his valuable time and resources to enrich my visit. I genuinely hope that I can be as much an inspiration to my students some days as he has been to me. Moreover, I would like to thank Asst.
Prof. G¨unseli T¨umer Alkan for her kindness and support throughout my visit and many delightful conversations we had. I would like to also thank Shihao Yu and Ekaterina Serikova for their friendship during my visit.
Special thanks to the Faculty of Business Administration at Bilkent University for giving me a solid background and the opportunity to carry out my doctoral
research. I am grateful to each faculty member but I would like to express my wholehearted gratitude to our graduate student director Assoc. Prof. Ahmet Ekici for taking many steps to make our lives better in every direction. In addition, I am particularly thankful to Prof. G¨uliz Ger for inspiring me to work harder and for her guidance towards life after Ph.D. I would like to also thank Assoc. Prof. S¨uhelya
¨
Ozyıldırım, for her encouragement and kind words at critical moments. Moreover, I would like to thank the members of our administrative sta↵, Dilek Akın, Fulya Akmut, Zeliha Baran, ˙Ismail C¸ etin and Remin Tanto˘glu for making me feel like I am part of a large family and easing my life with their constant assistance.
I have had the chance to work with various scholars outside Bilkent FBA
throughout my Ph.D. study. My heartfelt thanks go to Dr. Canan G¨une¸s C¸ orlu, who introduced me to finance during my undergraduate years, for her kindness, patience, and support. I also thank her for being an incredible person to work with. Her guidance started the fire that led me to where I am today. I would like to also thank my co-authors, Dr. Melike Meterelliyoz Kuyzu and Dr. Syed
Mahmud, for being excellent mentors and patiently guiding me through the publication process in the early years of my studies. I hope our collaboration will continue in the future.
I have met many wonderful people during my time at Bilkent. I would like to thank ˙Idil Ayberk for being the best colleague one can ever have. I had so much fun working with ˙Idil, since day one. Our joint struggle drew us together and created a
bond that will last for a lifetime. I also thank Ecem Cephe, John Omole, Shahid Mahmud, Bur¸cak Ba¸s, Mubin Memon whom I shared great memories and many cups of co↵ee within a tiny office space called MAZ24-A. My sincere thanks to Duygu C¸ elik, for being a great co-author, and for her patience and determination.
In addition, I would like to thank Alp Yıldırım, Mehmetcan Kılın¸c, G¨ulce C¸ akman, G¨uray Kara, Zeynep Bora, M¨uge Demir, Merve Demirel, Sabeeh Iqbal, Pelin
S¨umer, Ezgi Arslan Alp, G¨ulay Taltekin, Zeynep Baktır, Emre Bulut, Bengisu Sert, Okan D¨ukkancı, Nihal Berkta¸s, Kamyar Kargar, Burak Pa¸c, Esra Koca, Hatice C¸ alık, Meltem Peker, Merve Meraklı and Ece Zeliha Demirci for their invaluable friendship. A special thanks to my dear friend Emrecan S¸en¨oz, who helped me go over my codes many times when I thought I was at a dead end.
There are no words to express my love for my mom S¨ureyya Tini¸c and my dad Sinan Tini¸c. I am forever grateful for their constant, unconditional love and support, and for encouraging me to pursue my interests. I would not be here if it were not for my family.
For the last ten years, my life has been transformed thanks to a true genius; Dr. Gizem ¨Ozbaygın. Gizem is not only the Northstar that I follow when I am lost; but also my humble travel companion who is constantly serving as a ladder that
enables me to reach beyond my potential. Her love gives me purpose and I am eternally grateful for her mere existence. I cannot be more happy to spent the rest of my life, my career and everything else I have with her. I know that, together, we can achieve anything we strive for.
I gratefully acknowledge the financial support provided by The Scientific and Technological Research Council of Turkey (T ¨UB˙ITAK) with grant number 116K335 for funding part of this thesis.
TABLE OF CONTENTS
ABSTRACT . . . iii ¨ OZET . . . v ACKNOWLEDGEMENTS . . . vii TABLE OF CONTENTS . . . xLIST OF TABLES . . . xiii
LIST OF FIGURES . . . xiv
CHAPTER I: INTRODUCTION 1 1.1 Overview . . . 1
CHAPTER II: InfoTrad: An R package for estimating the probability of informed trading 4 2.1 Introduction . . . 4 2.2 PIN Model . . . 7 2.2.1 Floating-Point Exception . . . 8 2.2.2 Boundary Solutions . . . 9 2.2.3 Clustering Approach . . . 11 2.3 InfoTrad package . . . 12 2.3.1 EHO() function . . . 14 2.3.2 LK() function . . . 16 2.3.3 YZ() function . . . 18 2.3.4 GAN() function . . . 20 2.3.5 EA() function . . . 23
2.4 Simulations and Performance Evaluation . . . 25
2.5 Conclusion . . . 28
CHAPTER III: Informed trading, order flow shocks and the cross section of expected returns in Borsa Istanbul 30 3.1 Introduction . . . 30
3.2 PIN model and its extensions . . . 33
3.2.1 Probability of Symmetric Order-Flow Shock (PSOS) . . . 34
3.3 Sample Formation . . . 36
3.4 Methodology . . . 39
3.4.1 Fama-MacBeth Regressions . . . 39
3.4.2 Univariate Portfolio Analysis . . . 42
3.4.3 Multivariate Portfolio Analysis . . . 43
3.4.4 Factor Tests . . . 44
3.5 Results . . . 44
3.5.1 Regression analysis . . . 44
3.5.2 Univariate Portfolio Analysis . . . 45
3.5.3 Multivariate Portfolio Analysis . . . 51
3.6 Conclusion . . . 55
CHAPTER IV: Political turmoil and the impact of foreign orders on equity prices 57 4.1 Introduction . . . 57
4.2 Data . . . 63
4.3 Methodology . . . 75
4.3.1 Estimating the price impact of foreign trades . . . 75
4.3.2 Panel Regressions . . . 79
4.4 Results . . . 82
4.4.2 Panel Regressions . . . 86 4.5 Conclusion . . . 91
CHAPTER V: CONCLUSIONS 94
REFERENCES . . . 98 APPENDIX: Variable Definitions . . . 105
LIST OF TABLES
2.1 Simulation results to examine the relationship between trade intensity
and the estimates of PIN. . . 27
2.2 Simulation results to examine the performance of di↵erent methods in estimating the parameters for PIN . . . 29
3.1 Descriptive statistics on number of buy and sell orders. . . 38
3.2 Descriptive statistics on the cross sectional distributions of monthly factors. . . 40
3.3 Factor Correlations . . . 41
3.4 Fama-MacBeth Regressions . . . 46
3.5 Descriptive Statistics for PIN portfolios-1 . . . 48
3.6 Return characteristics of univariate PIN portfolios . . . 49
3.7 Characteristics and Returns of PIN-Size Portfolios . . . 53
3.8 Fama-French Three Factor Regressions . . . 54
4.1 Descriptive Statistics for firm specific factors . . . 67
4.2 Factor Correlations . . . 68
4.4 Full sample estimates for price impact . . . 84
4.5 List of stocks that foreigners have significant price impact . . . 85
4.6 Descriptive Statistics for the monthly coefficients . . . 88
LIST OF FIGURES
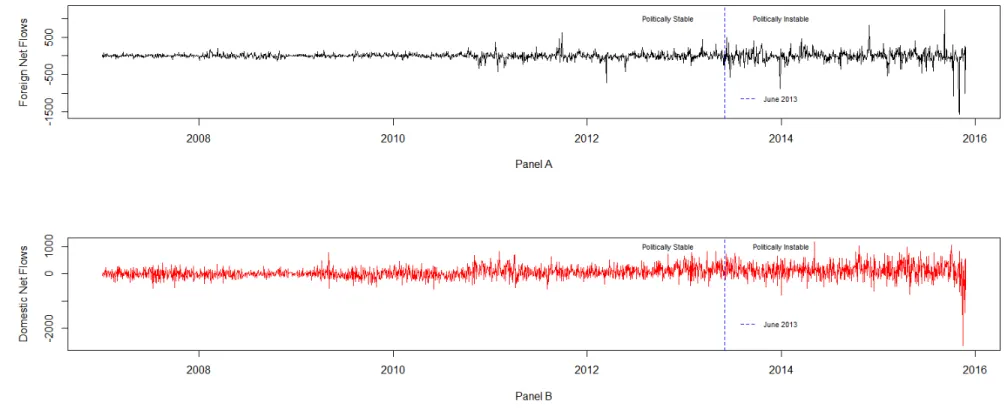
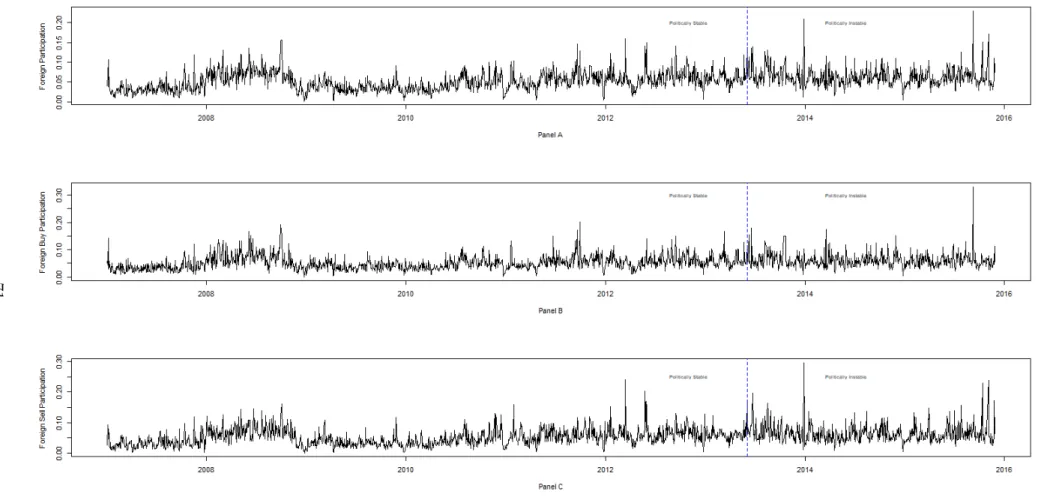
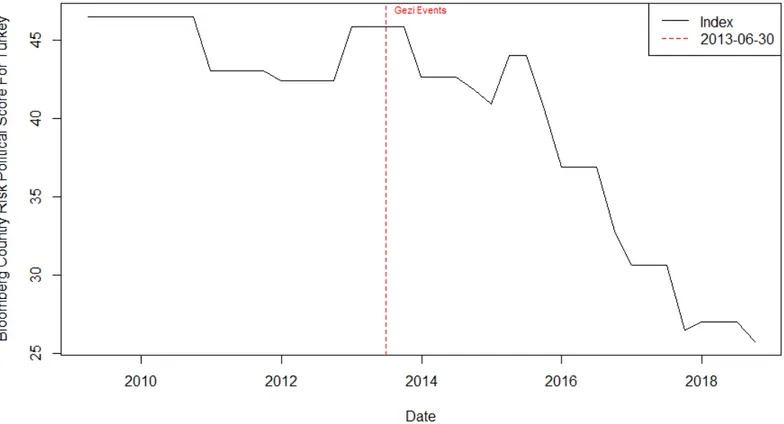
4.1 Time Series Variation in Daily Volume of Foreign and Domestic Net Flows . . . 70 4.2 Time Series Variation in Daily Foreign Participation . . . 71 4.3 Bloomberg Country Risk Political Score for Turkey . . . 74
CHAPTER I
INTRODUCTION
1.1.
Overview
This study focuses on the impact of information asymmetry on the asset prices in Borsa Istanbul. In recent years, the number of studies that examine the market microstructure of Borsa Istanbul increased significantly. Throughout this research, I employed a variety of tools from the field of market microstructure and empirical asset pricing to contribute to this growing literature.
In the next chapter of this thesis, we provide a survey of the existing literature and introduce an R package called InfoTrad for estimating the probability of informed trading (PIN). PIN is one of the most prominently used information asymmetry measures in the market microstructure literature. Estimates, obtained through maximum likelihood estimation, are prone to bias due to several problems. First, early studies using PIN were vulnerable to sample selection bias due to floating point exception in estimating the measure. Second, the estimates are susceptible to potential bias due to boundary solutions obtained in the optimization process. InfoTrad is a platform that combines the alternative factorizations and methods that deal with the problems due to floating point exception along with issues regarding the boundary solutions. Moreover, InfoTrad provides recently proposed clustering algorithms that ensure fast and reliable estimates for the PIN.
In the third chapter, we examine the relationship between the information
asymmetry, proxied by PIN, and the stock returns in Borsa Istanbul. To the best of our knowledge, this study is the first to examine the systematic impact of information asymmetry on returns of stocks that are traded on Borsa Istanbul. There are conflicting views on the relationship between information risk and securities’ returns. One side of the argument asserts that uninformed investors are inferior in adjusting their portfolios quickly, in the presence of new information, and therefore require a premium for stocks that they are at a disadvantage. On the other hand, other studies argue that in a large economy where the number of securities is infinite, increase in the information asymmetry yields an increase in returns for the overall market and therefore, after controlling for systematic factors, information risk is idiosyncratic and fully diversifiable. We find an economically insignificant relationship between PIN and future returns of Turkish stocks over March 2005 and April 2017. Moreover, we provide univariate and multivariate portfolio analyses which suggest that investors who hold shares with high information asymmetry do not obtain significant future returns. Therefore, we conclude that information asymmetry is a firm-specific risk in Borsa Istanbul, which can be eliminated through portfolio diversification.
In the last chapter, we compare the informational (dis)advantage of foreign
investors across all stocks that are traded in Borsa Istanbul between 2007 and 2015. Foreigners dominate the Turkish stock market, holding almost 65 percent of the publicly-traded shares in Borsa Istanbul. Therefore, examining the foreign
investors’ role is crucial for understanding the price discovery process in emerging economies like Turkey, which rely heavily on outside financing. To this end, we test the baseline hypothesis that local investors have no informational advantage over foreign investors. Our findings indicate that domestic investors have a significant price impact over 43 percent of the stocks in our sample whereas the price impact
of foreign investors is statistically significant for only seven percent of the entire cross-section. More importantly, in this study, we examine if and how the increased political uncertainty in Turkey a↵ects the price impact of local and foreign
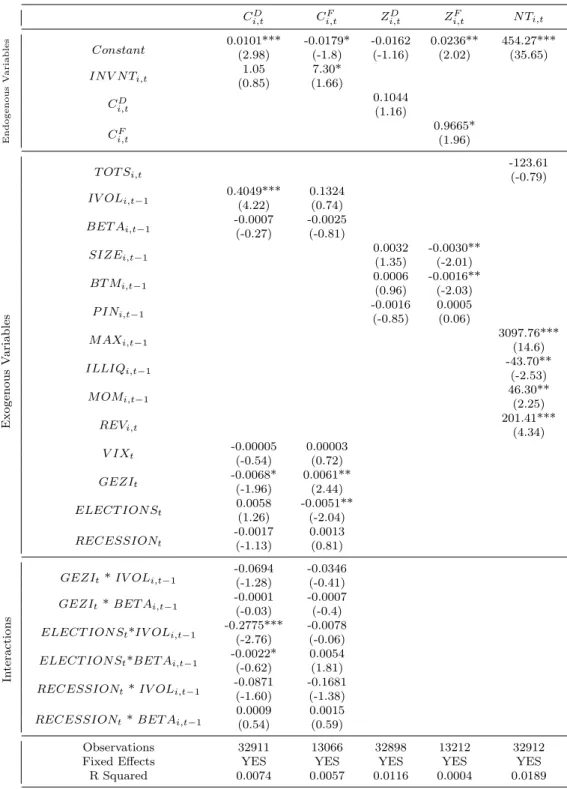
investors. We argue that, due to inherent di↵erences in domestic and international investors’ exposure to Turkey-specific political uncertainty, the price impact of these investor groups is sensitive to the underlying political environment. Our subsample analysis indicates that foreign impact increases during times of the political turmoil, which started with the Gezi protests in June 2013. Our panel regression analysis also confirms these findings and suggests that the adverse selection component of the foreign trades significantly increases following June 2013, even after controlling for firm-specific and macroeconomic factors. Our results indicate that though foreigners on average are at a disadvantage in Borsa Istanbul, political uncertainty partially alleviates this disadvantage and creates an opportunity for foreign investors to exert price impact over a larger number of securities. This research contributes to a broad literature that examines the impact of foreign investor flows in equity markets which have grown significantly following the capital market liberalization wave of the 1990s. To the best of our knowledge, it is the first market microstructure study that explores the e↵ect of political instability on the relative price impact of foreign and domestic investors.
CHAPTER II
INFOTRAD: AN R PACKAGE FOR
ESTIMATING THE PROBABILITY OF
INFORMED TRADING
2.1.
Introduction
The main aim of this chapter is to present the InfoTrad package that estimates the probability of informed trading (PIN) initially proposed by Easley et al. (1996). PIN is one of the primary measures that proxy the information asymmetry in the market. The sequential model is driven from maximum likelihood estimation (MLE). Wide range of studies use PIN to answer questions in di↵erent fields of finance1.
Although it is a heavily used measure in the finance literature, the development of applications that calculate PIN are quite slow. An initial attempt for R community is made by Zagaglia (2012). FinAsym package of Zagaglia (2012) and the PIN package of Zagaglia (2013) provide the trade classification algorithm of Lee and Ready (1991) which is an important tool for studies that use databases where a flag to denote the direction of the trade is not provided (e.g, TAQ database). Both
1For instance, analyst coverage (Easley et al., 1998), stock splits (Easley et al., 2001), initial
public o↵erings Ellul and Pagano (2006), credit ratings (Odders-White and Ready, 2006), M&A announcements (Aktas et al., 2007) and asset returns (Easley et al., 2002),(Easley et al., 2010).
packages also provide PIN estimates through pin likelihood() functions. However, those estimates are prone to bias due to misspecification and other limitations. InfoTrad package aims to overcome such limitations and provide users with a wide range of options when estimating PIN.
Due to the popularity of the measure, problems in estimating PIN recently gained attention in the finance literature. Easley et al. (2010) indicate that for stocks with a large trading volume, it is not possible to estimate the PIN due to
floating-point-exception (FPE). Two di↵erent numerical factorizations are provided by Easley et al. (2010) and Lin and Ke (2011) to overcome the bias created due to FPE.
In addition, boundary solutions in estimating PIN are also shown to create bias in empirical studies. Yan and Zhang (2012) show that, independent of the type of factorization, the likelihood function can stuck at local optimum and provide bias in PIN estimates. They propose an algorithm (YZ algorithm) that spans the parameter space using 125 di↵erent initial values for the MLE problem and obtain the estimate that gives the highest likelihood value with non-boundary solutions. Although YZ algorithm provides estimates with higher likelihood and guarantees to obtain non-boundary solutions, the iterative structure makes this algorithm
time-consuming especially for studies that use large datasets.
Considering the fact that recent studies that estimate PIN use large datasets, the e↵ectiveness of the YZ algorithm is questioned. In recent years, clustering
algorithms have become popular due to their efficiency in processing large sets of data. Gan et al. (2015) propose an algorithm that use hierarchical agglomerative clustering to estimate PIN. Ersan and Alici (2016) later extends this framework. FPE and boundary solutions are not the only problems of PIN model. Duarte and Young (2009) indicate that the structural model of Easley et al. (1996) enforces a
negative contemporaneous covariance between intraday buy and sell orders, which is contrary to the empirical evidence for symmetric order flow shocks. In addition, they show that the PIN model fails to capture the di↵erence in the volatility of buy and sell orders, through simulations. Moreover, Duarte and Young (2009) adjust PIN to take into account the liquidity impact and show that liquidity is more prominent on stock returns compared to information asymmetry. Finally it is important to note that PIN does not consider any strategic behaviour of investors such as order splitting. Order splitting can be more evident when a stock is jointly trading on multiple venues (Menkveld, 2008). Even for a stock that is traded on a single market, an informed investors may want to split her order to avoid revealing her private information too quickly (Foucault et al., 2013). PIN model, by
construction, fails to attach multiple small orders to a single informed investor. This chapter introduces and discusses the R R Core Team (2016) InfoTrad package for estimating PIN. InfoTrad provides users with necessary methods to solely address the problems of FPE and boundary solutions2. The package contains
the likelihood factorizations of Easley et al. (2010) and Lin and Ke (2011) as separate functions (EHO() and LK(), respectively) which provide likelihood specifications to avoid FPE. In addition, through YZ(), GAN() and EA()
functions, PIN estimates can be obtained using the grid-search algorithm of Yan and Zhang (2012), and clustering algorithms of Gan et al. (2015) and Ersan and Alici (2016). For all algorithms, likelihood specification can be set to EHO or LK. The chapter is organized as follows; Section 2.2 provides a brief description of PIN. Specifically, section 2.2.1 discusses the problem of FPE and the alternative
factorizations EHO and LK. Section 2.2.2 reviews the problem of boundary
solutions and the YZ algorithm. Section 2.2.3 describes the clustering algorithms of Gan et al. (2015) and Ersan and Alici (2016). Section 2.3 introduces the package
InfoTrad along with examples. Section 2.4 evaluates the performance of each method through simulations. Section 2.5 provides concluding remarks.
2.2.
PIN Model
The structural model of Easley et al. (1996) and Easley et al. (2002) consists of three types of agents; informed traders, uninformed traders and market makers. On a trading day t, one risky asset is continuously traded. Market maker sets the price for a given stock by observing the buy orders (Bt) and sell orders (St). For that
stock, an information event is assumed to follow a Bernoulli distribution with success probability ↵. This event reveals either a good or a bad signal for the underlying value of the stock. The event is assumed to provide a bad signal with probability . When informed traders observe a good (bad) signal, they are
assumed to place buy (sell) orders at a rate of µ. Uninformed traders are assumed to place orders, independent of the information event or the signal. They arrive to market to place a buy (sell) order at a rate of ✏b(✏s). Orders of both informed and
uninformed investors are assumed to follow independent Poisson processes. The joint probability distribution with respect to the parameter vector ⇥ ={↵, , µ, ✏b, ✏s} and the number of buys and sells (Bt, St), is specified by
f (Bt, St|⇥) = ↵ exp( ✏b) ✏Bt b Bt! exp[ (✏s+ µ)] (✏s+ µ)St St! + ↵(1 ) exp[ (✏b+ µ)] (✏b+ µ)Bt Bt! exp( ✏s) ✏St s St! + (1 ↵) exp( ✏b) ✏Bt b Bt! exp( ✏s) ✏St s St! (2.1)
The estimates of arrival rates {ˆµ, ˆ✏b, ˆ✏s}, along with the estimates of the
function given the order input matrix (Bt, St) over T trading days. The non-linear
objective function of this problem can be written as;
L(⇥|T ) ⌘ T X t=1 L(⇥|(Bt, St)) = T X t=1 log(f (Bt, St|⇥)) (2.2)
The maximization problem is subject to the boundary constraints ↵, 2 [0, 1] and µ, ✏b, ✏s2 [0, 1)3. The PIN estimate is then given by;
[ P IN = ↵ˆˆµ ˆ ↵ˆµ + ˆ✏b+ ˆ✏s (2.3)
2.2.1
Floating-Point Exception
PIN estimates are prone to selection bias, especially for stocks for which the
number of buy and sell orders are large4. Lin and Ke (2011) show that the increase
in the number of buy and sell orders for a given stock, significantly shrinks the feasible solution set for the maximization of the log-likelihood function in equation (2.2). To maximize the non-linear function (2.1), the optimization software
introduces initial values for ⇥. The numerical optimization method is applied after those initial parameters are introduced. Therefore, for large enough Bt and St,
whose factorials cannot be calculated by mainstream computers (i.e. FPE), the optimal value for equation (2.2) becomes undefined. The FPE problem is therefore, more pronounced in active stocks.
To avoid the selection bias created due to FPE, one factorization of the equation 3Both PIN package of Zagaglia (2013) and FinAsym package of Zagaglia (2012) fail to
ac-knowledge the boundary constraints on the arrival rates, µ, ✏b, ✏s. Similar to event probabilities,
they restrict these parameters to [0,1] which forces the estimates for the arrival of informed and uninformed traders on a given day to take values at most one. This creates significant bias in PIN estimates.
4For example, Zagaglia (2012) provides a sample data to calculate PIN. In sample data, the
maximum trade number is 19. If you multiply each observation in the sample data by 10, the pin likelihood() function of FinAsym package fails to provide results with the sample initial pa-rameter vector.
(2.2) is provided by Easley et al. (2010) as LEHO(⇥|T ) ⌘ PTt=1LEHO(⇥|Bt, St)
which is given by;
LEHO(Bt, St) = log h ↵ exp( µ)xBt Mt b x Mt s + ↵(1 ) exp( µ)xbMtx St Mt s + (1 ↵)xBt Mt b x St Mt s i + Btlog(✏b+ µ) + Stlog(✏s+ µ)
(✏b+ ✏s) + Mt[log(xb) + log(xs)] log(St!Bt!) (2.4)
where Mt= min(Bt, St) + max(Bt, St)/2, xb = ✏b/(µ+b) and xs = ✏s/(µ + ✏s).
Lin and Ke (2011) introduce another algebraically equivalent factorization of the equation (2.1), LLK(⇥|T ) ⌘PTt=1LLK(⇥|Bt, St) which is given by;
LLK(⇥|Bt, St) = log
h
↵ exp(e1t emax t) + ↵(1 ) exp(e2t emax t)
+ (1 ↵) exp(e3t emax t
i
+ Btlog(✏b + µ) + Stlog(✏s+ µ)
(✏b+ ✏s) + emax t log(Bt!St!) (2.5)
where e1t = µ Btlog(1 + µ/✏b), e2t= µ Stlog(1 + µ/✏s),
e3t = Btlog(1 + µ/✏b) Stlog(1 + µ/✏s) and emax t = max(e1t, e2t, e3t). The last
term log(Bt!St!) is constant with respect to the parameter vector ⇥, and is,
therefore, dropped in the MLE for both factorizations.
2.2.2
Boundary Solutions
Another source of bias in estimating PIN arises from boundary solutions. Yan and Zhang (2012) indicate that in calculating PIN, parameter estimates ˆ↵ and ˆ usually fall onto the boundaries of the parameter space, that is, they are equal to zero or
one. PIN estimate presented in equation (2.3) is directly related to the estimate of ˆ
↵. Letting ˆ↵ equal to zero will make sure that PIN is zero as well. This can create a sample selection bias in portfolio formatio especially for quarterly estimations5. Yan and Zhang (2012) show that;
E(B) = ↵(1 )µ + ✏b (2.6)
E(S) = ↵ µ + ✏s (2.7)
Then they porpose the following algorithm to overcome the bias created due to boundary solutions. Let (↵0, 0, ✏0
b, ✏0s, µ0) be the initial parameter function to be
placed in the non-linear program presented in equation (2.2). In addition, let ¯B and ¯S be the average number of buy and sell orders. Then, set
↵0 = ↵i, 0 = j, ✏0b = kB,¯ µ0 = ¯ B ✏0 b ↵0(1 0), and ✏s = ¯S ↵ 0 0µ0 (2.8)
where ↵i, j, k 2 {0.1, 0.3, 0.5, 0.7, 0.9}. This procedure yields 125 di↵erent PIN
estimates along with their likelihood values. In line with Yan and Zhang (2012), we drop any initial parameter vector having negative values for ✏0
s. In addition,
following Ersan and Alici (2016), we also drop any initial parameter vector with µ0 > max(Bt, St). Yan and Zhang (2012) then select the estimate with
non-boundary parameters yielding the highest likelihood value. This method, by construction, spans the parameter space and tries to avoid local optima and provides non-boundary estimates for ↵.
5For quarterly estimations of PIN, one can be sure that there is at least one information event:
2.2.3
Clustering Approach
In recent years, clustering algorithms are increasingly becoming popular in estimating the probability of informed trading due to efficiency concerns. Gan et al. (2015) ad Ersan and Alici (2016) use clustering algorithms to estimate PIN. Gan et al. (2015) introduce a method that clusters the data into three groups (good news, bad news, and no news) based on the mean absolute di↵erence in order imbalance. Let Xt = Bt St be the order imablance on day t computed as
the di↵erence between buy and sell orders. The clustering is then based on the distance function defined as D(I, J) =|Xi Xj|, 1 i, j T where i 6= j. They
use hierarchical agglomerative clustering (HAC) to group the data elements based on the distance matrix. Specifically, they use hclust() function of M¨ullner (2013) in R6. The algorithm sequentially clusters, in a bottom-up fashion, each observation
into groups based on Xt and stops when it reaches three clusters. The theoretical
framework of Easley et al. (1996) indicates that a stock has high (low) Xt on good
(bad) days. Therefore, the cluster which has the highest (lowest) mean Xt is
labelled as good (bad) news cluster. The remaining cluster is then labelled as no news. Once each observation is grouped into their respective clusters (good news, bad news, no news), c2 {G, B, N}, the parameter estimates for ⇥ ⌘ {↵, , µ, ✏b, ✏s}
are calculated simply by counting. Let !c be the proportion of cluster c occupying
the total number of days T , such that P3c=1!c = 1. Similarly, let ¯Bc and ¯Sc be the
average numver of buys and sells on cluster c, respectively.
Then, the probability of information event is given by ˆ↵ = !B+ !G. Moreover, the
estimate for the probability of information event releasing a bad new is given by ˆ = !B/ˆ↵. The estimate for the arrival rate of buy orders of uninformed traders is
represented by ˆ✏b = !B!+!B NB¯B+!B!+!NNB¯N. Similarly, the estimate for the arrival
rate of sell orders of uninformed traders is represented by ˆ
✏s = !G!+!GNS¯G+!G!+!NNS¯N. Finally, the arrival rate for the informed investors is
calculated as ˆµ = !G
!B+!G( ¯BG ✏ˆb) +
!B
!B+!G( ¯SB ✏ˆs) where ( ¯BG ✏ˆb) corresponds to
the buy rate of informed investors ˆµb and ( ¯SB ✏ˆs) corresponds to the sell rate of
informed investors ˆµs7.
Through simulations, Gan et al. (2015) show that estimates calculated as above are proper candidates for the initial parameter values to be used in the MLE process. Ersan and Alici (2016) argue that the estimates for the informed arrival rate, µ, contains a downward bias with GAN algorithm8. In addition, they state that the
GAN algorithm provides inaccurate estimates for . In order to overcome these issues, instead of using Xt, Ersan and Alici use absolute daily order imbalance,
|Xt|, to cluster the data. They initially cluster, |Xt| into two, again by using
hclust(). The cluster with lower mean daily absolute order imbalance is labelled as “no event” cluster. Then, the formation of “good” and “bad” event day clusters are obtained through separating the days in the “event” cluster into two with respect to the sign of the daiy order imbalances. The parameters estimates are then computed with the same procedure presented above9.
2.3.
InfoTrad package
The R package InfoTrad provides five di↵erent functions EHO(), LK(), YZ(), GAN() and EA(). The first two functions provide likelihood specifications whereas the last three functions can be used to obtain the parameter estimates for ⇥ to
7Both Gan et al. (2015) and Ersan and Alici (2016) do not mention the case where ˆµ
b < 0 (or
ˆ
µs< 0). It is fair to assume that in such cases informed investors are not present on the buy (sell)
side. Therefore, we set µb, µsequal to zero when we obtain a negative estimate.
8We also show that estimates for µ contains a significant downward bias due to poor choice of
initial parameter value µ0 when GAN algorithm is used.
9Ersan and Alici (2016) also provide an iterative process in which they systematically update
calculate the PIN in equation (2.3). All five functions require a data frame that contains Bt in the first column, and St in the second column. We create Bt and St
for ten hypothetical trading days10. EHO() and LK() read (Bt, St) and return the
related functional form of the negative log-likelihood. These objects can be used in any optimization procedure such as optim() to obtain the parameter estimates
ˆ
⇥⌘ {ˆ↵, ˆ, ˆµ, ˆ✏b, ˆ✏s}, the likelihood value and other specifications, in one iteration
with a pre-specified initial value vector, ⇥0, for parameters. We define EHO() and
LK() as simple likelihood specifications rather than functions that execute the MLE procedure. This is due to the fact that MLE estimators vary depending on the optimization procedure. Users who wish to develop alternative estimation techniques, based on the proposed likelihood factorization, can use EHO() and LK(). This is the underlying reason why those function do not have built-in optimization procedures. By specifying EHO() and LK() as simple likelihood functions, we give developers the flexibility to select the most suitable optimization procedure for their application.
For researchers who want to calculate an estimate of PIN, YZ(), GAN() and EA() functions have built-in optimization procedures. Those functions read a likelihood specification value along with data. likelihood specifications can be set either to ”LK” or to ”EHO” with ”LK” being the default. All estimation funtions use neldermead() function of the nloptr package to conduct MLE with the specified factorization. GAN() and EA() functions also use hclust() function of M¨ullner (2013) to conduct clustering. The output of these three functions is an object that provides{ˆ↵, ˆ, ˆµ, ˆ✏b, ˆ✏s, f ( ˆ⇥), [P IN} where f( ˆ⇥) represents the optimal likelihood
value given the parameter estimates ˆ⇥.
10The numbers are randomly selected. We set the numbers to be high enough so that the original
likelihood framework presented in equation (2.1) cannot be used due to FPE. Easley et al. (1996) indicate that at least 60 days worth of data is required in order to obtain proper convergence for
[
2.3.1
EHO() function
An example is provided below for EHO() with a sample data and initial parameter values. Notice that the first column of sample data is for Bt and the second column
is for St. Similarly, the initial parameter values are constructed as;
⇥ ={↵, , µ, ✏b, ✏s}. We use optim() with “Nelder-Mead” method to execute MLE,
however the developer is flexible to use other methods as well.
library(InfoTrad) # Sample Data # Buy Sell #1 350 382 #2 250 500 #3 500 463 #4 552 550 #5 163 200 #6 345 323 #7 847 456 #8 923 342 #9 123 578 #10 349 455 Buy<-c(350,250,500,552,163,345,847,923,123,349) Sell<-c(382,500,463,550,200,323,456,342,578,455) data=cbind(Buy,Sell)
# Initial parameter values
par0 = c(0.5,0.5,300,400,500)
# Call EHO function EHO_out = EHO(data)
model = optim(par0, EHO_out, gr = NULL,
method = c("Nelder-Mead"), hessian = FALSE)
## Parameter Estimates
model$par[1] # Estimate for alpha # [1] 0.9111102
model$par[2] # Estimate for delta #[1] 0.0001231429
model$par[3] # Estimate for mu # [1] 417.1497
model$par[4] # Estimate for eb # [1] 336.075
model$par[5] # Estimate for es # [1] 466.2539
## Estimate for PIN
(model$par[1]*model$par[3])/
((model$par[1]*model$par[3])+model$par[4]+model$par[5]) # [1] 0.3214394
####
In this example, Bt and St vectors are selected so that the likelihood function
cannot be represented as in equation (2.1). We set the initial parameters to be ⇥0 ={0.5, 0.5, 300, 400, 500}. For the given (Bt, St) and ⇥0, the PIN measure is
calculated as 0.32 with EHO factorization.
2.3.2
LK() function
An example is provided below for LK() with a sample data and initial parameter values. Notice that the first column of sample data is for Bt and the second column
is for St. Similarly, the initial parameter values are constructed as;
⇥ ={↵, , µ, ✏b, ✏s}. We use optim() with “Nelder-Mead” method to execute MLE,
however the developer is flexible to use other methods as well.
library(InfoTrad) # Sample Data # Buy Sell #1 350 382 #2 250 500 #3 500 463 #4 552 550 #5 163 200 #6 345 323 #7 847 456 #8 923 342 #9 123 578 #10 349 455 Buy<-c(350,250,500,552,163,345,847,923,123,349) Sell<-c(382,500,463,550,200,323,456,342,578,455) data=cbind(Buy,Sell)
# par0 = (alpha, delta, mu, epsilon_b, epsilon_s) par0 = c(0.5,0.5,300,400,500)
# Call LK function LK_out = LK(data)
model = optim(par0, LK_out, gr = NULL,
method = c("Nelder-Mead"), hessian = FALSE)
## The structure of the model output ## model #$par #[1] 0.480277 0.830850 315.259805 296.862318 400.490830 #$value #[1] -44343.21 #$counts #function gradient # 502 NA #$convergence #[1] 1 #$message #NULL
## Parameter Estimates
model$par[1] # Estimate for alpha # [1] 0.480277
model$par[2] # Estimate for delta # [1] 0.830850
model$par[3] # Estimate for mu # [1] 315.259805
model$par[4] # Estimate for eb # [1] 296.862318
model$par[5] # Estimate for es # [1] 400.4908
## Estimate for PIN
(model$par[1]*model$par[3])/
((model$par[1]*model$par[3])+model$par[4]+model$par[5]) # [1] 0.178391
####
For the given (Bt, St) and ⇥0, the PIN measure is calculated as 0.18 with LK
factorization.
2.3.3
YZ() function
An example is provided below for YZ() function with a sample data. Notice that the first column of sample data is for Bt and second column is for St. In addition,
the first example is with default likelihood specification LK and the second one is with EHO. Notice that YZ() function do not require any initial parameter vector ⇥0.
# Sample Data # Buy Sell #1 350 382 #2 250 500 #3 500 463 #4 552 550 #5 163 200 #6 345 323 #7 847 456 #8 923 342 #9 123 578 #10 349 455 Buy<-c(350,250,500,552,163,345,847,923,123,349) Sell<-c(382,500,463,550,200,323,456,342,578,455) data<-cbind(Buy,Sell)
# Parameter estimates using the LK factorization of Lin and Ke (2011) # with the algorithm of Yan and Zhang (2012).
# Default factorization is set to be "LK"
result=YZ(data) print(result)
# Alpha: 0.3999999 # Delta: 0
# Epsilon_b: 263.3333 # Epsilon_s: 424.9
# Likelihood Value: 44371.84 # PIN: 0.2004457
# Parameter estimates using the EHO factorization of Easley et. al. (2010) # with the algorithm of Yan and Zhang (2012).
result=YZ(data,likelihood="EHO") print(result) # Alpha: 0.9000001 # Delta: 0.9000001 # Mu: 489.1111 # Epsilon_b: 396.1803 # Epsilon_s: 28.72002 # Likelihood Value: Inf # PIN: 0.3321033
For the given Bt and St vectors, PIN measure is calculated as 0.20 with YZ
algorithm along with LK factorization. Moreover, PIN measure is calculated as 0.33 with YZ algorithm along with EHO factorization.
2.3.4
GAN() function
An example is provided below for GAN() function with a sample data. Notice that the first column of sample data is for Bt and second column is for St. In addition,
the first example is with default likelihood specification LK and the second one is with EHO. Notice that GAN() function do not require any initial parameter vector
⇥0. library(InfoTrad) # Sample Data # Buy Sell #1 350 382 #2 250 500 #3 500 463 #4 552 550 #5 163 200 #6 345 323 #7 847 456 #8 923 342 #9 123 578 #10 349 455 Buy<-c(350,250,500,552,163,345,847,923,123,349) Sell<-c(382,500,463,550,200,323,456,342,578,455) data<-cbind(Buy,Sell)
# Parameter estimates using the LK factorization of Lin and Ke (2011) # with the algorithm of Gan et. al. (2015).
# Default factorization is set to be "LK"
result=GAN(data) print(result)
# Delta: 0 # Mu: 442.1667 # Epsilon_b: 263.3333 # Epsilon_s: 424.9 # Likelihood Value: 44371.84 # PIN: 0.2044464
# Parameter estimates using the EHO factorization of Easley et. al. (2010) # with the algorithm of Gan et. al. (2015)
result=GAN(data, likelihood="EHO") print(result) # Alpha: 0.3230001 # Delta: 0.4780001 # Mu: 481.3526 # Epsilon_b: 356.6359 # Epsilon_s: 313.136 # Likelihood Value: Inf # PIN: 0.1884001
For the given Bt and St vectors, PIN measure is calculated as 0.20 with GAN
algorithm along with LK factorization. Moreover, PIN measure is calculated as 0.19 with GAN algorithm along with EHO factorization.
2.3.5
EA() function
An example is provided below for EA() function with a sample data. Notice that the first column of sample data is for Bt and second column is for St. In addition,
the first example is with default likelihood specification LK and the second one is with EHO. Notice that EA() function do not require any initial parameter vector ⇥0. library(InfoTrad) # Sample Data # Buy Sell #1 350 382 #2 250 500 #3 500 463 #4 552 550 #5 163 200 #6 345 323 #7 847 456 #8 923 342 #9 123 578 #10 349 455 Buy=c(350,250,500,552,163,345,847,923,123,349) Sell=c(382,500,463,550,200,323,456,342,578,455) data=cbind(Buy,Sell)
# Parameter estimates using the LK factorization of Lin and Ke (2011) # with the modified clustering algorithm of Ersan and Alici (2016).
# Default factorization is set to be "LK" result=EA(data) print(result) # Alpha: 0.9511418 # Delta: 0.2694005 # Mu: 76.7224 # Epsilon_b: 493.7045 # Epsilon_s: 377.4877 # Likelihood Value: 43973.71 # PIN: 0.07728924
# Parameter estimates using the EHO factorization of Easley et. al. (2010) # with the modified clustering algorithm of Ersan and Alici (2016).
result=EA(data,likelihood="EHO") print(result) # Alpha: 0.9511418 # Delta: 0.2694005 # Mu: 76.7224 # Epsilon_b: 493.7045 # Epsilon_s: 377.4877 # Likelihood Value: 43973.71 # PIN: 0.07728924
For the given Bt and St vectors, PIN measure is calculated as 0.08 with EA
algorithm along with LK factorization. Moreover, PIN measure is calculated, again, as 0.08 with EA algorithm along with EHO factorization.
2.4.
Simulations and Performance Evaluation
In this section, we investigate the performance of the estimates obtained for ⇥ and PIN using the existing methods. We evaluate the methods based on their accuracy proxied by mean absolute errors (MAE)11. We first examine how the estimates vary
under di↵erent trade intensity levels. To this end, we follow the methodology proposed in Gan et al. (2015). Let I be the set of trade intensity levels ranging from 50 to 5000 at a step size of 50, that is, I ={50, 100, 150, . . . , 5000}. We first set our parameters as ⇥ ={↵ = 0.5, = 0.5, µ = 0.2i, ✏b = 0.4i, ✏s = 0.4i}, where i 2 I. For
each trade intensity level, we generate N=50 random samples of ˜↵ and ˜ that are binomially distributed with parameters ↵ and , respectively. ˜↵ and ˜ proxy the content of the information event. For each pair of ˜↵, ˜ values, we generate buy and sell values (Bt, St) for hypothetical T = 60 days in the following manner;
• if ˜↵ = 0, then there is no information event, therefore, generate Bt⇠ P ois(✏b)
and St⇠ P ois(✏s).
• if ˜↵ = 1, and ˜ =1, then there is bad news, therefore generate Bt ⇠ P ois(✏b)
and St⇠ P ois(✏s+ µ)
• if ˜↵ = 1, and ˜ =0, then there is good news, therefore generate Bt ⇠ P ois(✏b+µ)
and St⇠ P ois(✏s)
We then form the joint log-likelihood function represented by equation (2.4) in EHO form or by equation (2.5) in LK form and obtain theestimates using YZ(),
11All estimations are conducted on a 2.6 Intel i7-6700HQ CPU. We do not consider speed as a
GAN() and EA() methods. The psuedo code for the first simulation method is given as follows;
Algorithm 1 Simulations under di↵erent trade intensity levels
1: Set ↵ = 0.5, = 0.5, N = 50, T = 60;
2: for i2 I do
3: Set µ = 0.2i, ✏b = 0.4i, ✏s = 0.4i;
4: Generate N observations of ˜↵⇠ Binom(↵);
5: Generate N observations of ˜⇠ Binom( ); 6: for n2 N do
7: if ˜↵[n] == 0 then
8: Generate T observations of Bt ⇠ Pois(✏b);
9: Generate T observations of St⇠ Pois(✏s);
10: else if ˜↵[n] == 1 and ˜[n] == 1 then
11: Generate T observations of Bt ⇠ Pois(✏b);
12: Generate T observations of St⇠ Pois(✏s+ µ);
13: else
14: Generate T observations of Bt ⇠ Pois(✏b + µ);
15: Generate T observations of St⇠ Pois(✏s);
16: end if
17: Call estimation function (YZ() or GAN() or EA());
18: Obtain the parameter estimates;
19: end for
20: end for
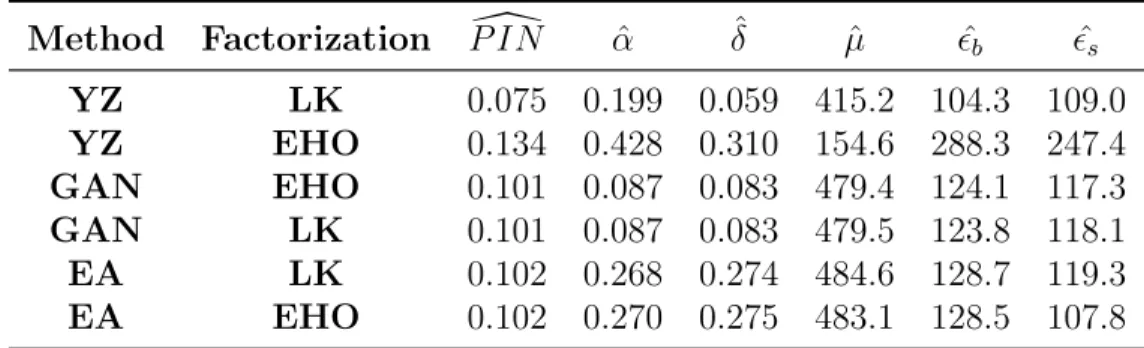
The results are presented in Table 2.112 which indicates that YZ() method with
LK() factorization provides the PIN estimates with lowest MAE. Although the clustering algorithms, especially GAN() method, provide powerful estimates of
ˆ
↵, ˆ, ˆ✏b, ˆ✏s, they fail to estimate the arrival rate of informed investors ˆµ, accurately.
This is in line with Ersan and Alici (2016). On the contrary, YZ() method with EHO() factorization provides the best estimates for ˆµ, but fails to provide good estimates for other parameters.
12This table represents the mean absolute errors (MAE) of the parameter estimates obtained by
a given method for a given factorization. Each row represents a di↵erent method with a di↵erent factorization. First two column represent the specification of method and factorization respectively. The last six columns represents the power of estimates of PIN along with the parameter space ⇥⌘ {↵, , µ, ✏b, ✏s}. MAE measures for the estimates calculated asPNi=1 |b
⇥i ⇥T Ri |
N where b⇥ represent
Table 2.1: Simulation results to examine the relationship between trade intensity and the estimates of PIN.
Method Factorization P IN[ ↵ˆ ˆ µˆ ✏ˆb ✏ˆs YZ LK 0.075 0.199 0.059 415.2 104.3 109.0 YZ EHO 0.134 0.428 0.310 154.6 288.3 247.4 GAN EHO 0.101 0.087 0.083 479.4 124.1 117.3 GAN LK 0.101 0.087 0.083 479.5 123.8 118.1 EA LK 0.102 0.268 0.274 484.6 128.7 119.3 EA EHO 0.102 0.270 0.275 483.1 128.5 107.8
A more general way of examining the accuracy of PIN estimates is proposed in several studies (e.g, Lin and Ke (2011), Gan et al. (2015), Ersan and Alici (2016)). In this setting, we fix the trade intensity, I=2500. The total trade intensity
represents the overall presence of informed and uninformed traders, that is, I=(µ, ✏b, ✏s). We then generate three probability terms p1, p2, p3 with N =5000 random
observations that are distributed uniformly between 0 and 1. p1 represents the
fraction of informed investors in total trade intensity, that is, µ=p1⇤ I. The rest of
the trade intensity is distributed equally to buy and sell orders of uninformed investors, that is, eb = es = (1 p1)⇤ I/2. p2 represents the true parameter for the
probability of news arrival, ↵, and p3 is the true parameter for the content of the
news, . We generate observations for ˜↵ and ˜, as described earlier. For each pair of ˜↵ and ˜, we generate buy and sell values (Bt, St) for hypothetical T =60 days,
again, in the manner presented above; form the likelihood and obtain the parameter estimates. The psuedo code for the second simulation method is given as follows;
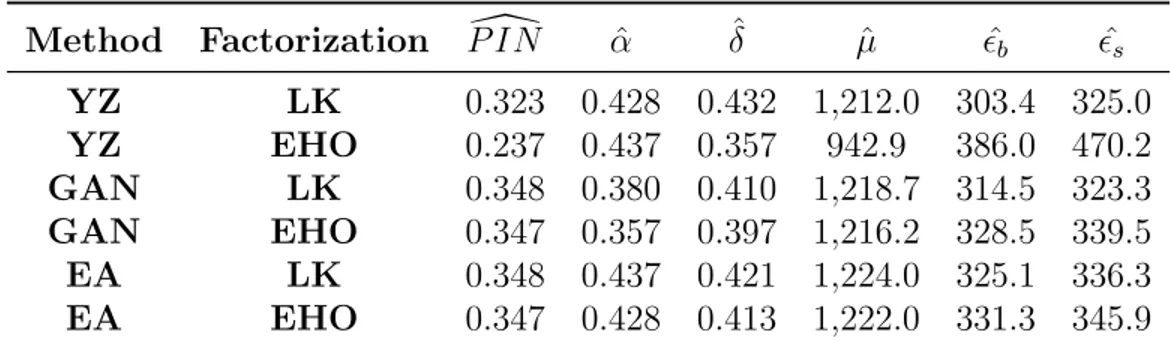
The results are presented in Table 2.213. Similar to first simulation, GAN()
13This table represents the mean absolute errors (MAE) of the parameter estimates obtained by
a given method for a given factorization. Each row represents a di↵erent method with a di↵erent factorization. First two column represent the specification of method and factorization respectively. The last six columns represents the power of estimates of PIN along with the parameter space ⇥⌘ {↵, , µ, ✏b, ✏s}. MAE measures for the estimates calculated asPNi=1 |b
⇥i ⇥T Ri |
N where b⇥ represent
Algorithm 2 A simulation to examine performance of the parameter estimates for PIN
1: Set N=5000, T=60, I= 2500;
2: Generate N observations of p1 ⇠ U(0, 1);
3: Generate N observations of p2 ⌘ ↵ ⇠ U(0, 1);
4: Generate N observations of p3 ⌘ ⇠ U(0, 1);
5: Obtain ˜↵ ⇠ Binom(↵) and ˜ ⇠ Binom( ) 8n 2 N;
6: Set µ = p1⇤ I, ✏b = ✏s = (1 p1)⇤ I/2;
7: for n2 N do
8: if ˜↵[n] == 0 then
9: Generate T observations of Bt⇠ Pois(✏b);
10: Generate T observations of St ⇠ Pois(✏s);
11: else if ˜↵[n] == 1 and ˜[n] == 1 then
12: Generate T observations of Bt⇠ Pois(✏b);
13: Generate T observations of St ⇠ Pois(✏s+ µ);
14: else
15: Generate T observations of Bt⇠ Pois(✏b+ µ);
16: Generate T observations of St ⇠ Pois(✏s);
17: end if
18: Call estimation function (YZ() or GAN() or EA()); 19: Obtain the parameter estimates;
20: end for
captures the true nature of ˆ↵ and ˆ better than any other method with both factorizations. YZ() method with EHO() factorization performs best when estimating the arrival of informed traders, ˆµ. The importance of estimating ˆµ becomes quite evident in Table 2.2. Although other methods outperform YZ() method with EHO() factorization in estimating ↵, ✏b and ✏s, it provides the best
estimate for PIN due to it’s performance on estimating ˆµ.
2.5.
Conclusion
This chapter provides a short survey on five most widely used estimation
techniques for the probability of informed trading (PIN) measure. In this chapter, we introduce the R package InfoTrad, covering estimation procedures for PIN using EHO, LK factorizations along with YZ, GAN and EA algorithms
Table 2.2: Simulation results to examine the performance of di↵erent methods in estimating the parameters for PIN.
Method Factorization P IN[ ↵ˆ ˆ µˆ ✏ˆb ✏ˆs YZ LK 0.323 0.428 0.432 1,212.0 303.4 325.0 YZ EHO 0.237 0.437 0.357 942.9 386.0 470.2 GAN LK 0.348 0.380 0.410 1,218.7 314.5 323.3 GAN EHO 0.347 0.357 0.397 1,216.2 328.5 339.5 EA LK 0.348 0.437 0.421 1,224.0 325.1 336.3 EA EHO 0.347 0.428 0.413 1,222.0 331.3 345.9
(EHO(),LK(), YZ(), GAN() EA()). The functions EHO() and LK() read a (Tx2) matrix where the rows of the first column contains total number of buy orders on a given trading day t, Bt, and the rows of the second column contains the total
number of sell orders on a given trading day t, St, where t 2 {1, 2, . . . , T }. In
addition, they also require an initial parameter vector in the form of, ⇥0 =
{↵, , µ, ✏b, ✏s}. Both functions produce the respective log-likelihood functions.
The functions YZ(), GAN() and EA() read (Bt, St) as an input along with a
likelihood specification that is set to LK by default. These functions do not require initial parameter matrix to obtain the parameter estimates when calculating PIN. All three functions use neldermead() method of nloptr as built-in optimization procedure for MLE. YZ() GAN() and EA() produce an object that gives the parameter estimates ˆ⇥ along with likelihood value and [P IN .
CHAPTER III
INFORMED TRADING, ORDER FLOW
SHOCKS AND THE CROSS SECTION OF
EXPECTED RETURNS IN BORSA ISTANBUL
3.1.
Introduction
There are conflicting views on the relationship between information risk which arises from the information asymmetry between informed and uninformed
investors, and stock returns. On one hand, Easley and O’Hara (2004) construct a rational expectations model with information asymmetry to show that uninformed investors are inferior in adjusting their portfolios quickly, in the presence of new information. Therefore, ceteris paribus, uninformed investors demand a premium for holding stocks that have high number of informed traders which in turn implies that information risk is systematic and undiversifiable. On the other hand, Hughes et al. (2007) argue that in a large economy where the number of securities is
infinite, increase in the information asymmetry yields an increase in returns for the overall market. Their claims indicate that after controlling for systematic factors, firm-specific information should not a↵ect the cross-section of expected returns and thus the risk of information asymmetry is idiosyncratic and fully diversifiable. These conflicting views have empirical implications. Easley et al. (1996)
cornerstone study that quantifies the information asymmetry for a stock trade. Easley et al. (1996) and Easley et al. (2002) derive a proxy called the probability of informed trading (PIN) which aims to measure the proportion of informed
investors. Easley et al. (1996) show that transaction costs are, on average, larger for stocks with higher PIN. Similarly, Easley et al. (2002) and Easley et al. (2010) indicate that investors demand a premium for holding stocks that have higher PIN. On the contrary, Lai et al. (2014) show that the information is not a priced risk for 47 di↵erent countries. More importantly, Duarte and Young (2009) decompose PIN into two separate components: one related to adverse selection (adjusted PIN) and the other related to stocks liquidity. They adjust the PIN by introducing the probability of systematic order flow shocks (PSOS) that enables to model the positive correlation between buy and sell order flow. Their results also indicate that PSOS is a priced risk rather than the adjusted PIN.
There is a growing literature on the role of information asymmetry on the stocks traded in the Turkish stock market, Borsa Istanbul (BIST). Aktas (2016) indicate that informed trades in BIST tend to be large in size. In addition, he shows that short sales have higher price impact compared to an average trade. Ekinci and Ersan (2018) examines the involvement of high-frequency traders (HFT) in BIST, proposing a new method to capture HFT activity. They estimate the HFT
involvement to be 1.23% in 2015 where BIST switch to BISTECH trading system, allowing HFT’s for the first time. They argue that HFT participation is generally larger for large cap stocks. Simsir and Simsek (2018) show an abnormal trading volume around the first private notification times which is right before public disclosure announcements made public in BIST. They argue that the profits from the trades right before an announcement made public can sum up to 77 million $. In the next chapter of this thesis, we examine the di↵erences in information between foreign and domestic investors. We show that local investors have a price
impact over a broader array of stocks however the foreign price impact significantly increases after June 2013 with the increased political turmoil within the country. We also show that foreign impact clusters over stocks with larger market
capitalization.
This chapter is examines the systematic relationship between information
asymmetry and stock returns in BIST. Due to the lack of studies that examine the stock mispricing and the microstructure of BIST, this paper fills an essential gap in the literature.
In this chapter, we analyze the nature of expected returns of high-PIN stocks traded in Borsa Istanbul to explore the preferences of investors towards the risk of trading with informed investors. We first examine this relationship through
Fama-MacBeth regressions (Fama and MacBeth, 1973). Besides, similar to Easley et al. (2010), we examine the behavior of PIN-sorted portfolios through
cross-sectional regressions.
Our results are in line with the theoretical expectations of Hughes et al. (2007) and the empirical findings of Lin et al. (2014). We fail to reject the hypothesis that information asymmetry is an idiosyncratic risk in BIST. Although we observe that PIN predicts next month returns, the predictive power disappears after we control for other systematic factors. Our univariate and multivariate portfolio analyses show that the investors who trade on BIST do not expect a premium for holding stocks that have high levels of information asymmetry. The results are free from any bias due to classification algorithms, floating point exception, boundary solutions and systematic order flow shocks in estimating PIN.
The structure of the paper is as follows. In the next section, we revisit the
our sample. Section 3.4 discusses the methodology. Section 3.5 presents the results and Section 3.6 concludes.
3.2.
PIN model and its extensions
Chapter II of this thesis provides a detailed survey of the PIN model and its extensions. In Chapter II, we underline the problems due to floating point exception and boundary solutions, and present the di↵erent factorization and estimation methods to overcome these problems.
The likelihood factorization presented in equation (2.2) (EKOP factorization) is prone to selection bias. Lin and Ke (2011) show that the feasible solution set for the non-linear optimization problem shrinks significantly as the daily number of buy and sell orders increases. The optimal value for the log likelihood in equation (2.2) becomes undefined, for large enough (Bt, St) whose factorials cannot be
computed by mainstream computers (floating point exception, (FPE)). Therefore, studies that use EKOP factorization may systematically exclude stocks that are actively traded.
To deal with this problem, Duarte and Young (2009) modifies the EKOP factorization by replacing exp( ✏b)
✏Btb
Bt! with exp[ ✏b+ Btln(✏b)
PBt
i=1ln(i)] and
other components of the likelihood with the similar modifications. In addition, two other factorizations that are algebraically equivalent to (2.1) are provided in order to avoid FPE. We present the first factorization (EHO factorization) of Easley et al. (2010) in equation (2.4) and the second factorization (LK factorization) of Lin and Ke (2011) in equation (2.5). Both studies modify the factorization such that Bt! and St! become constant with respect to the parameter vector ⇥ and
3.2.1
Probability of Symmetric Order-Flow Shock (PSOS)
The sequential trading model of Easley et al. (1996) enforces a negative
contemporaneous correlation between the number of buy and sell orders (B, S). Informed trading can inflate the number of buy and sell orders, separately. Duarte and Young (2009) indicate that the contemporaneous covariance between the number of buy and sell orders in PIN model is given as follows;
cov(B, S) = (↵µ)2( 1) 0 (3.1)
However, Duarte and Young (2009) argue that this aspect of the model is not observed empirically. They show a strong positive correlation between buy and sell orders and high levels of buy and sell volatility.
To account for the di↵erent levels of variance between buy and sell orders, they separate the arrival process for informed traders to place buy and sell orders from one another. They defined µb (µs) to be the arrival rate of informed traders to
place a buy (sell) order. More importantly, they allow for increased buy and sell variation along with a positive correlation between buys and sells as they define another event that causes both buy and sell order flow to increase. They called this event a symmetric order-flow shock. The probability of such an event is assumed to follow a Bernoulli distribution with parameter conditional on the absence of private information. The probability of such an event conditional on the arrival of private information is also assumed to follow a Bernoulli distribution, but with a di↵erent parameter, 0. In case of a symmetric order flow shock, the additional arrival rate of buys (sells) is defined as b ( s).
Then the parameter vector of the extended model becomes,
can then be updated as follows; f (Bt, St|⇥) ⌘ (1 ↵)(1 ) exp ⇥ ✏b+ Btlog(✏b) Bt X i=1 log(i)⇤ ⇤ exp⇥ ✏s+ Stlog(✏s) St X i=1 log(i)⇤ + (1 ↵) exp⇥ (✏b+ b) + Btlog(✏b+ b) Bt X i=1 log(i)] ⇤ exp⇥ (✏s+ s) + Stlog(✏s+ s) St X i=1 log(i)] + ↵(1 )(1 0) exp⇥ (✏b+ µb) + Btlog(✏b+ µb) Bt X i=1 log(i)] ⇤ exp⇥ ✏s+ Stlog(✏s) St X i=1 log(i)⇤ + ↵(1 ) 0 exp⇥ (✏b+ µb+ b) + Btlog(✏b+ µb + b) Bt X i=1 log(i)] ⇤ exp⇥ (✏s+ s) + Stlog(✏s+ s) St X i=1 log(i)] + ↵ (1 0) exp⇥ ✏b+ Btlog(✏b) Bt X i=1 ln(i)⇤ ⇤ exp⇥ (✏s+ µs) + Stlog(✏s+ µs) St X i=1 log(i)] + ↵ exp⇥ (✏b+ b) + Btlog(✏b + b) Bt X i=1 log(i)] ⇤ exp⇥ (✏s+ s+ µs) + Stlog(✏s+ s+ µs) St X i=1 log(i)] (3.2)
The structural model presented in equation (3.2), enables a positive covariance between buy and sell order.The probability of informed trading adjusted for the symmetric order flow shock is given by;
AdjP IN ⌘ ↵( µs+ (1 )µb)
↵( µs+ (1 )µb) + ( b+ s)(↵ 0 + (1 ↵) ) + ✏b+ ✏s
(3.3)
The probability of symmetric order flow shock (PSOS) is then given by;
P SOS ⌘ ( b+ s)(↵ 0 + (1 ↵) )
↵( µs+ (1 )µb) + ( b+ s)(↵ 0 + (1 ↵) ) + ✏b+ ✏s
(3.4)
The problem of boundary solutions are also evident for estimating PIN when DY factorization is used. To this end, we choose 10 di↵erent random starting points for (↵0, 0, 0, 00) from uniform distribution U (0, 1) for parameters that are bounded
from above and below. For parameters that are bounded only from above, (µ0
A, µ0S, ✏0A, ✏0S, 0A, 0S) we set the arrival rates to be the one third of the respective
buy and sell values within the specified period.
3.3.
Sample Formation
We collect the limit-order book for all stocks traded in BIST National Markets Listing, between March 2005 to April 2017. Our sample consists of 498 di↵erent stocks. We obtain price and accounting information from Bloomberg Terminal. We calculate the firm specific variables such as size (SIZE), book-to-market ratio (BTM), beta (BETA), illiquidity (ILLIQ), idiosyncratic volatility (IVOL), reversal (REV) and momentum (MOM) at monthly frequency as shown in the Appendix. Each order in the limit-order book contains the date, time, stock ticker, order ID, order type, quantity and price stamps. Order type enables us to track the order process for buys and sells, given a trading day. Therefore, we construct the order input matrix (Bt, St) from the actual number of buy and sell orders, as a panel
data which has trading days in the time dimension and each firm in BIST in the cross-section. We exclude all orders that arrive in the opening auction.
The observation of the actual order arrivals frees us from considering the trade initiation sequence. This freedom relieves us from choosing di↵erent trade classification algorithms to assign values for (Bt, St). The literature on the
accuracy of algorithms that classify trades as buyer or seller initiated is
inconclusive. However, all classification algorithms are shown to create some bias in BIST (Aktas and Kryzanowski, 2014). Our results presented in the next section, are therefore robust to any biases that might arise due to improper selection of trade classification algorithms.
Table 3.11 presents the descriptive statistics on the daily number of buy and sell
orders. Daily buy orders are more volatile compared to sell orders. More
importantly, there is a positive correlation between buy and sell orders for BIST stocks. We show in Table 3.1 that the minimum cross sectional correlation between buy and sell orders is 10% throughout our sample period. The average correlation is 85%. Similar to Duarte and Young (2009), we do not observe any negative correlation among buy and sell orders. This implies that the Duarte and Young (2009) extension of the PIN model which takes the probability of symmetric order flow shock into consideration, is necessary when examining the pricing implications of information asymmetry in BIST.
1This table presents the descriptive statistics for the cross-sectional distribution of the daily
number of buy and sell observations, (Bt, St) in our sample. Our sample covers all stocks that
are traded on BIST between March 2005 and April 2017, consisting 498 di↵erent stocks. For each stock, on each trading day, we compute the total number of buy and sell orders submitted to BIST from the intraday limit-order book. Then for each stock, we compute the mean and variance of the daily buy and sell orders throughout our sample period. First two columns report the descriptive statistics for the mean buy and sell values, respectively. Third and forth column report the descriptive statistics for the variance of the daily buy and sell values. Fifth column reports the descriptive statistics for the Spearman correlation coefficient between daily buy and sell orders.
Ta b le 3. 1: D es cr ip ti ve st at is ti cs on n u m b er of b u y an d se ll or d er s. St a ti st ics M e a n B uy M e a n Se ll V a ri a nce B uy V a ri a nce Se ll C o rr e la ti o n M ini m um 18.56 14.11 17.71 13.53 0.10 2 5 th P e rce n ti le 248.97 182.06 355.83 229.35 0.81 M e di a n 411.84 290.13 562.06 343.73 0.88 Mea n 521.07 398.34 733.13 487.61 0.85 7 5 th P e rce n ti le 620.56 445.17 856.33 557.30 0.92 M a x im um 4627.44 4223.77 5728.53 2945 .22 0.98
Table 3.22 reports the descriptive statistics for the PIN and PSOS estimates
calculated using the Duarte and Young (2009) factorization along with the descriptive statistics for firm specific variables. Table 3.33 gives the pair-wise correlations among firm specific variables. In line with Alkan and Guner (2018), the highest correlation is between IVOL and MAX factors with 84%. This is followed by the correlation between RETURN and MAX with 34%. The largest negative correlation is among PIN and PSOS factors.
3.4.
Methodology
3.4.1
Fama-MacBeth Regressions
To test the information asymmetry hypothesis, we estimate the cross-sectional regression presented in (3.5) in each sample month. For each month in our sample, the returns are regressed on PIN and various firm specific measures.
Ri,t+n = 0,t+ 1,tP INi,t+ 2,tBET Ai,t+ 3,tSIZEi,t+ 4,tBT Mi,t+ 5,t0Xi,t+✏i,t (3.5)
where Ri,t is the return on stock i, i2 {1 . . . 498} for holding periods of n months
after month t. We try three di↵erent holding periods, one-month, three-months, six-months, in line with Atilgan et al. (2016) and Alkan and Guner (2018). The vector Xi,t includes other firm specific factors such as MOM, MAX, IVOL, PSOS
2This table reports the descriptive statistics for monthly firm specific factors for sample stocks
that are traded in BIST between March 2005 - April 2017. RETURN represents the monthly percentage returns. BETA is the systematic risk factor. SIZE is the logarithm of the end of month market capitalization. BTM is the book-to-market ratio. MOM is the momentum variable. REV represents the reversal variable. ILLIQ is the illiquidity measure. MAX is the maximum daily return within a month. IVOL is the idiosyncratic volatility. PIN is the probability of informed trading estimated using DY factorization. PSOS is the probability of systematic order flow shocks.
3This table reports the cross-sectional correlations among time-series averages of firm-specific
factors. PIN is the probability of informed trading. PSOS is the probability of systematic order flow shocks. SIZE is the market capitalization. BETA is the market risk factor. MOM is cumulative return over the period [t-7,t-1]. MAX is the maximum daily return within the month t. IVOL is the idiosyncratic volatility. BTM is the book to market ratio. ILLIQ is the Amihud (2002) illiquidity measure.