M. SARIKAYA et al.: OPTIMIZATION OF THE PROCESS PARAMETERS FOR SURFACE ROUGHNESS ...
OPTIMIZATION OF THE PROCESS PARAMETERS FOR SURFACE
ROUGHNESS AND TOOL LIFE IN FACE MILLING USING THE
TAGUCHI ANALYSIS
OPTIMIZACIJA PROCESNIH PARAMETROV GLEDE NA
HRAPAVOST POVR[INE IN TRAJNOSTNO DOBO ORODJA PRI
^ELNEM REZKANJU Z UPORABO TAGUCHIJEVE ANALIZE
Murat Sarýkaya1, Hakan Dilipak2, Akýn Gezgin31Department of Mechanical Engineering, Sinop University, 57030 Sinop, Turkey 2Manufacturing Department, Technology Faculty, Gazi University, 06500 Ankara, Turkey 3Mechanical Education, Institute of Science and Technology, Gazi University, 06500 Ankara, Turkey
Prejem rokopisa – received: 2014-02-13; sprejem za objavo – accepted for publication: 2014-03-12
In this study, the Taguchi method, which is a powerful tool to design quality optimization, is used to find the optimum surface roughness and tool life in milling operations. An orthogonal array, a signal-to-noise (S/N) ratio, and an analysis of variance (ANOVA) are employed to investigate the tool life and the surface-roughness characteristics of AISI D3 steel. Accordingly, the lowest surface roughness and the highest tool life were estimated to be 0.436 μm and 434.1 s, respectively and, finally, the Taguchi method allowed the optimization of the system for the verification of the tests.
Further, ANOVA analysis was revealed thatthe number of cutter insert was the most important parameter influencing the surface roughness with a 75.27 %, and cutting speed was the most important parameter influencing the tool life with a 95 %.
Keywords: material machinability, face milling, Taguchi method, optimization, experimental design
V tej {tudiji je bila uporabljena Taguchijeva metoda kot mo~no orodje za ugotavljanje razmer za doseganje optimalne hrapavosti in trajnostne dobe orodja pri rezkanju. Ortogonalna matrika, signal hrupa (S/N) in analiza variance (ANOVA) so bili uporabljeni za preiskavo zdr`ljivosti orodja in hrapavosti povr{ine jekla AISI D3. Na podlagi rezultatov je bila ocenjena najmanj{a hra-pavost povr{ine 0,436 μm in najve~ja zdr`ljivost orodja 434,1 s, Taguchijeva metoda pa je omogo~ila optimizacijo sistema pri verifikaciji preizkusov.
Nadalje je ANOVA analiza odkrila, da je {tevilo rezalnih vlo`kov najbolj pomemben parameter, ki s 75,27 % vpliva na hrapa-vost povr{ine, hitrost rezanja pa je najpomembnej{i parameter, ki s 95 % vpliva na `ivljenjsko dobo orodja.
Klju~ne besede: obdelovalnost materiala, ~elno rezkanje, Taguchijeva metoda, optimizacija, na~rtovanje preizkusov
1 INTRODUCTION
Basically, milling is one of the most commonly used chip removal operations in manufacturing processes and machined parts are usually utilized to assembly with other parts in aerospace, die, medical, automotive, de-fense industry and machine design as well as in manu-facturing industries.1In addition to the cutting insert, the tool holder, workpiece material, cutting speed (V), feed rate (f), depth of cut (a) and number of milling cutting inserts are the most important cutting parameters that highly affect the performance characteristics such as tool life and surface roughness.
Generally, researchers have focused on the tool deformation, the effects of cutting-tool coatings and environmental conditions using a single insert. The costs of cutting tools are important to manufacturers. The cost factor causes lowering to the minimum level of an implementation with the least number of inserts. In contrast, the increase in the duration of the process is also a well-known factor.2The aim of this study is to find out the effects of the cutting parameters (the cutting
speed, the feed rate and the number of cutting inserts) on the surface roughness and the tool life at high cutting speeds. The roughness of machined surface is an import-ant quality indicator in machining processes and the various properties of machined parts such as corrosion, wear, friction, and heat transmission are also influenced by surface roughness.3,4Most of the process parameters like spindle speed, feed rate, number of insert, depth of cut, tool holder geometry, cutting insert geometry, tool material, cooling condition affect the tool life and surface roughness. Thus, it is difficult to define a general model for tool life and surface roughness.5 Some stati-stical methods like Taguchi, Response Surface Methodo-logy (RSM), desirability functional analysis, ANOVA and Grey Relational Analysis (GRA) have been applied for optimization and analysis of process parameters. The optimization using Taguchi method has revealed a unique and powerful optimization tool that differs from traditional applications.6 For instance, Kivak et al.7 studied the optimization of drilling parameters based on the Taguchi method to minimize the surface roughness (Ra) and thrust force (Ff). Their study showed that the
cutting tool was the most significant parameter for the
Ra. Moreover, the results of verification test demon-strated the Taguchi method for drilling operations was successful to obtain the better surface quality of the machined parts. Aslan et al.8 evaluated the R
a and cutting-tool wear during the machining of AISI 4140 (63 HRC) steel with an experiment according to the Taguchi’s L27orthogonal array. From the ANOVA table, it was found out that tool wear is affected by cutting speed with 30 %. They suggested a 250 m/min cutting speed, a 0.25 mm depth of cut and a 0.05 mm/r feed rate to minimize the Ravalue. Gunay and Yucel9investigated the Raduring the machining of high-alloy white cast iron with an experiment according to the Taguchi L18 orthogonal array. According to ANOVA data, they explained that the most important parameter was feed rate for Ni-Hard with 62 HRC although the cutting speed was the most important parameter for Ni - Hard with 50 HRC.
Neseli et al.10studied the influence of the tool geome-try on the surface finish when turning the AISI 1040 steel with an Al2O3/TiC tool using the response-surface methodology (RSM). Their results indicated that the tool-nose radius was the dominant factor for the surface roughness with a 51.45 % contribution to the total vari-ability of the model.
Asilturk and Akkus11applied the Taguchi method to minimize the surface roughness, which is Ra and Rz, in turning of hardened AISI 4140 steel (51 HRC) using coated carbide tools. In addition, their study explored the effects of the cutting speed, the feed rate and the depth of cut on the responses. From the ANOVA analysis, it was determined that the feed rate was the most significant parameter on results. Further, it was seen that the opti-mum machining parameters for Raand Rzwere different. Kacal and Gulesin12optimized the machining parameters for the finish turning of austempered cast iron (GJS-400-15). Their experimental investigation was con-ducted based on Taguchi’s L18 orthogonal array. Stati-stical analysis, which was ANOVA,
demonstrated
that feed rate is the most important factor with 69.5 % for surface roughness (Ra). In addition, they identified the best machining parameters for Rato be: an austempering temperature of 290 °C, a ceramic tool, a cutting speed of 800 m/min and a feed rate of 0.05 mm/r.Sarikaya and Gullu13studied the Taguchi design and a response-surface-methodology-based analysis of the machining parameters for CNC turning under MQL. It was found that the most effective parameter for the sur-face roughness is the feed rate. In addition, the cooling conditions also significantly affect the surface roughness. Kadirvel and Hariharan14investigated the optimization of the die-sinking micro-edm process for multiple perfor-mance characteristics using the Taguchi-based grey rela-tional analysis. Their study indicated that, on the basis of a confirmation test, the improvement in the performance characteristics was found to be as follows: MRR 3.86 %,
TWR 4.20 % and SR 3.51 %. Kivak15 investigated the Taguchi-method-based optimization of drilling para-meters when drilling the AISI 316 steel with a PVD monolayer- and multilayer-coated HSS drills. The analysis results revealed that the feed rate was the dominant factor affecting the surface roughness and the cutting speed was the dominant factor affecting the flank wear. Koklu16 investigated the influence of the process parameters and the mechanical properties of aluminum alloys on the burr height and the surface roughness in dry drilling using the Taguchi method. The analysis of variance and Taguchi techniques were applied in order to determine the effects of the drilling parameters.
The literature survey demonstrates that traditional experimental design procedures are too complicated and not easy to use. A large number of experimental tasks have to be performed when the number of process para-meters increases. The Taguchi method uses a special design of orthogonal arrays to study the entire parameter space with only a small number of experiments for solv-ing this problem.11
The purpose of this study is to obtain the optimum milling parameters (the cutting speed, the feed rate, the number of cutting inserts) for the minimum surface roughness and the maximum tool life during the milling of AISI D3 steel. The Taguchi parameter-design app-roach was employed to achieve these goals. Moreover, a statistical analysis (ANOVA) was carried out to see which machining parameter is statistically significant. Finally, confirmation tests were conducted using the optimum cutting conditions determined with the Taguchi optimization method.
2 EXPERIMENTAL PROCEDURE 2.1 Milling experiments
In this study, AISI D3 cold-work tool steel was used as the workpiece material. This steel type is used in many manufacturing industries such as the ones manu-facturing cold-extrusion and drilling moulds, mould plates, powder-metallurgy kits, ceramic shaping moulds and cold punches. The dimensions of the workpiece were 100 mm × 48 mm × 300 mm. The chemical composition of the work material is as follows: 1.938 % C; 0.37 % Si; 0.22 % Mn; 10.66 % Cr; 0.22 % Ni; 0.135 % V; 0.062 % W; 0.07 % Cu; 85.82 % Fe. The milling tests were per-formed using a Johnford VMC 550 model, a three-axis CNC vertical machine centre, equipped with the maxi-mum spindle speed of 8000 r/min and a 10 kW drive motor. The values of process parameters were selected from the manufacturer’s handbook recommended and the preliminary experiments for the tested material. Process parameters and their levels are shown in Table 1. In all the experiments, the depth of cut was determined as 1 mm. The experiments were carried out under dry cutting conditions. To protect these experiment conditions for each test, a new cutting insert was used for each
experi-ment. The flowchart for the optimization of the milling parameters is shown in Figure 1. In the milling
experi-ments, the coated carbide inserts manufactured by Mitsu-bishi Carbide were used. Based on the ISO description, they create a SEMT 13T3AGSN tool geometry and a JM-chip-breaker form. In the experiments, the ASX445-080A06R model of the tool holder was used. The geometry of the cutting tool is shown in Figure 2. The geometric features of the tools are listed Table 2.
2.2 Measurements
One of the most important quality indicators of the machined parts is surface roughness or surface quality. According to the standard, the average surface roughness is defined as Ra. In present work, Rawas determined by using a Mahr Perthometer M1 with a cut-off length of 0.8 mm and a sampling length of 5 mm based on ISO 4287 standard. It was considered by measuring the mean of the three roughness results performed from different locations on the workpiece.
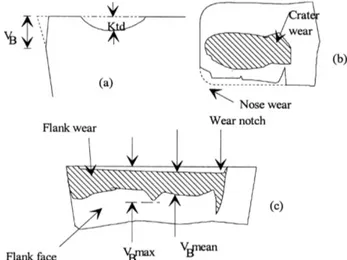
Generally, the cutting tool-wear occurs in combina-tion with the predominant wear mode, dependent upon the cutting parameters, cooling/lubrication conditions, workpiece material, cutting tool material and the tool insert geometry. The forms of the cutting-tool wear,
Figure 3:Conventional features of tool-wear measurements17 Slika 3:Obi~ajne meritve obrabe orodja17
Figure 2:Cutting tool employed in the experiments Slika 2:Rezalno orodje, uporabljeno pri preizkusih Table 1:Chosen factors and their levels
Tabela 1:Izbrani faktorji in njihovi nivoji
Symbol Cutting parameter Levels for surface roughness Levels for tool life
1 2 3 1 2 3
A Cutting speed, V/(m/min) 80 120 180 416 500 600
B Feed rate, f/(mm/r) 0.08 0.12 0.18 0.08 0.1 0.125
C Number of cutting inserts, z 1 3 6 1 3 6
Table 2:Standard tool holder and cutting insert Tabela 2:Standardno dr`alo orodja in rezalnega vlo`ka
Standard tool holder Standard cutting insert ASX445-080A06R SEMT13T3AGSN-JM
D/mm d/mm L/mm Z aa/mm D1/mm) S1/mm) F1/mm) Re/mm
80 27 50 6 6 13.4 3.97 1.9 1.5
Figure 1:Flowchart for optimization of milling parameters Slika 1:Diagram poteka optimizacije parametrov rezkanja
often expressed as the principal types of the tool wear are nose, flank, notch and crater wear types, and Figure 3shows how these wear features are usually measured.17 In the present work, tool deformations were measured and investigated using a Mitutoyo light microscope with a 0.001 mm sensitivity and a capability of magnifying 5 to 10 fold. The experiments revealed that the notch wear was observed during the machining at high cutting speeds. The determination of the machining time was based on ISO 2688-1. When determining the tool life,
VBmaxwas taken as 1 mm. The flank wear on the cutting tools was periodically measured and recorded to deter-mine the tool life.
2.3 Control factors and orthogonal array
The cutting speed V (m/min), feed rate f (mm/r) and number of cutting inserts (z) were selected as the control factors for the surface-roughness and tool-life values, and their levels were determined as shown in Table 1. The orthogonal array (OA) enables an effective tool to conduct the test with the small number of studies in the Taguchi experimental method. The total degree-of-free-dom (DFT) is the basis of orthogonal array for experi-mental design.18In present work, because there are three
control factors and three levels, the DFT is given as twenty-six. In order to make the performance com-parisons between control factors and its different combinations, an OA having at least nine or twenty-seven test trials (DFT+ 1) shoud be selected. Therefore, the standard L27(33) OA is selected for the study and the surface-roughness and tool-life values are measured via the experimental design for each combination of the control factors. Determination of the quality characteri-stics of the measured control factors is provided by the
S/N ratios.
3 RESULTS AND DISCUSSIONS
3.1 Analysis of the signal-to-noise (S/N) ratio
With the Taguchi method we used the signal-to-noise (S/N) ratio as the quality characteristic of choice. In milling operations, a lower surface roughness and larger tool life are indications of a better performance. There-fore, in order to obtain the optimum machining perfor-mance, the smaller-the-better (Equation 1) and larger-the-better (Equation 2) ratios were selected for the minimum surface roughness and maximum tool life, respectively:
Table 3:Experimental results, means and corresponding S/N ratios Tabela 3:Eksperimentalni rezultati, povpre~ja in ustrezna razmerja S/N
Exp. No.
Cutting-parameter level Measured surface roughness, Ra/ìm Calculated (S/N)/dB Measured tool life, T/s Calculated, (S/N)/dB A Cutting speed, V/(m/min) B Feed rate, f/(mm/r) C Number of inserts, z 1 1 1 1 0.160 15.9176 435 52.7698 2 1 1 2 0.582 4.7015 426 52.5882 3 1 1 3 1.079 –0.6604 403 52.1061 4 1 2 1 0.383 8.3360 401 52.0629 5 1 2 2 0.784 2.1137 365 51.2459 6 1 2 3 1.194 –1.5401 338 50.5783 7 1 3 1 0.586 4.6420 369 51.3405 8 1 3 2 1.109 –0.8986 354 50.9801 9 1 3 3 1.400 –2.9226 328 50.3175 10 2 1 1 0.206 13.7227 266 48.4976 11 2 1 2 0.723 2.8172 236 47.4582 12 2 1 3 1.084 –0.7006 233 47.3471 13 2 2 1 0.456 6.8207 231 47.2722 14 2 2 2 0.869 1.2196 222 46.9271 15 2 2 3 1.261 –2.0143 193 45.7111 16 2 3 1 0.724 2.8052 216 46.6891 17 2 3 2 1.160 –1.2892 210 46.4444 18 2 3 3 1.409 –2.9782 167 44.4543 19 3 1 1 0.303 10.3711 118 41.4376 20 3 1 2 0.708 2.9993 110 40.8279 21 3 1 3 1.104 –0.8594 100 40.0000 22 3 2 1 0.552 5.1612 102 40.1720 23 3 2 2 0.945 0.4914 97 39.7354 24 3 2 3 1.290 –2.2118 86 38.6900 25 3 3 1 0.761 2.3723 97 39.7354 26 3 3 2 1.211 –1.6629 91 39.1808 27 3 3 3 1.449 –3.2214 82 38.2763
Smaller–the–better: S N n yi i n =− ⎛⎝⎜ ⎞ ⎠ ⎟ =
∑
10 10 1 2 1 log (1) Larger–the–better: S N n i yi n =− ⎛ ⎝ ⎜ ⎞ ⎠ ⎟ =∑
10 10 1 12 1 log (2)Here, yiis the ith measure of the experimental results
in a run/row and n gives the number of measurements in each trial/row test.
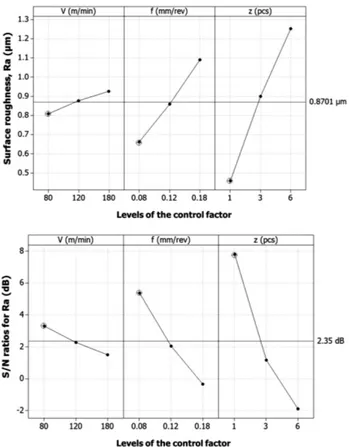
The S/N ratios for the surface roughness and tool life were calculated using Equations 1 and 2, as shown in Table 3. The milling parameters were divided by consi-dering different levels and possible effects, according to the selected orthogonal array. According to the experi-mental results, the mean of the surface roughness was 0.8701 μm and its mean S/N ratio was 2.353 dB. The mean value of tool life and its mean S/N ratio were also calculated as 232.4 s, and 46.031 dB, respectively. Further, the effects of input parameters on the responses can be analyzed with help of S/N ratios. These effects are defined and evaluated according to the total mean values of the experimental-trial results or S/N ratios. The mini-mum surface-roughness and the maximini-mum tool-life values can be calculated from the total mean values of the experimental-trial results for the surface roughness and tool life. An important requirement when calculating the optimum points is to identify the optimum levels of machining parameters. They were defined by assessing different levels of the input parameters, based on the results from combinations produced by the OA. The levels of the control factors were determined for both the surface roughness and tool life, presented in Table 4, and
S/N graphics of these levels were used for the evaluation
(Figures 4 and 5). As shown in Figure 4, the surface roughness is found to be minimal at low cutting speed and feed rate and the minimum number of cutting inserts. The surface roughness increases with a rise in the cutting speed for a given value of the feed rate. Since the temperature increases between the tool material and the workpiece material through the friction under higher cutting speed, the cut chips by the cutting tool stick over the cutting insert with help of the high temperature.19 Therefore, the surface roughness increases during the experiments at higher cutting speeds. The increased feed
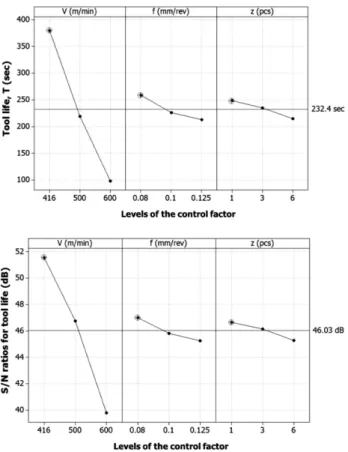
rate and number of cutting inserts lead to vibration, generating more heat and, thereby, a higher surface roughness occurs.20The tool life based on the wear value of VBmax = 1 mm for all the experiments is drawn. According to Figure 5, the longest tool life was obtained at the lowest values of the cutting speed, feed rate and number of cutters. When Figure 5 is evaluated, it is possible to observe that an increased number of cutting inserts leads to a decreased tool life. This can be explained with the cutting temperature and the vibrations generated at the tool/chip contact when the number of cutting inserts is increased. It is known that a high cutt-ing temperature occurs in the primary deformation zone
Table 4:Response table for S/N ratios (dB) and means
Tabela 4:Tabela odzivov (dB) za razli~na razmerja S/N in za razli~na sredstva
Control factors
Surface roughness (Ra) Tool life (T)
Level 1 Level 2 Level 3 Delta Level 1 Level 2 Level 3 Delta
S/N ratios A 3.30 2.26 1.49 1.80 51.55 46.76 39.78 11.77 B 5.37 2.04 –0.35 5.72 47.00 45.82 45.27 1.73 C 7.79 1.16 –1.90 9.69 46.66 46.15 45.28 1.39 Means A 0.81 0.88 0.92 0.12 379.89 219.33 98.11 281.78 B 0.66 0.86 1.09 0.43 258.56 226.11 212.67 45.89 C 0.46 0.90 1.25 0.79 248.33 234.56 214.44 33.89
Figure 4:Main effects plot of the factors and S/N graph for the sur-face roughness
Slika 4: Prikaz glavnih faktorjev in odvisnost S/N od hrapavosti povr{ine
with the increasing cutting speed. Thus, the wear mecha-nisms are accelerated and so the tool life is decreased.
The S/N ratios of the surface-roughness data obtained from the experimental work, later used to determine the optimum level of each variable, were calculated in Table 3. Figure 4 illustrates the graphs of the S/N ratios that were calculated for the surface roughness. As mentioned above, the maximum value of the S/N ratios gives the optimum cutting conditions. Thus, the optimum combi-nation for the Ra was determined as A1B1C1 (A1 = 80
m/min, B1= 0.08 mm/r, C1= 1 cutting insert). The S/N ratios for the tool-life data obtained from the experi-mental results were calculated in Table 3. Figure 5 illustrates the graphs of the S/N ratios that were calculated for the tool life. The optimum combination for the tool life was determined as A1B1C1(A1= 416 m/min,
B1= 0.08 mm/r, C1= 1 cutting insert).
3.2 Analysis of variance (ANOVA)
The Taguchi method was used for determining the optimum cutting conditions according to the S/N ratio, while the control-factor correlation with the experimen-tal results was determined with the help of an analysis of variance (ANOVA). The analysis of variance (ANOVA) was employed through the Minitab 16.0 Program. Table 5shows the results of ANOVA for the surface roughness and tool life. In addition to the degree of freedom, the mean of squares (MS), the sum of squares (SS), the
F-ratio, P-values and the contribution (PCR) associated
with each factor were presented. This analysis was per-formed for a confidence level of 95 %. The importance of the input parameters in ANOVA analysis was identi-fied by comparing the F-values of each input parameters. The F-value determined in the ANOVA table was compared with the value according to standard F-tables for a given statistical level of importance.21According to the ANOVA table, the P-value is effective for all three levels at the reliability level of 95 %, because the results for the surface roughness and tool life are lower than 0.05. As the results of the evaluation of the surface roughness, the percentage contributions of input para-meters for A, B and C were determined as: (1.63, 21.96 and 75.27) %, respectively, and the error was 1.14 % (Table 5). Thus, it was found that the number of cutting inserts and the feed rate vary significantly more than the cutting speed regarding the surface roughness in milling the AISI D3 steel. The ANOVA table indicates that the variable most significantly affecting the surface-rough-ness value is the number of cutting inserts with 75.27 % of PCR. This result clearly shows the effects of the
Table 5:Results of ANOVA for responses Tabela 5:Rezultati ANOVA-odzivov
Variation of source Degree of freedom (DF) Sum of squares (SS) Mean of squares (MS) F-ratio P-value Contribution (%) Surface roughness (Ra) A 2 0.06141 0.03071 14.26 0.000 1.63 B 2 0.82931 0.41466 192.53 0.000 21.96 C 2 2.84270 1.42135 659.97 0.000 75.27 Error (e) 20 0.04307 0.00215 1.14 Total 26 3.77650 100 Tool life (T) A 2 359615 179807 975.62 0.000 95.00 B 2 10018 5009 27.18 0.000 2.65 C 2 5228 2614 14.18 0.000 1.38 Error (e) 20 3686 184 0.97 Total 26 378547 100
Figure 5:Main effects plot of the factors and S/N graph for the tool life
Slika 5: Prikaz glavnih faktorjev in odvisnost S/N od zdr`ljivosti orodja
number of cutting inserts on the surface roughness in milling the AISI D3 steel whose vibration generated a higher frequency between the tool and the workpiece with the increasing number of cutting inserts. The other variable that has an effect on the Rais the feed rate with 21.96 % of PCR. It is known that an increasing feed rate increases the chip volume removed per unit time.7 Accordingly, Table 5 shows that the percentage contributions of factors A, B, and C for the tool life are (95.00, 2.65 and 1.38) %, respectively, and the error is 0.97 %. Thus, Table 5 indicates that the most effective variable for the tool life is the cutting speed (95.00 %). The feed rate and number of cutting inserts do not affect the tool life. In milling operations, the cutting speed is the most effective cutting parameter, reducing the tool life, because an increasing cutting speed increases the cutting temperature in the primary deformation zone. As a result of this situation, the wear mechanisms are accelerated.
3.3 Verification experiments
In the last step of the Taguchi approach, the optimi-zation was confirmed via verification tests then the deter-mination of the parameter levels giving the optimum results. The verification-test results were obtained for the optimum parameter levels (A1B1C1) of the surface roughness. Later, the calculation of the predicted mini-mum surface roughness Rapfrom Equation 3, taking into consideration individual effects of factors A, B, C and their levels, is as follows:
Rap =TRe+(A1−TRe) (+ B1−TRe) (+ C1−TRe) (3) where A1 is the mean (0.81 μm) of the experimental
trials at the first level of factor A. B1is the mean (0.66
μm) of the experimental trials at the first level of factor
B. C1is the mean (0.46 μm) of the experimental trials at
the first level of factor C. With Equation 3, the mini-mum surface roughness was calculated as 0.147 μm. As determined in Figure 5, A, B, C and their levels were used for the calculation of the predicted optimum tool life. The equation for the predicted optimum tool life is as follows:
Tp =TT+(A1−TT) (+ B1−TT) (+C1−TT) (4) where A, B and C are the means (379.89, 258.56 and 248.33) s of the experimental trials at the optimum levels of these factors. With Equation 4, the maximum tool life was calculated as 441.67 s. The confidence interval (CI) was conducted to confirm the output para-meters of the verification test. The CI for the estimated optimum results was calculated using the following equation:22 CI F V n r = ⋅ ⋅⎛ + ⎝ ⎜ ⎞ ⎠ ⎟ a ; ;1 1 1 Ve ep eff (5) where, with respect to Fa;1;Ve, F is the ratio of signifi-cant level a, a is the significance level, 1 – a is the
confidence level and Veis the degree of freedom of the
pooled error variance. Vepis the pooled error variance, r
is the number of repeated trials (r¹), N is the total num-ber of experimental trials, neffis the number of effective
measured results defined as22:
n N b
eff =1+ (6)
where b is total degress of freedom associated with items used in estimate.
In the present investigation, three verification tests (r = 3) were made to assess the performance of the experi-mental study used for the surface roughness at optimum parameters (A1B1C1). The value of Fa;1;Ve= 4.30 which has a 95 % confidence level for the surface roughness, was found with respect to the values ofa = 0.05 and Ve= 20, based on the look-up table. According to Equations 5 and 6, the confidence interval (CI) is calculated as 0.07. The result value of the confirmation test performed for the surface roughness is expected to be in the confidence interval of (0.147 ± 0.07) or (0.077 – 0.217) with a 95 % confidence level.
In the present work, the values of the surface rough-ness from the three confirmation tests performed with regard to the optimum levels (A1B1C1) were measured as (0.159, 0.162 and 0.168) μm. As shown in Table 6, the mean of the measurements was 0.163 μm. The mean result of the confirmation tests in the optimum condi-tions is within the confidence interval (0.077 < 0.163 < 0.217). As the mean result falls within this limit, the experiment is considered satisfactory. The optimization of process parameters was achieved using the Taguchi method for the surface roughness at the confidence level of 95 %.
Three confirmation experiments were carried out under the optimum conditions (A1B1C1) for the tool life. The value of Fa;1;Ve= 4.30 which has a 95 % confidence level for the tool life, was found with respect to the values of a = 0.05, and Ve = 20, based on the look-up table. According to Equations 5 and 6, the confidence interval (CI) is calculated as 21.4 s. The result value of the confirmation test performed for the tool life is expected to be in the confidence interval of (441.7 ± 21.4) or (420.3 – 463.1) with a 95 % confidence level. In this study, the values of the tool life from the three con-firmation tests performed with regard to the optimum levels (A1B1C1) were measured as (440.2, 436.4 and 425.7) s. As shown in Table 7, the mean of the measure-ments was 434.1 s. The mean result of the confirmation tests in the optimum condition is within the confidence interval (420.3 < 434.1 < 463.1). As the mean result falls within this limit, the experiment is considered satisfac-tory. The optimization of the process parameters was achieved using the Taguchi method for the tool life at the confidence level of 95 %. According to the optimum test and the predicted combination, the comparisons of the surface roughness and tool life, and the combinations
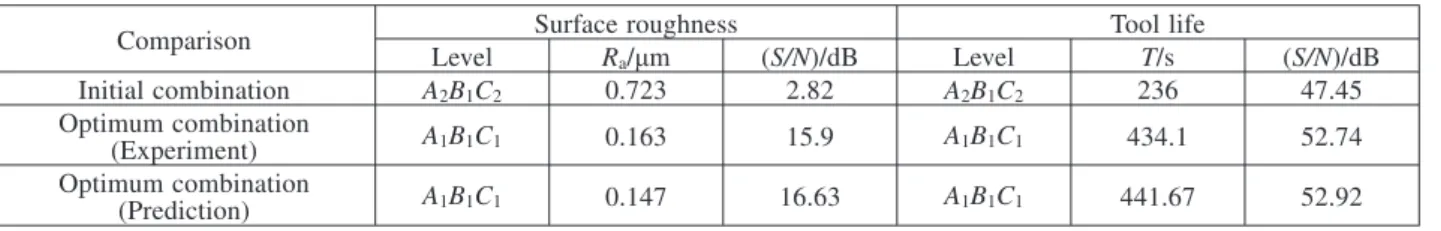
(A2B1C2) selected in the twenty-seven initial trials are given in Table 6. According to the comparison table, the surface roughness and tool life are reduced from 0.723 μm to 0.163 μm, and from 236 s to 434.1 s, respectively. The improved efficiency due to the optimum combina-tion was increased for the surface roughness and tool life by up to 77.45 % ((0.723 – 0.163)/0.723) and by up to 45.63 % ((434.1 – 236)/434.1), respectively. The perfor-mance comparisons between the initial parameters and the optimum conditions are given in Table 6. In addition to, the quality losses are listed in Table 7.
The quality losses between the initial and optimum combinations for both the surface roughness and tool life are calculated as follows18:
L y L y n opt int ( ) ( )≈ ⎛⎝⎜ ⎞ ⎠ ⎟ 1 2 3 Δ (7) where Lopt(y) and Lint(y) are the optimum and initial
combinations, respectively.Dnis the difference between
the S/N ratios for the optimal and initial combinations. The differences between S/N ratios that can be used to evaluate the quality loss of the optimum combination for the surface roughness and tool life, were found to be 13.08 (Dn= 13.08 (= 15.9 – 2.82)) and 5.29 (Dn = 5.29
(52.74 – 47.45)), respectively. The quality loss was cal-culated as 0.049 using Equation 7 for the surface rough-ness. Thus, the quality loss of the surface roughness for the optimum combination is only 4.9 % of the initial combination. Therefore, the quality losses of the surface roughness were reduced to 95.1 % through the Taguchi application. The quality loss for the tool life was cal-culated as 0.295, using Equation 7. The quality loss of the tool life for the optimum combination is only 29.5 % of the initial combination. Consequently, the quality losses of the tool life were reduced to 70.5 % through the Taguchi method.
4 CONCLUSIONS
This study focuses on the Taguchi method used for investigating the influence of the cutting parameters on the surface roughness and tool life when face milling the AISI D3 steel. In the milling experiments, different levels of the cutting speed, the feed rate and the number of cutting inserts as the machining parameters are used under dry cooling conditions. The experimental results were evaluated using the analysis of the signal-to-noise ratio, the main effect graphs of means and ANOVA. The optimum operating parameters are determined using the Taguchi method. The results can be drawn as follows:
The optimum levels of the control factors providing a better surface roughness and tool life were: A1(the cutt-ing speed, 80 m/min), B1(the feed rate, 0.08 mm/r), and
C1(the number of cutting inserts, 1 insert), and A1(the cutting speed, 416 m/min), B1(the feed rate, 0.08 mm/r),
C1(the number of cutting inserts, 1 insert), respectively. The effects of the process parameters on the surface roughness and tool life were detected by ANOVA anal-ysis. It was revealed that the number of cutting inserts the most important parameter influencing the surface roughness with 75.27 %. Further, cutting speed was the most important parameter influencing the tool life with 95 %.
Through the confirmation experiment, the surface roughness was obtained, with one of the initial combina-tions, as 0.723 μm, and the surface roughness was improved to 77.45 %. The tool life was obtained, with one of the initial combinations, as 236 s, and it was im-proved to 45.63 %. The quality losses for the surface roughness and the tool life determined from optimum points were calculated as 4.9 % and 29.5 %, respectively. The confirmation-experiment results indicated that the observed values were within the calculated confi-dence interval (CI) for the conficonfi-dence level of 95 %.
Table 6:Comparisons of surface roughness and tool life Tabela 6:Primerjave hrapavosti povr{ine in zdr`ljivosti orodja
Comparison Surface roughness Tool life
Level Ra/ìm (S/N)/dB Level T/s (S/N)/dB Initial combination A2B1C2 0.723 2.82 A2B1C2 236 47.45 Optimum combination (Experiment) A1B1C1 0.163 15.9 A1B1C1 434.1 52.74 Optimum combination (Prediction) A1B1C1 0.147 16.63 A1B1C1 441.67 52.92
Table 7:Comparisons of experimental trials Tabela 7:Primerjave eksperimentalnih poskusov
Comparison Surface roughness Tool life
Level Ra/ìm Quality loss Level T/s Quality loss
Initial combination A2B1C2 0.723 – A2B1C2 236 –
Optimum combination
(Prediction) A1B1C1 0.147±0.07 – A1B1C1 434.1±21.4 Optimum combination
The present work demonstrates to industrial users how to apply the Taguchi parameter design for opti-mizing the machining performance with a minimum cost and time in milling the AISI D3 steel. Moreover, this study considered other factors (the cutting speed, the feed rate, the number of cutting inserts) to find how the control factors affect the surface roughness and tool life. Future works may be extend to analyzing the effects of some additional variables such as different tool holders, tool materials, workpiece materials and cooling condi-tions (wet, HPC, MQL, cryogenic, etc.).
5 REFERENCES
1T. S. Lee, Y. J. Lin, A 3D predictive cutting force model for end
milling of parts having sculptured surfaces, Int. J. Adv. Manuf. Tech., 16 (2000), 773–783
2H. Dilipak, A. Guldas, A. Gezgin, An investigation of the number of
ýnserts effect on the machining time and metal removal rate during the milling of AISI D3 steel at high cutting speeds, Journal of Me-chanical Engineering, 55, (2009) 7–8, 438–443
3E. Kabakli, M. Bayramoðlu, N. Geren, Evaluation of the surface
roughness and geometric accuracies in a drilling process using the Taguchi analysis, Mater. Tehnol., 48 (2014) 1, 91–98
4H. Durmuº, Optimization of multi-process parameters according to
the surface quality criteria in the end milling of the AA6013 alumi-num alloy, Mater. Tehnol., 46 (2012) 4, 383–388
5S. Tamas, Cutting force modeling using artificial neural networks,
Journal of Materials Processing Technology, 92 (1999), 344–349
6M. S. Phadke, Quality engineering using robust design, Prentice
Hall, Englewood Cliffs, New Jersey 1989
7T. Kivak, G. Samtas, A. Cicek, Taguchi method based optimisation
of drilling parameters in drilling of AISI 316 steel with PVD monolayer and multilayer coated HSS drills, Measurement, 45 (2012), 1547–1557
8E. Aslan, N. Camuscu, B. Birgoren, Design optimization of cutting
parameters when turning hardened AISI 4140 steel (63 HRC) with Al2O3 + TiCN mixed ceramic tool, Mater. Des., 28 (2007), 1618–1622
9M. Gunay, E. Yucel, Application of Taguchi method for determining
optimum surface roughness in turning of high-alloy white cast iron, Measurement, 46 (2013), 913–919
10S. Neseli, S. Yaldýz, E. Turkes, Optimization of tool geometry
para-meters for turning operations based on the response surface metho-dology, Measurement, 44 (2011) 3, 580–587
11I. Asilturk, H. Akkus, Determining the effect of cutting parameters
on surface roughness in hard turning using the Taguchi method, Measurement, 44 (2011), 1697–1704
12A. Kacal, M. Gulesin, Determination of optimal cutting conditions in
finish turning of austempered ductile iron using Taguchi design method, J. Sci. Ind. Res. India, 70 (2011), 278–283
13M. Sarikaya, A. Gullu, Taguchi design and response surface
metho-dology based analysis of machining parameters in CNC turning under MQL, Journal of Cleaner Production, 65 (2014), 604–616
14A. Kadirvel, P. Hariharan, Optimization of the die-sinking
micro-edm process for multiple performance characteristics using the Taguchi-based grey relational analysis, Mater. Tehnol., 48 (2014) 1, 27–32
15T. Kivak, Optimization of surface roughness and flank wear using the
Taguchi method in milling of Hadfield steel with PVD and CVD coated inserts, Measurement, 50 (2014), 19–28
16U. Koklu, Influence of the process parameters and the mechanical
properties of aluminum alloys on the burr height and the surface roughness in dry drilling, Mater. Tehnol., 46 (2012) 2, 103–108
17D. E. Dimla Sr., P. M. Lister, On-line metal cutting tool condition
monitoring I: force and vibration analyses, International Journal of Machine Tools & Manufacture, 40 (2000), 739–768
18Y. T. Liu, W. C. Chang, Y. A. Yamagata, A Study on optimal
com-pensation cutting for an aspheric surface using the Taguchi method, CIRP Journal of Manufacturing Science and Technology, 3 (2010), 40–48
19V. Savas, C. Ozay, Analysis of the surface roughness of tangential
turn-milling for machining with end milling cutter, Journal of Mate-rials Processing Technology, 186 (2007), 279–283
20I. Korkut, M. Kasap, I. Ciftci, U. Seker, Determination of optimum
cutting parameters during machining of AISI 304 austenitic stainless steel, Materials and Design, 25 (2004), 303–305
21J. Antony, D. Preece, Understanding, Managing and Implementing
Quality, Frameworks Techniques and Cases, Routledge, London 2002
22R. K. Roy, Design of Experiments Using the Taguchi Approach,