Electrospun Fe
2
O
3
Entrenched SiO
2
Supported N and S Dual
Incorporated TiO
2
Nano
fibers Derived from Mixed Polymeric
Template/Surfactant: Enriched Mesoporosity within Nano
fibers,
E
ffective Charge Separation, and Visible Light Photocatalysis
Activity
Amaresh C. Pradhan*
,†and Tamer Uyar*
,†,‡†Institute of Materials Science & Nanotechnology, Bilkent University, Ankara, 06800, Turkey
‡Department of Fiber Science and Apparel Design, College of Human Ecology, Cornell University, Ithaca, New York 14853, United States
*
S Supporting InformationABSTRACT: Theα-Fe2O3promoted and SiO2supported N and S dual incorporated TiO2 nanofibers (FeSiNST NFs) along with neat oxide NFs have been synthesized by electrospinning via sol−gel. The keen approach is that mixed polyvinylpyrrolidone (PVP) as template and cetyl-trimethylammonium bromide (CTAB) as surfactant are responsible for the creation of mesoporosity within NFs.
The photoluminescence (PL) spectrum and UV−visible diffuse reflectance spectroscopic (DRS) result revealed the role of α-Fe2O3as catalytic promoter in FeSiNST NFs by suppressing electron−hole (e−−h+) recombination, red shifting, and oxygen vacancies (Ovs). The design of FeSiNST NFs by combining with SiO2as catalytic support and N and S as visible light absorbers in TiO2, beautifies the present study. The high photocurrent (3.2 mA/cm2), high Efbvalue (−1.0 V), and low Rctvalue (∼74 Ω) support the enhanced photocatalysis (photoreduction and photodegradation) by FeSiNST in visible light. Charge transfer phenomena, Ovs, mesoporosity, and separation of e−−h+ are the vital factors for an effective photocatalysis achievement.
1. INTRODUCTION
The fabrication and nanodesign of photocatalyts with semi-conductor property have attracted momentous attention due to their superior performance in pollutant remediation.1,2 Phenol, 4-nitrophenol (4-NP), and heavy metal ions such as Cr(IV) are noxious pollutants which are produced from the chemical industry.3−5These above-mentioned pollutants have detrimental influence toward whole ecosystem because they are poisonous and carcinogenic.6 Researchers have utilized various nanodesigned materials such as nanorods, nano-particles, nanotubes, nanowires, and nanoflowers for photo-catalytic removal of pollutants and toxic elements. This is because nanodesigned materials have unique optical proper-ties, such as sharp light-harvesting property and wide surface to volume ratio, and distinctive textural properties, such as surface area (SA).7−10Larger charge momentum, grain limits, swift ion distribution, and smart light absorption are the key properties which increase the great deal of attention in one-dimensional (1D) nanodesigned materials.11,12 Metal oxide nanofibers (NFs) having 1D structure fabricated by electrospinning process have remarkable features such as mesoporosity, great surface area to volume ratio, and proficient catalytic support.2,13,14 Electrospun anatase (∼3.2 eV) TiO2 NFs, an example of metal oxide NFs, have been used as a photocatalyst and sensor. This is due to their semiconductor property,
long-range photoresponse in the UV region, nontoxicity, and cost effectiveness.15,16It has been noted that TiO2NFs fabricated by electrospinning are more competent compared to TiO2. Facile e−−h+ momentum within the grain is an important factor for e− and h+ separation.17
Hence, researchers are enthusiastic in their research of designing and modifying TiO2 NFs materials toward visible light action. Visible light response photocatalysts have many advantages over UV light. These are including costeffectiveness, ease of handling, green approach, and reactionfitness.
The design and development of anatase TiO2 NFs is
essential in order to make visible light active photocatalysts toward photodegradation of 4-NP and phenol, and photo-reduction of Cr(VI). Hence, the following strategic mod-ifications will fulfill our target. These are (i) creation of mesoporosity within TiO2 NFs as base photocatalyst, (ii) N and S dual incorporation as a visible light absorber, (iii) modification of Fe2O3as a promoter, (iv) introduction of SiO2 as a mesoporous catalytic support, and (v) mixing all the above ingredients to form a stable mesoporous FeSiNST NFs
Received: February 19, 2019
Revised: May 27, 2019
Accepted: June 24, 2019
Published: June 24, 2019
pubs.acs.org/IECR Cite This:Ind. Eng. Chem. Res. 2019, 58, 12535−12550
photocatalyst. Mesoporosity and NFs morphology have great impact in photocatalysis applications.13,14This is because NFs morphology enables easy movement of the e− and h+ on the catalyst surface, whereas mesoporosity enhances the SA and surface reactive sites. Moreover, mesoporosity and NFs enhance the light absorption property and charge transport ability. Textural properties such as mesoporosity, NFs morphology, and SA have great importance for the con-struction of a photocatalyst. The electrospinning route may provide a better option to achieve the mesoporosity, SA, and
NFs morphology within TiO2 (TiO2 NFs). The
electro-spinning route provides a better platform to generate NFs and porous morphology by including an apposite template, surfactant, and other additives.18,19 Hence the design and modification of the TiO2 toward mesoporosity within NFs morphology by applying a suitable mixture of template (polyvinylpyrrolidone, PVP) and surfactant (cetyltrimethylam-monium bromide, CTAB) will be the novel approach. It has been studied that a mixture of N and S into the TiO2performs a bathochromic property.20 This is the main reason that researchers are interested to incorporate N and S into metal oxides for making visible light response photocatalysts. Hence, N and S dual incorporation will make the long-range light absorption property, i.e., red shifting which is due to induction of N 2p and S 2p states in the lattice of the metal oxide.20,21 Thus, N and S dual incorporation into a single metal oxide semiconductor like TiO2 will act as a visible light response photocatalyst. In the photocatalysis process the quick e−−h+ recombination is an adverse situation which inhibits the progress of photocatalysis reaction. Hence, in order to make an efficient photocatalyst, a suitable charge-deficient center is essential to suppress the e−−h+ recombination. α-Iron oxide (α-Fe2O3) has attracted notable attention due to its stability, cost effectiveness, nonpoisonous property, environmental sociability, suitable band gap range (2.0−2.2 eV), and positive valence band edge potential. The advantages regarding the introduction ofα-Fe2O3(Fe3+) within N−S−TiO2(NST) are as follows:
(i) It possesses 3d5(half-filled) electronic configuration. (ii) The ionic radius of Fe3+(0.064 nm) is nearly similar to the ionic radius of Ti4+, 0.068 nm,22
and the resulting Fe3+may have the ability to combine into the TiO2structure through a substitutional and interstitial approach.
(iii) Fe3+may perform as a charge trapping center within the NST lattice which is because of the charge transfer transition and d−d transition. This process may approve the suppressing of e−−h+recombination and encompassing the photocatalysis activity.
(iv) Combining of metal oxide (α-Fe2O3) as a promoter in the form of Fe3+ in NST weakens the bonding of adjacent oxygen atoms. This will result in the creation of Ovsdue to the release of oxygen atoms from the lattice.22
Hence, adaptation ofα-Fe2O3as a catalytic promoter within
the NST NFs may achieve our proficient photocatalysis
strategy and decrease the e−−h+ recombination. In order to increase/distribute the catalyst reactive sites, an appropriate catalytic support is required. Mesoporous silica based materials have been used as catalyst supports in many photocatalysis applications because of high textural properties such as large SA, wide PV, and narrow pore size (PS).23,24 Hence, amendment of SiO2 into the framework of NST lattice will offer the vital catalytic support to the semiconductor α-Fe2O3 and TiO2. Thus, nanodesign ofα-Fe2O3as promoter and SiO2
as support within NST (FeSiNST) having a mesoporosity within the NFs morphology could be able to enhance visible light absorption and diminish the recombination of e−−h+ which may lead to an efficient Cr(VI) photoreduction, and 4-NP and phenol photodegradation.
Here, we describe the synthesis and design of mesoporous photocatalysts such as TiO2 NFs, SiO2 NFs, NST NFs, and FeSiNST NFs by the electrospinning via sol−gel route. Mixed PVP and CTAB have taken the important role in the synthesis of the aforesaid NFs samples. The mechanistic pathway for the formation of mesoporosity within NFs has also been explored. The mechanism of the photoreduction of Cr(VI) and photodegradation of 4-NP and phenol has been included. The role of the semiconductorα-Fe2O3 as a charge trapping center/promoter, N and S as visible light absorber, TiO2 as base semiconductor photocatalyst, and SiO2as catalyst support is enhancing the photocatalysis activity in the FeSiNST NFs by separation of e−and h+. The synergetic action of N, S, TiO2, α-Fe2O3, and SiO2in the mesoporous FeSiNST NFs displays the maximum photocatalysis performance over neat NFs. The mesoporosity within NFs, high SA, optical properties, and charge transfer phenomena have key roles for an enhanced photocatalysis performance.
2. EXPERIMENTAL SECTION
2.1. Materials. The chemicals involved in the research were of analytical quality. These were used directly in the reaction without purification. Titanium isopropoxide (Ti-(iPr)4), tetraethyl orthosilicate (TEOS, Si(OC2H5)4), PVP (Mw = 1 300 000 g/mol), and potassium iodide (KI) were from Aldrich, whereas iron chloride (Fe(III)Cl·6H2O) was from Sigma-Aldrich. Thiourea (CH4N2S), CTAB, 4-nitro-phenol (4-NP), 4-nitro-phenol, potassium dichromate (K2Cr2O7), and p-benzoquinone used were from Alfa Aesar.
2.2. Fabrication of Mesoporous TiO2and SiO2NFs by Electrospinning via Sol−Gel. The electrospinning via sol− gel route was introduced to synthesize TiO2 NFs and SiO2 NFs. For TiO2NFs synthesis, 1 mL of titanium isopropoxide was added in 8 mL of isopropanol in a beaker. Then, PVP (1.0 g) was inserted and stirred well for 2 h. Afterward, 0.15 g of CTAB mixed with 3 mL of H2O was added into the above solution. Lastly, acetic acid (2.5 mL) was mixed into the solution and stirred for 12 h. The gel wasfilled into a plastic syringe (3 mL) with a needle diameter of 0.4 mm and connected to a syringe pump (KDS101, KD Scientific, USA). The gel rate offlow was sustained at 0.8 mL/h with a supply of an 11.5 kV electric field. The voltage was delivered by Spellman, USA. Aluminum foil was connected in the electric field to collect the sample. The temperature and humidity were maintained at 23°C and 18%, respectively. The synthesized TiO2/PVP/CTAB mixed NFs were calcined at 450°C for 5 h,
and finally mesoporous TiO2 NFs were produced. The
mesoporous SiO2 NFs were prepared with exactly the same method as for TiO2NFs, only by adding 1 mL of TEOS as the source of silica. The mesoporous SiO2 NFs were produced
after removal of PVP and CTAB from SiO2/PVP/CTAB
mixed NFs at the calcination temperature 450°C for 5 h.
2.3. Electrospinning via Sol−Gel Fabrication of
Mesoporous NST NFs, FeSiNST NFs, FeSiNST HNFs, and Electrospraying FeSiNST MNPs. In the beginning, 1.5 g of PVP was mixed with 12 mL of isopropanol in a beaker. In a separate beaker 0.15 g of CTAB was mixed in 3 mL of H2O. Both solutions were mixed well along with 0.5 g of thiourea Industrial & Engineering Chemistry Research
introduced as a source of N and S. Afterward, titanium isopropoxide (2 mL) was mixed in and stirred in order to get a sol. Lastly, acetic acid (2 mL) was mixed as a solution stabilizer to maintain the proper viscosity for the electrospinning via sol−gel process. The resultant mixture was stirred for 12 h. The mild gray colored gel solution was set for exactly the same electrospinning via sol−gel procedure as for the TiO2 NFs. The mild gray color is because of the presence of S. Moreover, the mesoporous N and S dual incorporated TiO2NFs (NST NFs) were formed after calcination (450°C, 5 h).
Similarly, mesoporous α-Fe2O3 promoted and SiO2
supported with N and S mixed TiO2nanofibers (mesoporous FeSiNST NFs) were fabricated by a three-pot system. In the first pot, 1.5 g of PVP was mixed well in 12 mL of isopropanol. Subsequently, CTAB solution (0.15 g of CTAB mixed with 3 mL of H2O) was added into the above solution. Then, 0.5 g of thiourea and titanium isopropoxide (2 mL) was mixed. Next, acetic acid (3.5 mL) was added and stirred for getting a gray sol. This proves that N and S were incorporated into the Ti− O−Ti framework. In the second pot, 0.15 g of CTAB was mixed in H2O (5 mL) with continuous stirring. TEOS (0.5 mL) was added and stirred for 1 h. In the third pot, 0.6 g of Fe(III)Cl·6H2O was added to 4 mL of isopropanol and stirred for 2 h. All of the three-pot reaction substances were mixed and stirred for 6 h to get a gel. Thefinal gel filled a plastic syringe (3 mL) and followed the electrospinning process. The syringe pump with a flow rate of 0.5 mL/h was set up to regulate the gelflow. A fixed 15 kV (Spellman) was applied to continue the power supply. Finally, mesoporous FeSiNST NFs were formed by calcination at 450°C for 5 h. The weights of Ti, Fe, Si, S, and N present in the FeSiNST NFs are 0.540, 0.142, 0.074, 0.053, and 0.038 g, respectively.
The FeSiNST hierarchical nanofibers were designated as FeSiNST HNFs. The synthesis procedure was like that of mesoporous FeSiNST NFs. Here the only difference was that PVP was taken as a template instead of mixed PVP and CTAB (template/surfactant). The material was calcined at 450°C for 5 h and formed FeSiNST HNFs. The mesoporous FeSiNST nanoparticles (FeSiNST MNPs) were fabricated by an electrospraying process. The CTAB is used as a surfactant instead of mixed PVP and CTAB. The other precursors were similar to those in the synthesis of mesoporous FeSiNST NFs, but the difference was the electrospraying process. Finally, FeSiNST MNPs were formed after calcination at 450°C in 5 h.Scheme 1depicts the scanning electron microscopy (SEM)/ scanning transmission electron microscopy (STEM) images of the FeSiNST MNPs, FeSiNST HNFs and mesoporous FeSiNST NFs by taking CTAB as surfactant, PVP as template, and PVP and CTAB as mixed template/surfactant, respec-tively. The creation of mesoporosity within NFs (FeSiNST NFs) is because of the mixture of PVP and CTAB as template/ surfactant. But neat PVP and CTAB had important roles for the fabrication of FeSiNST HNFs and FeSiNST MNPs, respectively.
2.4. Characterization. The textural properties such as SA, pore size (PS), and pore volume (PV) of the NFs were calculated from N2adsorption−desorption method at −196 °C (liquid N2). The experiment was done with a Quantachrome Instrument Autosorb (iQ2). A PANalyticalX’Pert Pro multi-purpose X-ray diffractometer (XRD) was analyzed to check the crystal arrangement and phase of the NFs photocatalysts. The XRD of the sample was measured in the range 2θ = 10−80° with Cu Kα (1.5418 Å) radiation. Field emission scanning
electron microscopy (FE-SEM) was analyzed with a Quanta 200 FEG, FEI, to check the morphology of the surface. A Tecnai G2 F30, FEI (high resolution transmission electron microscopy; HR-TEM) was employed to analyze the morphology and selected area electron diffraction (SAED) of the NFs. STEM with energy-dispersive X-ray spectroscopy (STEM-EDX) was applied to study the composition of the metal/elements in the form of oxides within the NFs. A Varian Cary 100, a UV−visible spectrophotometer, was used to record the absorption spectra of the synthesized materials. A Cary 500 was used to measure the UV−vis−near-infrared (NIR) diffuse
reflectance spectroscopy (DRS). An FL-1057 TCSPC was
used to analyze photoluminescence (PL) spectra. The spectra were measured with an excitation wavelength at 390 nm. A Thermo K-Alpha monochromated X-ray photoelectron spec-trometer (XPS) was utilized to calculate the binding energy (BE) through XPS spectra with the excitation energy hν = 1484.6 eV. The BEs of the NFs materials were plotted by using carbon (BE = 284.8 eV) as reference.
2.5. Photocatalysis Activity in Visible Light. The photocatalysis process, i.e., photoreduction of Cr(VI), progressed by utilizing 10 mL of K2Cr2O7 (40 mg·L−1) solution, catalyst dose (1 mg·mL−1) at pH 4 within 80 min. Before photoreduction, the reaction solution with photo-catalysts was stirred for 35 min in order to achieve equilibrium. A Mettler Toledo pH meter was used to measure the pH. Proper concentrations of nitric acid and NH3 were mixed dropwise to adjust the pH of the solution. The suspension was set in a reactor (Osram, sunlight simulation) and exposed in visible light with a power of 300 W. After reaction, the catalyst
was separated by filtration. The resultant product was
inspected by a UV−vis spectrophotometer with a 350 nm absorption band.
Phenol and 4-NP photodegradation was examined by involving 30 mg·L−1 concentrations of each pollutant. Both (phenol and 4-NP) solutions with presently synthesized NFs photocatalysts were stirred (40 min) individually to get equilibrium. The reaction proceeded by taking 10 mL of phenol and 4-NP separately with 1 mg·mL−1photcatalyst dose at pH 6 during 100 min. The pH analyzer, light source, and UV−vis spectrophotometer were used in the photodegradation Scheme 1. Electrosprayed Mesoporous FeSiNST MNPs (Surfactant, CTAB Only), Electrospun FeSiNST HNFs (Template, PVP Only), and Mesoporous FeSiNST NFs (Template/Surfactant, PVP/CTAB Mixture) Obtained after Calcination at 450°C for 5 h
process, similar to the photoreduction of Cr(VI). Finally, the maximum absorbances of phenol (210 nm) and 4-NP (400 nm) were measured. The recyclability study of Cr(VI) reduction and 4-NP degradation by mesoporous FeSiNST NFs was carried out up to the fourth run in the optimum
reaction condition. After the finish of each run, the
mesoporous FeSiNST NFs material was calcined at 450 °C in 5 h in order to remove impurity and make reborn the mesoporosity.
2.6. Trapping of Active Species. The trapping reaction proceeded by adding different scavengers in the reaction media in the presence of FeSiNST NFs, which gives an idea about active species involved in reaction. In photocatalysis (photo-reduction and photodegradation) reaction, 0.1 mmol of different scavengers such as KI, isopropyl alcohol (IPA), p-benzoquinone (BQ), and dimethyl sulfoxide (DMSO) was used to check the involvement of h+, •OH, O
2•−, and e−, respectively. The trapping reaction situation is like the photoreduction of Cr(VI), and the photodegradation of 4-NP and phenol. The scavengers were mixed in reaction solution before the photocatalysis process.
2.7. Photoelectrochemical Study. The photoelectro-chemical measurements were carried out by using platinum wire, Ag/AgCl electrode, and prepared electrode as the counter electrode, reference electrode, and working electrode, respectively. Electrodes were immersed in 0.1 M Na2SO4 solution. N2 gas was used to saturate the electrolyte before electrochemical measurements. For photoelectrochemical measurement, an Ivum multichannel potentiostat with light irradiation (λ = 400 nm) was used. Irradiation was executed by using a 300 W Xe lamp with a 400 nm cutoff filter.
3. RESULTS AND DISCUSSION
3.1. N2 Adsorption−Desorption and XRD.Figure 1a,b depicts the N2 adsorption−desorption isotherms and the PS distributions of NFs. All NFs photocatalysts show type IV
isotherms having H1 and H3 hysteresis (Figure 1a). This type of hysteresis is the indication of mesoporosity.25The hysteresis loops of all NFs begin with P/P0(relative pressure) of 0.1−0.5. This is due to the presence of narrow mesopores, i.e., intraparticle mesoporosity or “framework porosity”. The creation of mesoporosity within NFs is because of the removal of CTAB as surfactant at an optimal heat treatment at 450°C in 5 h. Figure 1b describes the PS (2−5 nm) of the NFs materials, and the ensuing mesoporous nature of NFs. The textural properties such as SA, PS, and PVof the NFs are shown in the Supporting Information (Table S1). Amazingly, the larger SA values of TiO2 NFs, SiO2 NFs, NST NFs, and
FeSiNST NFs, which are 50, 505, 110, and 300 m2/g,
respectively, are calculated. Hence, high SA values of NFs photocatalysts will offer more active spots for contact with Cr(VI), and 4-NP and phenol. The greater SA of SiO2 NFs (505 m2/g) than those of other synthesized NFs is a signpost of the involvement of SiO2in FeSiNST NFs. The presence of SiO2in FeSiNST NFs aids the enhancement of the SAof the FeSiNST NFs (300 m2/g). This is the vibrant reason to combine SiO2in FeSiNST NFs as a support. The PSvalues of the entire NFs samples belong to the mesoporous range (Table S1). All NFs samples possess wide PV, indicating large SA (Supporting Information). Hence, the N2 sorption isotherm provides clear information about the creation of mesoporosity and textural properties within the NFs.
Figure 1c displays the XRD pattern of the SiO2NFs. The peak at 2θ = 22.6° is assigned to the amorphous SiO2.26XRD patterns of TiO2NFs, NST NFs, FeSiNST NFs are exposed in
Figure 1d. In the case of mesoporous TiO2NFs, the peaks at 25.1, 36.9, 37.6, 38.5, 48.8, 53.8, 54.8, 62.7, 68.6, 70.1, and 75° matching with the planes (101), (103), (004), (112), (200), (105), (211), (204), (116), (220), and (215) because of the
anatase TiO2 [JCPDS no. 84-1285]. For mesoporous NST
NFs, the Bragg reflection angles correspond with the crystal planes of anatase TiO2, including N (30.1°) for the (103)
Figure 1.(a) N2sorption isotherm, (b) pore size (PS), and (c) XRD pattern of mesoporous SiO2NFs. (d) XRD patterns of TiO2NFs, NST NFs,
and FeSiNST NFs.
plane and S at an angle of 23°.13,26The less intense peak of N and S in the respective material is because of the least quantity of N and S (dopant). The existence of N and S will be clearly visible in STEM-EDX and XPS analysis. Hence, it is proved that the N and S are incorporated in an anatase TiO2lattice (NST NFs). The mesoporous FeSiNST NFs have crystal planes (012), (104), (110), (113), (024), (116), (214), and (300), due to the presence ofα-Fe2O3[JCPDS no. 33-0664]. The FeSiNST NFs also include some anatase TiO2signature along with N and S, but some peaks of TiO2are overlapped by α-Fe2O3peaks. The less intense peaks of FeSiNST NFs are due to the presence of the amorphous nature of SiO2. Hence, mesoporous FeSiNST NFs consists of α-Fe2O3, SiO2, and TiO2along with N and S.
3.2. Morphological Study. The SEM images (Figure 2) describe the morphologies of the NFs. The variation of
temperature, i.e., before calcination (70°C, 5 h), intermediate temperature (200°C, 5 h), and calcination (450 °C, 5 h), with respect to morphology has been examined to identify the stability of the NFs. The heat treatment of NFs at 70 and 200 °C is denoted as PVP and CTAB mixed NFs, whereas calcination at 450 °C is referred to as mesoporosity within NFs. The temperature variation of NFs has been done separately.Figure 2, parts a, b, and c, displays the SEM images of TiO2NFs at 70, 200, and 450°C, respectively. The smooth, bead-free NFs morphology having black color inFigure 2a,b is due to the PVP and CTAB mixed TiO2NFs. After calcination at 450°C for 5 h (complete elimination of PVP and CTAB), the mesoporous TiO2 NFs are obtained (Figure 2c). The mesoporosity of the NFs is not clearly visible which is due to
the narrow PS. The TiO2 NFs diameters are at different temperatures are calculated and shown inTable S1. The NFs diameter is reduced gradually from 500± 50 to 210 ± 30 nm with variation of temperature from 70 to 450 °C. Similarly,
smooth and bead-free PVP and CTAB mixed SiO2 NFs are
fabricated at the temperatures 70 and 200°C (Figure 2d,e). Mesoporous SiO2 NFs having diameter of 180 ± 20 nm are obtained when PVP and CTAB mixed SiO2NFs are calcined at 450 °C, 5 h (Figure 2f). The diameter decrease of PVP and CTAB mixed SiO2NFs to mesoporous SiO2NFs with different temperatures is shown in Table S1. Likewise, smooth and bead-free PVP and CTAB mixed SNT NFs obtained at heat treatment at 70 and 200 °C are shown in Figure 2g,h. But
mesoporous NST NFs having diameter of 150 ± 20 are
obtained after calcinations of PVP and CTAB mixed SNT NFs at 450°C, 5 h (Figure 2i). Moreover, PVP and CTAB mixed FeSiNST NFs having smooth and bead-free morphology are obtained at 70 and 200 °C (Figure 2jk). But mesoporous FeSiNST NFs having diameter of 200 ± 20 are fabricated, when PVP and CTAB mixed FeSiNST NFs are calcined at 450 °C (Figure 2l). The decrease occurred gradually from 70 to 450°C (Table S1). From SEM images for all NFs materials, the mesoporosity is not clearly seen which is due to the narrow PSin the range 2.5−4.7 (Table S1). From the SEM analyses, it is well-understood that mixed PVP and CTAB have a proficient role in the formation of fiber, whereas different heat treatments have an important role in the creation of mesoporosity in the framework of NFs.
To recognize the importance of mixed PVP and CTAB as a template/surfactant for the construction of mesoporosity within NFs, the FeSiNST has been synthesized separately by taking PVP and CTAB as template and surfactant, respectively. The SEM image of the electrospun FeSiNST, synthesized by only PVP as template, is shown in theSupporting Information
(Figure S1a,b). A hierarchical NFs morphology is obtained which is called FeSiNST hierarchical NFs (FeSiNST HNFs).The SEM image of the FeSiNST which is synthesized by only CTAB as surfactant is pictured inFigure S1c,d.Figure S1cillustrates the nanoparticles (NPs) nature, whereasFigure S1drepresents the mesoporosity. Hence, FeSiNST synthesized by CTAB is called FeSiNST mesoporous NPs (FeSiNST MNPs). From SEM images of FeSiNST HNFs and FeSiNST MNPs, it is observed that template PVP generates hierarchical NFs and CTAB aids to create mesoporous NPs. For more
clarification regarding role of PVP and CTAB, the N2
adsorption−desorption isotherm of FeSiNST HNFs and
FeSiNST MNPs is pictured in Figure S2. Both materials showing type IV mesoporosity. But the SAvalues of FeSiNST HNFs and FeSiNST MNPs are 95 and 190 m2/g, respectively (Table S1). Mesoporsity is directly related to the SA, which means highly mesoporous materials have large SA values. Hence, FeSiNST MNPs have a higher mesoporosity than FeSiNST HNFs, which leads to enhanced SA. Therefore, the decrease of all NFs diameters with the increase of temperature is owing to the gradual elimination/decomposition of PVP, whereas generation of mesoporsity is due to the decomposition of CTAB at high calcination temperature (450 °C in 5 h).
Conclusively, from SEM and N2 adsorption−desorption
method it is well-understood that PVP is responsible for the preparation of NFs morphology, whereas CTAB is responsible for formation of mesoporosity. The combination of PVP and CTAB is the reason for the creation of mesoporosity within NFs.
Figure 2. Representative SEM images of NFs calcined at different temperatures of 70, 200, and 450°C: TiO2NFs (a−c), SiO2NFs (d−
f), NST NFs (g−i), and FeSiNST NFs (j−l).
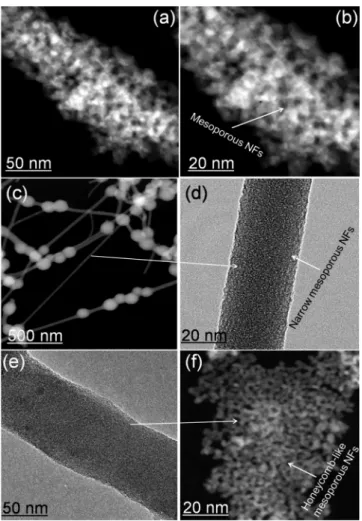
In order to study the morphology of the NFs material, TEM and STEM analyses have been executed (Figure 3).Figure 3a,b
depicts STEM micrographs of mesoporous TiO2 NFs. The
morphology of highly porous nature (mesoporous) is observed which is consistent with the N2adsorption−desorption study. The diameter of the NFs is 84 ± 4 nm (Table S1). The architecture of the TiO2NFs could be“mesoporosity-in-TiO2 NFs”. Similarly, STEM (Figure 3c) and TEM (Figure 3d) images display the narrow mesoporous nature of NFs with NFs diameter of 72 ± 3 nm and possess “mesoporosity-in-SiO2 NFs” architecture. Moreover, TEM (Figure 3e) and STEM (Figure 3f) images of the mesoporous NST NFs also retain “mesoporosity-in-SNT NFs” architecture with 95 ± 4 nm NFs diameter. An amazing honeycomb-like mesoporosity is obtained in Figure 3f. Hence, mesoporosity within NFs morphology in all synthesized NFs will increase the surface active sites for photocatalysis performance. HR-TEM images are related to lattice fringes, and SAED patterns of the TiO2 NFs are pictured in Figure S3a. The lattice space 0.351 nm proves the anatase TiO2for the (101) plane in the mesoporous TiO2 NFs (inset). The SAED image reveals the diffraction patterns for (101), (004), (200), (105), and (211), which are due to the crystalline anatase TiO2. Figure S3b defines the amorphous SAED picture of the mesoporous SiO2NFs. This is because of the absence of a ring pattern. The SAED pattern (Figure S3c) proves the crystalline nature of the NST NFs and the plane (103) is responsible for N. The lattice spacing of
SNT NFs is 0.345 nm (Figure S3c, inset). The decrease of the lattice spacing from 0.351 nm (TiO2NFs) to 0.345 nm (NST NFs) is may be due to the dual incorporation of N and S into the TiO2lattice.
The TEM, STEM, and HR-TEM micrographs of meso-porous FeSiNST NFs are presented inFigure 4. A
honeycomb-like and narrow mesoporosity within NFs have been identified
in TEM and STEM images in Figure 4, parts a and b,
respectively, which is consistent with N2 adsorption− desorption study. From TEM and STEM images, the diameter of the NFs is measured as 84± 3 nm (Table S1), which is in the nano range. Therefore, the architecture “mesoporosity-in-FeSiNST NFs” is created as in TiO2NFs, SiO2NFs, and SNT NFs. The lattice space (Figure 4c) of 0.342 nm for NST (101), and 0.280 nm forα-Fe2O3(104) are calculated for FeSiNST NFs.27The diminution in lattice spacing in NST NFs within FeSiNST than in neat NST NFs is because of the creation of FeSiNST NFs. The lattice borders represent the polycrystalline nature, which is owing to the existence ofα-Fe2O3, SiO2, N, S, and TiO2. The unavailability of SiO2lattice fringes in FeSiNST NFs (Figure 4c) is due to amorphous nature, which is
consistent with XRD measurement (Figure 1c). The
polycrystalline nature of FeSiNST NFs is also supportive for harvesting visible light. The dispersal of metal atoms and reactive sites on mesoporous FeSiNST NFs has been confirmed from EDX mapping (Figure 4d−i). It is observed that Fe, Si, Ti, N, S, and O are available in the FeSiNST NFs. STEM-EDX elemental study also supports the presence of individual metal atoms in mesoporous TiO2 NFs, SiO2NFs, NST NFs, and FeSiNST NFs inFigure S4a−d.
3.3. Optical Analyses. The UV−vis−NIR diffuse reflectance spectra of all NFs are exposed in Figure 5a. For TiO2NFs and SiO2NFs samples, the strong reflectance edge which is less than 400 nm corresponds to anatase TiO2 and amorphous SiO2, respectively. The shifting of band edge, i.e., greater than 400 nm in the case of NST NFs and FeSiNST NFs, is because of the long-range visible light absorption. The wide visible light absorption is because of the replacement of N and S by replacing O atom in TiO2lattice (NST NFs). The high shifting of band edge in FeSiNST NFs is owing to the combined effect such as replacement of N and S by O atom in TiO2 lattice and charge transferral phenomena between α-Fe2O3 and TiO2. Apparently, α-Fe2O3, N and S dual incorporation, creates a defect level in between the band gap
Figure 3. Representative TEM images of (a, b) mesoporous TiO2
NFs, (c, d) mesoporous SiO2NFs, and (e, f) mesoporous NST NFs.
Figure 4.Mesoporous FeSiNST NFs: (a) TEM image, (b) STEM image, (c) lattice fringes (HR-TEM), and (d−i) EDX mapping patterns.
of TiO2and thus the band edge of the FeSiNST NFs shifting toward the visible region. The formation of α-Fe2O3 in the mesoporous FeSiNST NFs creates a charge transfer and d−d transition phenomenon which is clearly described in the UV− vis−NIR diffuse reflectance spectra (Figure S5). The FeSiNST NFs show two transition bands: the first range between 496 and 646 nm is ascribed to the 3d electrons (excitation) of Fe3+ to the conduction band (CB) of TiO2. This phenomenon is called the charge transfer transition. Second, the range between 802 and 1041 nm is credited to two transitions: one is the d−d transition of Fe3+ (2T2g →2A2g) and the second is the inner charge transfer transition in between Fe3+ through the CB (Fe3++ Fe3+→ Fe4++ Fe2+).22This infers that involvement of Fe3+ from α-Fe
2O3 along with N and S in the TiO2 lattice brings two electronic states, i.e., Fe4+and Fe2+, in between the band gap of TiO2. This phenomenon enhances high light absorption and red shifting in the mesoporous FeSiNST NFs than other NFs photocatalysts. Hence, it is concluded that N
and S dual incorporated TiO2 NFs (NST NFs) favor red
shifting due to the substitutional effect, whereas mixing of α-Fe2O3 as catalytic promoter, and dual N and S in FeSiNST NFs, favors red shifting. The red shifting is due to the charge
transfer transition, d−d transition, and substitutional effect. The red shifting phenomenon enables superior visible light photocatalysis application. The combined Kubelka−Munk
[K−M/F(R)] and Tauc equation is employed to evaluate
the band gap energy of the NFs samples.28 The detailed explanation is included in the Supporting Information. The band gap energies of all the NFs photocatalysts are given in
Figure 5. The band gap of SiO2 NFs is 3.4 eV (Figure 5), which indicates inactive samples in visible light. The band gap of 3.2 eV is calculated for mesoporous TiO2 NFs, which indicates the anatase phase and UV-responsive material. The band gap of 2.55 eV is calculated for mesoporous NST NFs, which is smaller than that for TiO2NFs. Hence, the band gap lowering is because of the creation of a localized state by intermixing of 2p orbitals of N, S, and Ti. The lowest band gap energy of FeSiNST NFs (2.1 eV) is because of the intermixing of 2p orbitals of Fe, Si, N, S, and Ti, resulting in a localized state. These localized states are created in between the valence band (VB) and the conduction band (CB) which is lowering the band gap. Moreover,α-Fe2O3in FeSiNST NFs has a vital role in decreasing the band gap energy which is because of d−d transition and charge transfer phenomena.
Figure 5.UV−vis−NIR DRS and band gap profiles of mesoporous SiO2NFs, TiO2NFs, NST NFs, and FeSiNST NFs. Industrial & Engineering Chemistry Research
To evaluate charge transfer phenomena, recombination of e−−h+, and vacancy in semiconductor NFs, photoluminescence (PL) emission spectra have been pictured. The PL spectra of all NFs materials are generated with an excitation wavelength ofλexc= 390 nm, and the result is pictured inFigure 6a,b. In
Figure 6a, two peaks around 440 and 495 nm are observed for TiO2NFs. The emission band situated at 440 nm is because of the surface trapped recombination.29 The peak at 495 nm (emission) can be consigned to the bulk defects trapped recombination. This peak appears due to the occurrence of impurities in the TiO2NFs.30The impurities are due to the Ovswhich are created under the CB of the TiO2NFs.31The PL spectrum of mesoporous SiO2 NFs (Figure 6b) shows a
broad peak around 450−600 nm which is due to the
amorphous nature of the SiO2.32 The PL peaks of the semiconductor NST NFs and FeSiNST NFs are lower than those of the TiO2NFs (Figure 6a,b). It is recognized that the PL emission depicts the recombination of excited e−−h+. Thus, decrease in PL intensity confirms a lower recombination rate of e− and h+.33 The least recombination of e−−h+ favors the superior photocatalysis performance. The semiconductor FeSiNST NFs has the least e−−h+ recombination compared with other synthesized NFs. Hence, FeSiNST NFs will act as a proficient photocatalyst for the photoreduction of Cr(VI), and the photodegradation of 4-NP and phenol. Additionally, the least e−−h+recombination of FeSiNST NFs is because of the formation of Ovs, d−d transition, and charge transfer transition.34The Ovsof the NST NFs and FeSiNST NFs are pictured in Figure 6b. Mesoporous NST NFs and FeSiNST NFs show Ovsat 540 nm. The N and S dual incorporation into TiO2 (NST NFs) leads to the construction of Ti3+. The photoemission electrons are trapped by Ti3+ from the CB of TiO2through nonradiative transition. Further, the Ovshelp to accept the excited electrons, while the h+are trapped by the N and S. Moreover, the excited electrons can also be transferred from the VB to the new defect level which are introduced by N and S that are situated below the CB. This process inhibits the recombination of e−−h+and the resulting swift photoreduction and photodegradation in visible light. Furthermore, a high rate of interfacial charge transfer favors quantum confinement which is because of the enhanced thermodynamic energy of the confined e−−h+pairs.35The creation of interfacial charges
in the FeSiNST NFs is due to the existence of Fe3+ (Fe3++ Fe3+ → Fe4+ + Fe2+). Technically, the compensation of electrons within Fe ions leads to e−−h+ recombination. This phenomenon benefits decreasing the e−−h+ recombination, resulting in lowering the PL intensity over other NFs. In d−d transition phenomena, Fe3+ ions can acquire lattice locations by replacing Ti4+ions or can be placed in interstitial positions, whereas the Ovshelp to maintain the electrical charge balance. The depletion of peak intensity in the FeSiNST NFs is due to the Ovs which are involved in charge/electrical balance phenomena. Thus, in FeSiNST NFs, the formation of interfacial charge transfers and d−d transitions has a vital role in decreasing PL intensity and suppressing e−−h+ recombination. Conclusively, N and S dual incorporated TiO2 generates Ovs, whereas involvements of α-Fe2O3 (FeSiNST NFs) generate charge transfer transition and d−d transition. This process really helps to lower e−−h+ recombination and enhance photocatalysis activity.
3.4. Chemical Structure Analyses. The XPS study of
mesoporous FeSiNST NFs is performed in Figure 7. In
FeSiNST NFs, the binding energy (BE) values are situated at 458.4 and 464.1 eV for the peaks Ti 2p3/2 and Ti 2p1/2, respectively (Figure 7a). But the BE values of Ti4+in neat TiO2 are also calculated, which appear around 459.3 and 464.8 eV (Figure S6) for the peaks Ti 2p3/2and Ti 2p1/2, respectively.36 The downshift of Ti4+ BE in FeSiNST NFs compared with neat TiO2indicates the simultaneous electron transfer from N and S to Ti (forming Ti3+ environment). Another situation is electron transfer from O atom (α-Fe2O3and SiO2) to Ti. This
Figure 6. (a) PL spectra of mesoporous TiO2 NFs and (b)
mesoporous SiO2NFs, NST NFs, and FeSiNST NFs.
Figure 7.Core level spectra of Ti 2p (a), N 1s (b), S 2p (c), Si 2p (d), Fe 2p (e), and O 1s (f) in mesoporous FeSiNST NFs.
is because of the electronegative and electropositive differences between O and Ti, respectively. The aforesaid factors are the vibrant reason for the reduction of Ti4+to Ti3+in the FeSiNST NFs which enable visible light shifting. The peak at 399 and 400 eV (Figure 7b) is due to the presence of N in the bonding
type of O−Ti−N and Ti−N−O through substitutional and
interfacial combinations, respectively. This N incorporation formed the N 2p localized state in between the VB and the CB of TiO2, resulting in visible light absorption. This process enables an efficient photocatalysis performance under visible light. The N 1s peak around at 401.6 eV is ascribed to the existence of N in oxidized state, which may form−Ti−N−O−, −Ti−O−N− linkage. This oxidized N forms a close interaction toward O, which is favorable for an interstitial N incorporation.37Hence, the bonding framework of−Fe−O−
N− and −Si−O−N− may be likely in FeSiNST NFs. The
keen observation is that, in the FeSiNST NFs, the substitution of N by O is a vital aspect because of the presence of TiO2, α-Fe2O3, and SiO2. In the S 2p spectrum (Figure 7c) two peaks appear at 169.1 and 170 eV, conforming to S6+.38
Hence, S atom is incorporated into the FeSiNST mainly as S6+. It has been observed that replacement of Ti4+by S6+ is more facile and suitable, when thiourea is used as the sulfur source.39It has been examined that the substitution of Ti4+ by S6+ generates Ovs in the TiO2 lattice.40 Thus, in the present study, S is incorporated into the FeSiNST NFs in the form of substitution of Ti4+by S6+, which creates O
vs. Hence, the generation of Ovs is also proved by XPS analysis. It is noted that the BE of Si 2p in neat SiO2is 103.7 eV.41But in the present study the BE of Si 2p (Si4+) in the FeSiNST NFs is 102.9 eV (Figure 7d). The downshift of BE is owing to the transfer of electrons from N to Si4+which causes an increase of electron density over Si4+. It is also well-known that the two characteristic BEs at 712.1 eV (Fe 2p3/2) and 725.5 eV (Fe 2p1/2) and a satellite peak at 719.1 eV are because of theα-Fe2O3.42In the present investigation, the peaks are at 711.1 and 724.8 eV analogous to the Fe 2p3/2and Fe 2p1/2, respectively, along with the two satellite peaks are at nearly 719 and 724.8 eV, proving the existence ofα-Fe2O3in the FeSiNST NFs (Figure 7e). The low BE shifting of Fe 2p in FeSiNST NFs compared with pure Fe 2p is because of the electron transfer from Ti4+to Fe3+and the generated−Ti−O− Fe− bonding framework. The electron transfer from Ti4+ to Fe3+ is due to the electronegativity differential between Fe3+ (1.83) and Ti4+(1.54). Hence, the electron density of Ti4+ion is lower than that of Fe3+. This phenomenon enables the rise of the BE of Ti4+and the fall of the BE of Fe3+. The BE of O 1s (Figure 7f) in FeSiNST NFs is located at 530.5 eV, owing to the lattice oxygen, suggesting the existence of Ti−O bonding in TiO2.43 The peak at ca. 531.8 eV (nonlattice oxygen) is because of the surface hydroxyl available in the FeSiNST NFs. Additionally, the peak at 531.8 eV is also ascribed to the presence of −S−O−S− linkage.38 It has been also observed that the rise in the area of nonlattice oxygen specifies the creation of Ovs.
44
InFigure 7f, the peak area of the nonlattice oxygen is nearly half that of the lattice oxygen, which also proves the generation of the Ovs in TiO2 lattice (FeSiNST NFs).
3.5. Electrochemical Performance. The photoelectro-chemical study of mesoporous FeSiNST NFs along with NST NFs has been studied (Figure 8). In order to measure the photocurrent, charge density, and rate of charge transfer at the electrode/electrolyte interface within NFs, the photocurrent
measurement, MS (Mott−Schottky) diagram, and EIS
(electrochemical impedance spectroscopy) are studied, respectively. The photocurrent of mesoporous NST NFs and FeSiNST NFs is measured in 0.1 M Na2SO4(0.1 M) at 10 mV s−1scan rate inλ ≥ 400 nm. The photocurrent densities, i.e., 1.8 and 3.2 mA/cm2, are calculated for mesoporous NST NFs and FeSiNST NFs, respectively (Figure 8a). The photo-currents in both NFs with positive values represent the anodic direction with the applied potential, resulting n-type semi-conductors. The mesoporosity within NFs has a key role in a proficient harvest of photocurrent in both NFs. The harvesting of higher photocurrent in FeSiNST NFs than in NST NFs is owing to the efficient charge transport within NFs.45 The superior charge transport in FeSiNST NFs is because of α-Fe2O3. This efficient charge transport is because of the d−d transition and charge transfer transition, which leads to enhancement of the electron mobility or electron density. The high electron mobility over FeSiNST NFs increases the photocatalysis performance.
The MS method has been used to check the band arrangement and recombination properties. This process is calculated in three-electrode systems using the counter electrode (Pt) and reference electrode (Ag/AgCl), and both are dipped in Na2SO4(0.1 M) in 1000 Hz at pH 6.5 in the dark.Figure 8b−d represents the MS diagram of α-Fe2O3NFs, NST NFs, and FeSiNST NFs. The SEM image and the EDX elemental analysis ofα-Fe2O3NFs has been inserted inFigure
S7. The positive slope for all samples shows n-type
semiconductor behavior. The mesoporous FeSiNST NFs having a single slope specifies that α-Fe2O3 is crucially promoted in the photocatalysis activity with N and S dual incorporated TiO2. Moreover, from the intercept of the MS diagram (Figure 8b−d), the Efb(flat band potentials) for α-Fe2O3 NFs, NST NFs, and FeSiNST NFs are calculated as −0.61, −0.78, and −1.0 V, respectively. A higher magnitude of negative value for the Efbin semiconductor (n-type) specifies enhanced transport and separation of charge carriers at the interface of electrolyte−electrode, resulting in enriched
photoelectrochemical performance.46 The FeSiNST NFs
have a more negative Efbthan NST NFs and α-Fe2O3NFs. Thus, separation and transport of charge carriers is better facilitated in FeSiNST NFs, which thereby exhibit a better photoelectrochemical response. This process makes the photocatalysis applications excel. It is understood that mixing of metal ions with increased valence states such as Ti4+and Si4+ results in enhanced electron density onα-Fe2O3, by acting as donor.47The low impedance for the FeSiNST NFs is because of the high charge density is directly related to the conductance, which is calculated by the formula σ = ne0μ. The better conductivity (electrical) may spread the lifespan of
charge carriers, which helps to decrease the e−−h+
recombination.48 Thus, the enhanced charge density and lower e−−h+recombination in the surface by the mixing of Ti and Si surface is supposed to be the key aspect for the remarkable photocurrent enhancement of theα-Fe2O3in the FeSiNST NFs. The CB potential for n-type semiconductors is nearly equal to Efb. Hence, the locations of the CB forα-Fe2O3 NFs and NST NFs are−0.61 and −0.78 V, respectively. Thus, band structure has significant role in the high photocatalysis performance, which is reflected in the photocatalysis section.
The semicircles at higher frequency and the nearly straight line at the lower frequency level (Nyquist plots) are observed in the EIS of mesoporous NST NFs and FeSiNST NFs (Figure 8e). The low frequencies (semicircle) represent the charge Industrial & Engineering Chemistry Research
transfer within the electrode/electrolyte interface, whereas the charge transfer resistance (Rct) is calculated from the semicircle diameter.49 In the present investigation, the Rct value for mesoporous NST NFs (∼516 Ω) is greater than that for the FeSiNST NFs (∼74 Ω). It is noted that the bigger semicircle diameter provides the high resistance at the interface, which shows less conductance. The lower Rctof the FeSiNST NFs is due to the modification of the α-Fe2O3 which facilitates the facile charge momentum within the interface, thus increasing generation of photocurrent. The lesser Rct value indicates the greater charge transfer performance in mesoporous FeSiNST NFs. Charge transfer phenomena may progress capably from TiO2 (Ti4+)/SiO2 (Si4+) to α-Fe2O3 (Fe3+). The charge transfer towardα-Fe2O3 (Fe3+) is because of internal charge transfer transition and d−d transition (Figure S5) which creates vacant sites within α-Fe2O3. Thus, α-Fe2O3 becomes the charge trap center in FeSiNST NFs. Henceforth, the FeSiNST NFs have a more effective e−−h+ separation than SNT NFs. Thus, FeSiNST NFs will have superior photo-catalysis activity which is due to the low Rct value. Furthermore, in the lower frequency region, a straight line is observed which is due to the WS(Warburg impedance). This WSis responsible for the diffusion or transfer of ions within an electrolyte.50The FeSiNST NFs have a lower Warburg region
than NST NFs (Figure 8e). The smaller Warburg region of the
mesoporous FeSiNST NFs is due to the effective ion
movement in the NFs via mesopores and supports superior photocatalysis performance. Hence, enriched current density, charge transfer, and ion momentum in the FeSiNST NFs are the key factors for the improved photocatalysis performance which is because of the mixing of α-Fe2O3 as electron trap center and mesoporosity within NFs.
3.6. Growth Mechanism. The growth mechanism of mesoporous FeSiNST NFs is described in the origin of the synthesis procedure (Scheme 2). The mesoporous FeSiNST NFs are synthesized on the basis of the electrospinning via sol−gel method. Scheme 2a depicts the chemical interaction,
whereas Scheme 2b describes the schematic approach
regarding formation of the mesoporous FeSiNST NFs. The precursors of Ti, Fe, and Si are diluted in the mixed solvents isopropanol and H2O including PVP and CTAB in acetic acid, and then the hydrolysis process is progressed and forms Ti(OH)4, Si(OH)4, and Fe(OH)3in the reaction media. These hydroxyl groups make hydrogen bonding with oxygen available in PVP, and also form a hydrogen bond with N+from CTAB. Another possibility is that oxygen atom from metal hydroxide also creates a Coulombic interaction with N+, present in CTAB. The thiourea was also hydrolyzed and the N and S
Figure 8.Potential−current density curves of mesoporous NST NFs and FeSiNST NFs (a) under light condition. MS diagrams of Fe2O3NFs,
mesoporous NST NFs, and FeSiNST NFs (b−d) in the dark. Nyquist plot for NST NFs and FeSiNST NFs (e).
atoms anchor to the metal hydroxides through oxygen and hydrogen. The nucleation of metal particles and formation of sol are created in this process. The PVP and CTAB formed a polymeric chain and micelles with metal hydroxide sol and finally formed a gel for electrospinning, respectively. The mesoporous FeSiNST NFs are formed after drying (70°C, 3 h) and calcinations (450°C, 5 h) of PVP and CTAB mixed FeSiNST NFs.
PVP, CTAB, and acetic acid have vital roles for the fabrication of the mesoporous FeSiNST NFs (Scheme 2b). PVP (template) has a long polymeric chain which is responsible for the fabrication of NFs framework during the electrospinning process. Additionally, long chain PVP creates hydrogen bonding with−OH groups of metals such as Ti, Fe. and Si. CTAB is an amphiphilic molecule, which contains a hydrophilic head and a hydrophobic tail. It will form the micelles and subsequent nucleation for the growth of metal (Ti, Fe, and Si) hydroxides. Moreover, after addition of CTAB, the ion pairs are formed due to electrostatic interaction of the active species (N+···O2−), which speed up the reaction of the growth units. During the evaporation of solvent, the self-assembly of CTAB micelles with metal hydroxides occurred, which led to a complete polymerization of the inorganic network. In the crystallization process, the CTAB serves as a pore growth controller and surfactant. During the calcinations, the CTAB decomposes and organic species are removed, leading to formation of the mesoporous FeSiNST NFs. It is stated that the species which are causing foam during hydrolysis help to produce mesoporosity.51 The foams are generated after mixing of CTAB in water which leads to formation of a micelle, and resulting mesoporosity within FeSiNST NFs after calcination. The acetic acid in the reaction stabilized the sol. This is because acetic acid has tendency to slow down the condensation and reduce the gelation rate of sol.52The optimum amount of the acetic acid in the reaction solution aids to form perfect NFs. Hence, PVP, CTAB, and acetic acid have vital involvement for the synthesis of mesoporous FeSiNST NFs.
3.7. Photocatalysis Activity of Mesoporous Nano-fibers. Photoreduction of Cr(VI) proceeded under visible light. It is examined that mesoporous FeSiNST NFs have superior Cr(VI) photoreduction performance. The experiment was continued for 80 min in visible light, K2Cr2O7(40 mg·L−1) solution, and catalyst dose (1 mg·mL−1). In order to check the effect of pH, the photoreduction of Cr(VI) progressed on different pHs (Figure S8). The photoreduction of Cr(VI) by FeSiNST NFs falls at higher pH. This is because the photocatalyst surface (low pH) gets protonated, resulting in formation of HCrO4− species and enhancing the photo-reduction process. The photocatalyst surface becomes negative at high pH, which repels the negative species Cr2O72−, resulting in low photoreduction activity. The results shows that the highest photoreduction Cr(VI) is at pH 4. Hence, pH 4 is the optimum pH condition for the photoreduction of Cr(VI) by different NFs photocatalysts (Figure 9a). After reaction, the UV−visible absorbance intensity of Cr(VI) diminishes slowly from SiO2NFs to FeSiNST NFs. The least absorbance (Figure
9a) in the case of mesoporous FeSiNST NFs specifies
proficient photoreduction of Cr(VI).
The photodegradation of 4-NP and phenol progressed under visible light. The reaction is performed in 100 min, 30 mg·L−1(4-NP and phenol), and catalyst dose (1 mg·mL−1).
The effect of pH on the photodegradation of phenol is
described in Figure S9. The reactions progressed at different pH by mesoporous FeSiNST NFs. The photodegradation of phenol was maximum at pH 6 (100%), and with a gradual rise of pH from 6 to 10, the percent of photodegradation decreases. This may be described by the acid strength (pKa) of phenol, i.e., 9.8. Generally phenol dissociation starts at pH > pKa, so at pH above 9.8, the photodegradation decreases because of phenol ionization, resulting in less photodegradation. The highest photodegradation is observed at pH 6, which is due to the presence of undissociated phenol. Not only phenol but also the photodegradation percent of 4-NP is seen at pH 6. The reason is similar to that for phenol photodegradation.
The photodegradation of 4-NP and phenol by different NFs photocatalysts is presented in Figure 9, parts b and c, Scheme 2. Chemical Interaction (a) and Schematic Pathways (b) of Growth Mechanism of Mesoporous FeSiNST NFs Industrial & Engineering Chemistry Research
respectively. The experiment is performed in 100 min at pH 6 under visible light. The UV−visible absorbance intensity of 4-NP drops from SiO2NFs to FeSiNST NFs with respect to 4-NP (standard). The lowest absorbance in the case of FeSiNST NFs indicates efficient photodegradation of 4-NP (Figure 9b). The photodegradation of phenol by different NFs photo-catalysts also followed the same trend as 4-NP, i.e., SiO2NFs < TiO2NFs < NST NFs < FeSiNST NFs. The percent of Cr(VI) photoreduction, and 4-NP and phenol photodegradation, varies with different photocatalysts as displayed inTable S2. The high percent of Cr(VI) photoreduction and 4-NP photodegradation as compared to phenol is detected. This is because of the light yellow color of both Cr(VI) and 4-NP which enables them to absorb visible light proficiently as related to phenol. The increase in photocatalysis (photo-reduction and photodegradation) reaction of Cr(VI), and 4-NP and phenol, by mesoporous FeSiNST NFs is because of the mesoporosity within NFs, high light absorption property, charge transfer transition, d−d transition, Ovs, and e−−h+ separation. The high light absorption property is due to the optimum amount of Ti, N, and S, whereas the optimum amount of Fe enhances the charge transfer transition and d−d transition in FeSiNST NFs. The suitable amount of Si aids in increasing the surface properties for an efficient photo-reduction and photodegradation performance.
The mesoporosity within NFs increases the SA, and the high SA provides fruitful reactive sites for the photocatalysis performance. The mesoporous FeSiNST NFs has a wider SA, i.e., 300 m2/g, than other synthesized NFs; hence the interaction of reactant species with photocatalyst surface will be more, resulting in high photocatalysis performance. The mesoporous SiO2 NFs have lower photocatalysis activity despite a high SA(500 m2/g). This is because of the absence of N and S as visible light absorber andα-Fe2O3as catalysis
promoter. The enhanced light absorption/red shifting is due to the availability of N and S as visible light absorber in
photocatalyst NST NFs and FeSiNST NFs (UV−vis−NIR
DRS spectra). But mesoporous FeSiNST NFs have a higher photocatalysis performance than mesoporous NST NFs. Hence, it is understood that α-Fe2O3has a tremendous role which makes FeSiNST NFs a superior photocatalysis. The d−d transition and charge transfer transition are created owing to the presence of Fe3+ (α-Fe2O3) in FeSiNST NFs (UV−vis− NIR DRS spectra). According to crystal field theory, it is known that Fe2O3 has vacant d orbitals. Hence, Fe3+ in composite FeSiNST NFs can capture electrons through d−d transition, resulting in lowering e−−h+ and enhancing photo-catalysis activity. But the charge transfer transition induces Fe4+ and Fe2+electronic states within N and S in the TiO
2lattice, resulting in an impurity state and decreasing the band gap. This phenomenon enhances the light absorption in visible light. Furthermore, the formation of interfacial charge in the composite FeSiNST NFs is due to the presence of Fe3+, which enhances the light absorption property and suppresses the charge recombination. The d−d transition and charge transfer transition phenomenon also enhances the light absorption property and red shift, resulting in high photocatalysis performance in FeSiNST NFs. Although NST NFs have more light absorption property and red shift, the absence of charge transfer phenomena shows less photocatalysis activity than FeSiNST NFs (Figure 9). Ovshave great ability to capture electrons, which leads to separating e−−h, resulting in effective photocatalysis activity.53The creation of Ovsis because of the presence of N and S andα-Fe2O3. Hence, the availability of Ovs in FeSiNST NFs (PL and XPS study) supports the efficient photoreduction Cr(VI), and the photodegradation of 4-NP and phenol. The high photocurrent density enables generation of high electrons and holes which support tremendous
Figure 9.UV−vis spectra of solutions recorded after photoreduction Cr(VI) (a), and photodegradation of 4-NP (b) and phenol (c) by different photocatalysts (10 mg in 10 mL solution) under visible light. The photoreduction process is continued at pH 4 in 80 min, whereas the photodegradation process is at pH 6 in 100 min. The kinetic study is also performed by taking different concentrations (40, 50, and 60 mg·L−1) for
Cr(VI) (d). Concentration varies (30, 40, and 50 mg·L−1) for 4-NP (e) and phenol (f), with different time intervals (20, 40, and 60 min) on
mesoporous FeSiNST NFs.
photocatalysis performance in FeSiNST NFs compared with NST NFs (electrochemical study, Figure 8). The increase of Efbin FeSiNST NFs has a greater ability for suppressing e−−h recombination than NST NFs, resulting in high photocatalysis performance. The small values of Rct and Ws (EIS study) enhance charge transfer, charge separation, and ion momen-tum in the case of FeSiNST NFs, resulting in superior photoreduction of Cr(VI), and photodegradation of 4-NP and phenol compared with other synthesized NFs.
The kinetics of Cr(VI) photoreduction, and 4-NP and phenol photodegradation, by mesoporous FeSiNST NFs is revealed inFigure 9d−f. The outcomes are fitted in log C0/C vs t. Various concentrations (40, 50, and 60 mg·L−1) of Cr(VI) and the concentrations (30, 40, and 50 mg·L−1) for 4-NP and phenol with time variation (20, 40, and 60 min) for all are studied in the kinetic process. The rate of photocatalysis performance is more at lower concentrations of Cr(VI), 4-NP, and phenol and goes down with a rise of concentration. The concentrations of Cr(VI), 4-NP, and phenol with respect to time achieved a linear relationship. First order kinetics is observed for Cr(VI) photoreduction and for 4-NP and phenol photodegradation. The calculated data arefitted well for first order kinetics, and the equations are as follows.
C C Kt
log 0/ = /2.303 (1)
K=(2.303 logC C t0/ )/ (2)
where the first order rate constant is referred to as K, the Cr(VI) concentration (initial) is attributed as C0, and C stands for the concentration with passage of time (t).
The active species involved in the photoreduction of Cr(VI) on FeSiNST NFs is examined by the trapping test, which is illustrated inFigure S10a. It is noted that h+,•OH, O
2•−, and e− are the reactive species which are involved in photo-reduction. The Cr(VI) photoreduction is decreased less (IPA as scavenger) than the reaction executed without scavenger, which proves negligible participation of •OH radicals in photoreduction. The photoreduction of Cr(VI) decreased appreciably by using BQ. Therefore, O2•−has some role in the photoreduction process. But the Cr(VI) photoreduction is extremely diminished when DMSO is used as scavenger. That means e−has a great role in the photoreduction of Cr(VI) to Cr(III). Categorically, e− plays a vital role in the photo-reduction of Cr(VI) under visible light. Hence, more association of e− in the reaction proves the high separation of e−−h+. The trapping test for the photodegradation of 4-NP is pictured in Figure S10b. The result shows that the photodegradation percentage is highly decreased when IPA is used as•OH scavenger as compared to other scavengers such as KI, DMSO, and BQ. Hence,•OH has great role in the 4-NP photodegradation. The photodegradation of phenol will also follow the same trend as that of 4-NP. Conclusively, e−is the active agent for the photoreduction of the Cr(VI), whereas
•OH is the active agent for 4-NP and phenol
photo-degradation.
3.7.1. Mechanism of Photocatalysis Activity. Appropriate CB and VB of the semiconductors are essential to study the mechanism of the Cr(VI) photoreduction, and 4-NP and phenol photodegradation. From the MS diagram (Figure 8b), the Efbforα-Fe2O3NFs is−0.61 V which is nearly equal to the conduction band potential (ECB) of theα-Fe2O3NFs.50Hence, the ECBofα-Fe2O3NFs is−0.61 eV, whereas the Efbfor NST NFs is−0.78 V (Figure 8c). Hence the ECBof NST NFs is
−0.78 eV. The calculated band gap, i.e., 2.55 eV, is for NST NFs (Figure 5). Hence, the EVB(valence band potential) will be 1.77 eV.Scheme 3depicts the band edge plot of NST NFs.
On the irradiation of visible light, the e−−h+are formed, which are employed in photoreduction and photodegradation processes. In the photocatalysis process, the recombination of e−−h+hinders the reaction efficiency. To avoid this type of problem, a charge trapper centerα-Fe2O3which is present in mesoporous FeSiNST NFs enables suppression of the e−−h+ recombination. The charge trapper phenomenon occurred in both types of transition, i.e., d−d transition and charge transfer transition. In the d−d transition and charge transfer transition phenomena, the photogenerated electrons are trapped by Fe3+ center (Scheme 3). According to the crystalfield theory, the Fe d-orbitals are vacant during the oxidation/reduction reaction process. Therefore, this process is called the electron trapper process and the Fe3+inα-Fe
2O3NFs (FeSiNST NFs) is called the electron trapper center. Hence, both d−d transition and charge transfer transition phenomena are due to the presence ofα-Fe2O3in the FeSiNST NFs which aids in diminishing the e−−h+ recombination and enhancing the photoreduction of Cr(VI) and photodegradation of 4-NP and phenol. Hence mesoporous FeSiNST NFs display the highest photocatalysis performance in visible light (Figure 9). From the active species trapping test (Figure S10a), it is examined that the e−is the most active agent for the photoreduction of Cr(VI). The•OH is the active agent for the photodegradation of 4-NP and phenol (Figure S10b). Conclusively, efficient separation of e−− h+ has a vital role in the photocatalysis performance.
3.7.2. Recyclability, Stability, and Evidence of Cr(VI) Photoreduction and 4-NP Photodegradation. The recycla-bility, starecycla-bility, and evidence regarding Cr(VI) photoreduction by FeSiNST NFs are shown in Figure 10, parts a, b, and c, respectively. The recyclability experiment is executed in the optimum condition of the photoreduction of Cr(VI). After each run isfinished, the mesoporous FeSiNST NFs material is calcined at 450 °C in 5 h in order to remove impurity and make reborn the mesoporosity. The result is nearly similar up to the fourth consecutive run, indicating the reusability of the mesoporous FeSiNST NFs (Figure 10a). The stability test of mesoporous FeSiNST NFs was examined by the SEM image
after Cr(VI) photoreduction (Figure 10b). The NFs
Scheme 3. Possible Reaction Mechanism, Charge Separation, and e−−h+Transfer in Mesoporous FeSiNST NFs
morphology is observed in FeSiNST NFs after the photo-reduction of Cr(VI), proving a stable photocatalyst during photoreduction. The Cr 2p spectrum after Cr(VI) photo-reduction on FeSiNST NFs is presented inFigure 10c. The BEs at 579.4 and 586.6 eV are referred to the Cr 2p3/2and Cr 2p1/2, respectively, which are recommended to the Cr 2p in Cr(VI).54InFigure 10c, the BEs at 578.2 (Cr 2p3/2) and 588.2 eV (Cr 2p1/2) match the Cr 2p in Cr(III).55This is because of the existence of Cr(III) after the photoreduction of Cr(VI) by FeSiNST NFs. This result gives the evidence for complete photoreduction of Cr(VI) to Cr(III) during the photo-reduction process by FeSiNST NFs.Figure 10d describes the recyclability test of 4-NP photodegradation by FeSiNST NFs. The recyclability test is performed in the optimum condition of the 4-NP photodegradation, and after each run the FeSiNST NFs was calcined at 450°C in 5 h. The result shows that the photodegradation of 4-NP is nearly similar up to the fourth run, indicating the versatility and reusability of the FeSiNST NFs. The stability test of FeSiNST NFs is examined by the SEM image after 4-NP photodegradation (Figure 10e). The NFs morphology is observed in FeSiNST NFs after the photodegradation of 4-NP, indicating that the photocatalyst is stable during reaction.
4. CONCLUSION
PVP and CTAB template/surfactant mixed method is employed for the synthesis of mesoporosity within NFs in all synthesized NFs photocalysts by the electrospinning via sol− gel process. Formation of enriched mesoporosity within NFs is the important achievement in terms of morphology control. Mesoporosity within NFs provides superior SA, mechanical support, and smooth e−transport, which is the vital approach of the present study. Mesoporosity within NFs enhances the active sites for a proficient photocatalysis performance. The charge transfer phenomenon includes d−d transition and charge transfer transition enhancing e− and h+ separation effectively. This is the significant reason for an efficient photocatalysis performance. The red shifting and Ovs within photocatalysts increase the long-range light absorption proper-ties and suppress the e−−h+ recombination, respectively, also having a marvelous role in photocatalysis. It is established that, among all photocatalysts, mesoporous FeSiNST NFs have the highest photocatalytic activity. The recyclability and stability study in Cr(VI) photoreduction and 4-NP photodegradation support the stability and reusable nature of the FeSiNST NFs photocatalyst. The Cr(VI) photoreduction to Cr(III) by FeSiNST NFs is proved by XPS analysis. The increased photocatalysis activity by mesoporous FeSiNST NFs is
Figure 10.(a) Recycling study, (b) stability, and (c) evidence for photoreduction of Cr(VI) in optimum condition. (d) Recycling study and (e) stability of 4-NP photodegradation by mesoporous FeSiNST NFs in optimum condition.