Enhanced transmission and directivity from metallic subwavelength apertures with
nonuniform and nonperiodic grooves
Zhaofeng Li, Humeyra Caglayan, Evrim Colak, and Ekmel Ozbay
Citation: Appl. Phys. Lett. 92, 011128 (2008); doi: 10.1063/1.2829799 View online: http://dx.doi.org/10.1063/1.2829799
View Table of Contents: http://aip.scitation.org/toc/apl/92/1
Enhanced transmission and directivity from metallic subwavelength
apertures with nonuniform and nonperiodic grooves
Zhaofeng Li,a兲 Humeyra Caglayan, Evrim Colak, and Ekmel Ozbay
Nanotechnology Research Center, Department of Physics, and Department of Electrical and Electronics Engineering, Bilkent University, Bilkent, 06800 Ankara, Turkey
共Received 6 August 2007; accepted 9 December 2007; published online 11 January 2008兲 Nonuniform and nonperiodic grooves are used to enhance the transmission and directivity of emissions from a single metallic subwavelength aperture. By using nonuniform and nonperiodic grooves, the amplitude and phase of the diffracted power flow from each groove can be adjusted properly. As a result, the transmission and emission directivity can be further improved when compared to apertures with uniform and periodic grooves. Our experimental results are in good agreement with the finite difference time domain simulation results. © 2008 American Institute of Physics. 关DOI:10.1063/1.2829799兴
Recently, enhanced transmission and beaming light emission from a subwavelength aperture surrounded by pe-riodic corrugations in a metallic film brought about much attention.1,2This phenomenon breaks the limits of homoge-neous diffraction and poor transmission through a subwave-length aperture, and might benefit many applications. There were several theoretical and experimental works that dis-cussed the underlying physics and methods to optimize the enhancement of transmission and directional emission.3–5 Meanwhile, similar studies were carried out at microwave frequencies.6–11 So far, all of the reports on this topic use periodic and uniform grooves, which might be intuitively thought to be the best choice. However, in the present paper, we show that periodic and uniform grooves might not be the best choice for the enhancement transmission and/or direc-tional emission. Instead, by using nonuniform and nonperi-odic grooves, the diffracted fields generated from each groove can be adjusted properly, which results in further im-proved transmission and emission directivity.
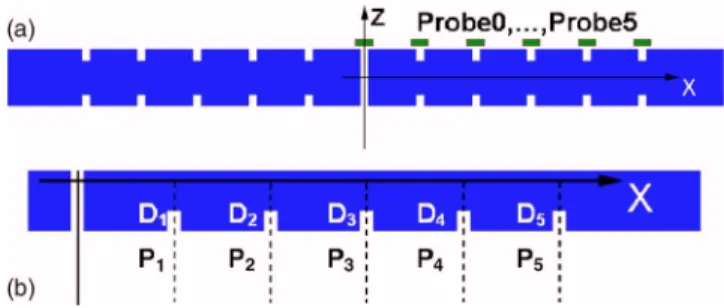
Figure 1共a兲shows a metal 共aluminum兲 plate 共thickness t = 16 mm兲 with a subwavelength aperture 共with its width w = 2 mm兲. Arrays of grooves are seen on both sides of the plate. All of the grooves have the same width of w = 2 mm, which is equal to the width of the aperture. This structure is similar to the structure in our previous study.7 In Fig.1共b兲, there are several parameters that determine the depth and position of the grooves. Since the structures studied here are symmetric about the x and z axes, we only depict a quarter of the structures. Pi共i=1, ... ,5兲 is the position of every groove,
while Diis the depth. In the present study, a two-dimensional
finite difference time domain simulation is carried out to cal-culate the transmission spectra by using commercial software 共FULLWAVE兲. The space and time steps are set at ⌬x=⌬z
= 0.2 mm, and c⌬t=0.1 mm, respectively, where c is the ve-locity of light in air. Perfectly matched layer boundary con-ditions are employed to absorb the waves that are reflected from the calculation boundaries. In the simulation, an elec-tromagnetic共EM兲 plane wave with a H field polarized in the y direction is incident from the bottom. After the field passes through the aperture, it emits in the +z direction. The trans-mission spectrum is evaluated by integrating the power flow
along the cross section of the aperture. Moreover, at a spe-cific frequency, we use six power flow probes共probes 0–5兲 on the top of the aperture and grooves in order to monitor the amplitude and phase of the power flow contributed by the aperture and each groove. The distance between the probes and grooves is 2 mm.
Now, let us consider a structure with grooves that is uniform and periodic. In this structure, the period of the grooves is set to at 16 mm共the same period as in our previ-ous study7兲. Now, we set out to find the optimal value of the groove depth D 共D=D1= D2= D3= D4= D5兲, which
corre-sponds to the highest transmission. Figure2shows the trans-mission spectra for structures with different depths, from which it is seen that when D = 3 mm, the transmission spec-trum has the highest peak at frequency f = 15.96 GHz. Ac-cordingly, we denote this structure with D = 3 mm as case 1, and summarize its parameters in TableI. In order to under-stand the characteristics of the enhanced transmission at f = 15.96 GHz, we calculated the amplitudes and phases of the power flows at the z direction that was contributed by the aperture and each groove, the field intensity distribution, and the far field pattern of the emission. Figure3共a兲shows the time-varied power flows that were generated from the aper-ture and each groove from which we can obtain information of amplitudes and phases. One can see that the power flows vary between positive and negative values, which is the re-sult of the inclusion of vortex waves generated at the surface
a兲Electronic mail: [email protected].
FIG. 1.共Color online兲 共a兲 Schematic of a metallic 共aluminum兲 plate with a subwavelength aperture in the middle. On both sides of the plate, there are grooves surrounding the aperture. Above the aperture and grooves, there are six probes to monitor the power flows in the z direction.共b兲 A quarter of the schematic of共a兲 which shows the parameters that define the depth and position of the grooves.
APPLIED PHYSICS LETTERS 92, 011128共2008兲
of the plate.12However, this did not affect our analysis. From Fig.3共a兲, it can be seen that, if the groove is located farther away from the aperture, the amplitude of the power flow from the same groove is much lower than that of the grooves closer to the aperture. In addition, the phases of the power flows are different from each other. The phase of the power flow from grooves that are farther away from the aperture is more advanced when compared to the phase of the power flow from grooves that are closer to the aperture. Intuitively, one expects that this phase difference will result in a focus on the emission pattern. Figure4共a兲shows the field intensity distribution of the emission field at f = 15.96 GHz. A focus at a distance of approximately 30 cm can be clearly seen, which verifies our expectation. The far field pattern is shown in Fig.4共b兲with a full width at half maximum 共FWHM兲 of a 9.9°.
Since we have shown that in the structure of case 1, the phases of the power flow generated from the grooves do not match, one can expect an improvement in the transmission and/or directivity of the emission field by designing a ture with uniphase grooves. In order to design such a struc-ture, we adjusted the positions of the grooves based on the structure of case 1 to match the phases of the power flow at each groove for f = 15.96 GHz. During the position adjust-ment, the depth of the grooves were kept constant. We de-note this structure as case 2 and summarize its parameters in TableI. Figure3共b兲shows the time-varied power flows gen-erated from the aperture and each groove. When we compare the results of case 2关Fig.3共b兲兴 with that of case 1 关Fig.3共a兲兴, it can be seen that the phases of the power flow match quite well in case 2. So, the introduction of nonperiodic grooves resulted in a power flow that was phase matched at each groove. However, at the same time, the amplitudes of the power flow declined slightly. This is especially true for
grooves that are farther away from the aperture. The decline of the amplitudes will result in lower transmission, just as the data shown in TableI. In fact, this decline can also be seen in the field intensity distribution plotted in Fig. 4共a兲 at f = 15.96 GHz. Figure 4共b兲 shows the far field pattern of the emission field. It can be seen that the FWHM reduced to 8.7° compared to case 1 of 9.9°. Nonetheless, comparing the far field pattern of cases 1 and 2, one finds that the side lobes of case 2 are higher than case 1. To conclude the structure of case 2, we should say that this structure improved the directivity of the emission field at the cost of transmission efficiency.
We then looked for a structure where we can both im-prove the transmission and directivity simultaneously. For this purpose, we used nonuniform grooves that have different depths. At a fixed frequency, the grooves with different depths have different diffraction characteristics for an inci-dent EM wave 共detailed description will be presented else-where兲. Let us consider the grooves on the incident side of the metal plate. If we set the grooves near the aperture such that they have lower diffraction ability, it is then possible to allow more energy that is diffracted by the grooves away from the aperture to reach the aperture. Conversely, for the emission side, this, in turn, will result in increased power for the EM waves that can reach the grooves away from the aperture, which can be helpful to narrow the emission beam. Based on the above considerations, we adjusted the depth and the position of the grooves. This structure is denoted as case 3 and the parameters are summarized in TableI. Figure 3共c兲shows the time-varied power flows generated from the aperture and each groove. For the phases, it is noteworthy that we did not make it fully match, as in case 2, because we
TABLE I. The structure parameters of three cases and the power transmissions at the peak frequency f = 15.96 GHz of case 1. Note that the power transmissions are normalized to a value of case 1.
D1 共mm兲 D2 共mm兲 D3 共mm兲 D4 共mm兲 D5 共mm兲 P1 共mm兲 P2 共mm兲 P3 共mm兲 P4 共mm兲 P5 共mm兲 Transmission at f = 15.96 GHz Case 1 3.0 3.0 3.0 3.0 3.0 16 32 48 64 80 1 Case 2 3.0 3.0 3.0 3.0 3.0 15 32.6 51 69.6 88.6 0.91 Case 3 2.4 2.6 2.8 3.0 3.4 17 33.8 51 68.6 86.2 1.23
FIG. 2. 共Color online兲 The transmission spectra of case 1 structure with different groove depths.
FIG. 3. 共Color online兲 共a兲, 共b兲, and 共c兲 are the time-varied power flows generated by the aperture and grooves for cases 1, 2, and 3 structures, respectively.
made a trade-off between improving the directivity and sup-pressing the sidelobe in the far field pattern. By comparing Figs.3共c兲and3共a兲, it can be seen that most of the amplitudes of the power flow for case 3 are slightly increased when compared to case 1. This increase of amplitude results in an improved transmission, which is now higher than case 1, as shown by the data in Table I. Figure 4共a兲 shows the field intensity distribution of the emission field at f = 15.96 GHz, which confirms the improvement of the transmission. The far field pattern is plotted in Fig.4共b兲with its FWHM at 7.2°. It can be seen that the sidelobes are suppressed effectively when compared to case 2. Therefore, we obtained a structure 共case 3兲 that simultaneously has higher transmission and bet-ter directivity than that of case 1.
It is well known that the surface wave is the key factor for funneling EM wave through the subwavelength aperture and beaming the wave from the aperture.3,4 It is noteworthy that by using a uniform and periodic groove array, the in-coming EM wave can be converted into surface waves more efficient than using a nonperiodic one. However, these sur-face waves will propagate evenly in two opposite directions. Only the surface wave propagating toward the aperture is helpful to the funneling effect, while the surface wave in the opposite direction is mostly wasted. By using a nonuniform and nonperiodic structures, it is possible to increase the sur-face wave toward the aperture while suppress the sursur-face wave which is leaving the aperture 共detailed data will be presented elsewhere兲. Consequently, a nonuniform and non-periodic groove array is possibly more efficient than a uni-form and periodic one to enhance transmission through a subwavelength aperture.
To verify the above simulation results, we conducted ex-periments for the three structures. In the experiment, a HP-8510C network analyzer was used to excite a horn antenna to obtain an incident EM field. Another horn antenna that was connected to the same network analyzer was used to receive and measure the power emitted from the aperture. Since it is difficult to measure the fields in the aperture, we measure the field intensities along the z axis. Figure5共a兲shows the mea-sured data 共discrete one兲 together with the simulated data 共solid lines兲. One can see that the experimental data agree well with the simulation results. Figure5共b兲shows the mea-sured far field patterns for the three cases. The FWHMs of cases 1, 2, and 3 are 10.3°, 9.0°, and 7.3°, respectively. The FWHMs of the measured data are slightly larger than the
calculated results. This might result from the fact that while the structure and the experiments were made in three dimen-sions, the simulations were carried out on a two-dimensional structure. Additionally, considering other factors such as the manufacturing precision of the samples, the measurement of far field radiation pattern, etc., the experimental patterns are in good agreement with the calculated results shown in Fig.4共b兲.
In summary, we demonstrated that a uniform and peri-odic groove structure might not be the best choice for the enhanced transmission and directional emission from a me-tallic subwavelength aperture. By using a nonuniform and nonperiodic groove structure, it is possible to adjust the am-plitudes and phases of the power flows that are generated from each groove properly. As a result, the transmission and directivity can simultaneously be further improved. Our ex-perimental results confirm our simulation results rather well.
This work was supported by the European Union under the projects EU-NoE-METAMORPHOSE, EU-NoE-PHOREMOST, and TUBITAK under Project No. 105E066, 105A005, 106E198, and 106A017. One of the authors共E.O.兲 also acknowledges partial support from the Turkish Academy of Sciences.
1T. Thio, K. M. Pellerin, R. A. Linke, H. J. Lezec, and T. W. Ebbesen, Opt. Lett. 26, 1972共2001兲.
2H. J. Lezec, A. Degiron, B. Devaux, R. A. Linke, L. Martin-Moreno, F. J. Garcia-Vidal, and T. W. Ebbesen, Science 297, 820共2002兲.
3L. Martin-Moreno, F. J. Garcia-Vidal, H. J. Lezec, A. Degiron, and T. W. Ebbesen, Phys. Rev. Lett. 90, 167401共2003兲.
4F. J. Garcia-Vidal, H. J. Lezec, T. W. Ebbesen, and L. Martin-Moreno, Phys. Rev. Lett. 90, 213901共2003兲.
5L.-B. Yu, D.-Z. Lin, Y.-C. Chen, Y.-C. Chang, K.-T. Huang, J.-W. Liaw, J.-T. Yeh, J.-M. Liu, C.-S. Yeh, and C.-K. Lee, Phys. Rev. B 71, 041405共R兲 共2005兲.
6M. J. Lockyear, A. P. Hibbins, J. R. Sambles, and C. R. Lawrence, Appl. Phys. Lett. 84, 2040共2004兲.
7S. Sena Akarca-Biyikli, I. Bulu, and E. Ozbay, Appl. Phys. Lett. 85, 1098 共2004兲.
8S. Sena Akarca-Biyikli, I. Bulu, and E. Ozbay, J. Opt. A, Pure Appl. Opt.
7, S159共2005兲.
9H. Caglayan, and I. Bulu, and E. Ozbay, Opt. Express 13, 1666共2005兲. 10H. Caglayan, I. Bulu, and E. Ozbay, J. Opt. Soc. Am. B 23, 419共2006兲. 11H. Caglayan, I. Bulu, and E. Ozbay, Microwave Opt. Technol. Lett. 48,
2491共2006兲.
12R. Gordon, Phys. Rev. B 75, 193401共2007兲. FIG. 4.共Color online兲 共a兲 The H field intensity distributions of emissions at
frequency of 15.96 GHz for cases 1, 2, and 3 structures, respectively.共b兲 The far field patterns for the three cases. The FWHMs of cases 1, 2, and 3 are 9.9°, 8.7°, and 7.2°, respectively.
FIG. 5.共Color online兲 共a兲 The field intensity along the z axis at a frequency of 15.96 GHz. The solid lines are simulation data, while the discrete dots are measured data. The measured data are normalized by setting the value of case 1 at 180 cm to be equal to the value of simulation.共b兲 The measured far field patterns of three case structure. The measured FWHMs of cases 1, 2, and 3 are 10.3°, 9.0°, and 7.3°, respectively.