www.arccjournals.com/www.legumeresearch.in
*Corresponding author’s e-mail: [email protected]
1Program of Field Crops, Vocational School of Higher Education, University of Bingol, Turkey. 2Department of Animal Science, Faculty of Agriculture, University of Bingol, Turkey. 3Department of Field Crops, Faculty of Agriculture, University of Bingol, Turkey. Print ISSN:0250-5371 / Online ISSN:0976-0571
DOI:10.18805/lr.v0iOF.11183
Analysis of some plant measures of narbon vetch (Vicia narbonensis L.)
effecting plant length using path analysis
Adil Bakoglu1, Senol Celik2 and Kagan Kokten*3
Program of Field Crops, Vocational School of Higher Education, University of Bingol, Turkey.
Received: 12-03-2016 Accepted: 23-05-2016
ABSTRACT
The direct and indirect effects of sizes of fresh stem weight, dry stem weight, fresh leafweight, dry leaf weighton plant height of narbon vetch were in vestigated using path analysis in Bingol in 2014-15 years. The plant measures of narbon vetch between 4 and 6 weeks of planting were used.The results showed that the highest correlations at 5 week narbon vetch were determined between plant length and respectively dry stem weightand fresh stem weight(r =0.849 and r =0.824). The direct effects of fresh stem weight, dry stem weight, fresh leaf weight, dry leaf weight on plant length at 6 week narbon vetcies were determined respectively as 51.341%, 50.148%, 37.782%, and 24.276%, respectively. As a result, fresh stem weight, dry stem weight were the most efficient characters on plant length and it was concluded that these characters could be considered as significant selection criterias in narbon vetch breeding for yield under that the conditions.
Key words: Correlation, Narbon vetch, Path analysis, Plant measurement. INTRODUCTION
Vetch (Vicia spp.), which includes numerous species, is a good forage crop, grazing crop, green manure crop, an alternation crop as well as being effective in preventing erosion (Soya et al., 2004). Vetch is an annual forage legume and is widely used as weed and grains in feeding of farm animals in many regions of the world (Ramos
et al., 2000; Acikgoz, 2001; Cabellero et al., 2001;
Chowdhurry et al., 2001).
Narbon vetch (Vicia narbonensis L.), which is quite similar to broad bean, is cultivated for both its weed and grains (Soya et al., 2004). Narbon vetch has naturally ranged over Central Europe tosia Minor. In our country, it is available in every region except Northeast Anatolia (Davis, 1970). The narbon vetch is grown as a dual purpose crop for animal feed and human nutrition in Syria, Northern Iraq and parts of Turkey (Bennett et al., 1997). It is a fast growing crop, with vigorous regrowth.
Correlations express the level of dependence among traits, and out of numerous correlation coefficients it is difficult to determine the actual mutual effects among traits. Path analysis provides better study of the nature of such interdependence, while path coefficients serve as an effective parameter for the impact analysis of traits which have an important effect in forming the given correlations. This method enables more quality and full insight into relations existing among the studied traits, more precise establishment of cause effect connections among them, as well as to
separate direct from indirect effects of any particular trait on dependent variable (Ikanovic et al., 2011). Path analysis is important as determining minimum and maximum directly and indirectly effective of various plant features on plants length in narbon vetch.
A positive relationship was found between grain yield and plant lentgh, biological yield, 1000 grains weight and broad bean length, the number of sub branches and the grain number in broad bean; a negative relationship was found between grain yield and the number of broad beans in plant (Buyukburç and Iptas, 2001); it was also found that there was a high and positive relationship between grain yield and harvest index and biological yield and plant length (Turk
et al., 2008).
Path coefficient results showed that 100-seed weight had the highest direct effect on yield which was positive. This was followed by the pod length plant-1, number
of leaves, and leaf area while plant height plant-1 had negative
direct effect but very high. Number of pod plant-1 had the
lowest direct effect on yield (Udensi and Ikpeme, 2012). Since variables have both direct and indirect effects on dependent variables their path coefficients have to be found (Güler et al., 2001; Edwards and Lambert, 2007). It is important to choose productive genotypes in plant breeding in order to know direct and indirect effects of other characteristics on plant length in narbon vetch. Generally, selection criteria according to the results obtained from path analysis in plant characteristics is suggested. Prasad et al.
(2001) suggested the use of selection criteria in accordance 1000 grains weight, number of effective plant, number of fertile grains and yield/plant according to path coefficient analysis.
The aim of this study is to analyse the direct and indirect effects of withers height, rump height, body length, chest peripheral, head length and leg length on plant length of vetch through path analysis.
MATERIALS AND METHODS
This study was conducted in Bingol University Faculty of Agriculture Research and Application field, in 2014 and 2015. The study area was located at 41° 20' and 39° 54' N latitude and 38° 27' and 40° 27' E longitude in the agricultural research farm of Bingol University, Bingol, Turkey. This land has an elevation of about 1151 m. Bingol has terrestrial climatic character in the East Anatolia region. The average temperature from May to September was 23.1 °C, and total rainfall was 157.7 mm in 2014 year. The same period for 2015 year average temperature was 23.6 °C, and rainfall was 30.7 mm. Soil in a depth of 30 cm was sampled before the start of the experiment. Soil was lowed in organic matter (1.26%), medium acid in (pH: 6.37), low in calcium carbonate (0.15%) and high in P (79.1 kg ha-1 P
2O5) and low
amount of in K2O (24.5 kg ha-1) contest. Randomized
complete block design with three replications was used. Nrbon vetch genotypes used in experiment were IFVN 564-SEL 2379, IFVN 565 564-SEL 2380, IFVN 575 564-SEL 2389, IFVN 567 SEL 2382, IFVN 116-SEL 2461, IFVN 562-SEL 2470, TARMAN, HALILBEY, KARAKAYA and GORKEM.
The plant length, dry stem weight and dry leaf weight were measured on a weekly basis in two years, starting approximately November, and measurements were taken for 6 weeks. Measurements were made by collecting three plants from each parcel. Calculations were made over 2 years average of plant length (cm), dry stem weight - fresh stem weight (g) and dry leaf weight- fresh leaf weight (g) variables’ mean values. Direct and indirect effects of the characteristics of dry stem weight (g), fresh stem weight (g), dry leaf weight (g) and fresh leaf weight (g) on plant length (cm) were investigated. Path analysis was used to study on these effects. The path coefficient suggested by Sewall Wright in 1921 was defined as part of standard deviation of the dependent variable resulting from independent variable while independent variables are fixed except for variable, of which effect could be determined (MacKinnon, 2008). Correlation coefficients and the path coefficient analysis was conducted following the procedure developed by Khan et al. (2003) and applied by Rauf et al. (2004). Path analysis has been used in various science areas especially in agriculture for purpose of determination the interactions between efficiency and efficiency elements. For path analysis, one usually has to confine one self to selecting variables considered possibly of explanatory value, one is unlikely to include a variable of
no apparent significance but only seeming to increase the explanatory significance of another variable (Maassen and Bakker, 2001).
Path coefficient is a standardized partial regression coefficient that measures the direct influence of one trait upon another and permits the separation of acorrelation coefficient into components of direct and indirect effects (Board et al., 1997). It provide a tutorial illustrating anapproach to estimation of and inference about direct, indirect, and total effects in statistical mediation analysis with a multicategorical independent variable (Hayes and Preacher, 2014). For this reason, analysis should be carried out after the cause and effect relationships between the variables have been determined by researcher (Preacher and Hayes, 2004). In path analysis, each dependent variable is analyzed with each independent variable, and multiple regression analysis are performed for this analysis. In fact, path analysis is an extended form of multiple regression analysis. The path coefficientsmust be known to make path analysis. A path coefficient is a standardized regression coefficientrevealing the direct effect of the independent variable on a dependent variable of path model (Alpar, 2011). Regression analysis and correlation analysis are insufficient to determine the direct and indirect relations between variables together. In this case, through path analysis, importance and size of the direct and indirect causal relations between variables can be estimated (Bal and Dogan, 2000). The equation series in equality (1) consisting of path and correlation coefficients are formed (Hu and Wang, 2001; Li
et al., 2005). The direct and indirect effects are estimated
through the solution of these equation.The equation system consisted of path and correlation coefficients to estimate these effectsis given in equation (2).
(1)
Here, while , , , and parameters indicate direct effects of Xs on Ys, indicates the indirect effect of X1 on X2 (Wright, 1968).
In equation system (1), the correlations between independent variables and the correlations between independent variables and dependent variable was known. The path coefficients can be calculated depending onthese correlations. To do this, multiple equation system is written in matrix form. While correlation matrix related to independent variables is indicated by A, vector consisting
of the correlations between independent variables and dependent variable is indicated by B, and path coefficient is indicated by P, then the matrix form is stated as in Table 2 (Bal and Dogan, 2000).
-1
P = A B
(2)
Here, -1
A is the inverse of A matrix.
By taking into account the direct effects of independent variables, the indirect effects of these variables on the dependent variable can be calculated. To do this, the path coefficients produced by benefiting from multiple equation system stated in equation (1) are multiplied by the correlation matrix consisted of diagonal matrix and independent variables and accordingly, matrix given in equation (3), consisting of indirect effects, is created.
(3)
The diyagonal values in the matrix on the left of equation (3) indicate path coefficients, in other words, the direct effects; the values other than the diagonal argument indicate indirect effects interaction of independent values.
RESULTS AND DISCUSSION
The identifier statistics about the plant length of narbon vetch according to weeks, plant length (Y), withers height (X1), rump height (X2), body length (X3), and chest peripheral (X4) are given in Table 1.
Standardized multiple regression models relating to the body sizes of dogs, such as plant length (Y), fresh stem weight (X1), dry stem weight (X2), fresh leaf weight (X3), and dry leaf weight (X4), were respectively determined as given below. The number of these regression models are four, including seperately from 4 to 6 week.
Y1 Y1 12 Y1 13 Y1 14 Y1 12 13 14 Y2 21 Y2 Y2 23 Y2 24 Y2 21 23 24 Y3 31 Y3 32 Y3 Y3 34 Y3 31 32 34 Y4 41 Y4 42 Y4 43 Y4 Y4 41 42 43 P P r P r P r P 0 0 0 1 r r r P r P P r P r 0 P 0 0 r 1 r r = P r P r P P r 0 0 P 0 r r 1 r P r P r P r P 0 0 0 P r r r 1 4 week (n=30) 5 week (n=30) 6 week (n=30) Variables
X
s
xX
s
xX
s
x PL 24.48 0.60 24.29 0.73 33.60 1.13 FSW 2.26 0.15 2.38 0.19 2.07 0.12 DSW 1.62 1.04 0.49 0.04 1.13 0.06 FLW 3.00 0.18 2.99 0.21 2.60 0.21 DLW 1.36 0.62 0.70 0.05 1.39 0.10Table 1: The identifier statistics related with various body sizes at
dogs
X: Average, sx: Standard error, n: Number of plants, PL: Plant length, FSW: Fresh Stem Weight, DSW: Dry Stem Weight, FLW: Fresh Leaf Weight, DLW: Dry Leaf Weight,
Here, since the coefficients were standardized, constantterm yielded as zero. The partial regression coefficients in this equation indicate the direct effects of each variable, such as plant length (Y), fresh stem weight, dry stem weight, fresh leaf weight, and dry leaf weight, on plant length, which is the result variable. Standardized and normal regression coefficients, standard error, t statistics and significance levels are given in Table 2 separately for every age group from 4 to 6 old weeks.
So as to determine the direct and indirect effects of plant specifications affecting the plant length, equation system given in equation (2) is solved using of path and correlation coefficients defined in equation (1). In the
equation system, the inverse of the correlation matrix between the independent variablesis multiplied with dependent variable and vector consisting of correlation coefficientsbetween independent variables, and accordingly, path coefficients vector, in other words, direct effect quantities belonging to related independent variables are produced. In order to establish the matrix consisting of the dir ect and indirect effects, path coefficients vector ismultiplied with correlation matrix formed by correlation between independent variables. In the resulting 4*4 dimensional matrix, the diagonal values are path coefficients creating effect directly. The values other than diyagonal are the interacted indirect effects of independent variables. The correlation coefficients given in Table 3 were replaced in equation (1) and there upon, the equations given below were created. Firstly, the equations were given for all vetches.
-By converting this equation system into the matrix form specified in equation (2), path coefficients were calculated as follows:
The indirect effects affecting plant length at 4 week narbon vetch,
Similarly, path coefficients for 5 week narbon vetch, -1 2 3 4 1 YX YX -1 YX YX P 1 0.158 0.920 -0.212 0.122 0.016 P 0.158 1 0.208 0.034 0.123 0.101 P = A B= = * P 0.920 0.208 1 0.234 0.134 0.078 0.212 0.034 0.234 1 0.106 0.088 P 0.016 0 0 0 1 0.158 0.920 -0.212 0.016 0.025 0.015 0.003 0 0.101 0 0 0.158 1 0.208 0.034 0.016 0.101 0.021 0.003 * 0 0 0.078 0 0.920 0.208 1 0.234 0.072 0.016 0.078 0.018 0 0 0 0.088 0.212 0.034 0.234 1 0.019 0.0 03 0.021 0.088
Table 2: The results of the regression analysis of plantlength in narbon vetch 4 week old plants
Constant FSW DSW FLW DLW Coefficient 23.566 0.054 0.059 0.267 -0.078 Standard error 2.167 2.003 0.117 1.666 0.197 Beta 0.013 0.101 0.082 -0.080 t 10.874 0.027 0.501 0.160 -0.398 P 0.000 0.979 0.621 0.874 0.694
5 week old plants
Constant FSW DSW FLW DLW Coefficient 16.249 0.498 13.887 -2.575 11.104 Standard error 1.373 2.827 9.864 2.367 9.497 Beta 0.130 0.718 -0.733 0.729 t 11.831 0.176 1.408 -1.088 1.169 P 0.000 0.862 0.171 0.287 0.253
6 week old plants
Constant FSW DSW FLW DLW Coefficient 21.798 2.546 -0.369 1.082 2.983 Standard error 3.986 2.785 4.172 1.312 2.160 Beta 0.269 -0.020 0.200 0.257 t 5.468 0.914 -0.088 0.825 1.381 P 0.000 0.369 0.930 0.417 0.179 1 2 3 4 1 YX YX YX YX P 1 0.973 0.953 0.953 0.824 0.073 P 0.973 1 0.894 0.906 0.849 0.823 = * P 0.953 0.894 1 0.895 0.751 0.192 0.953 0.906 0.985 1 0.781 0.140 P 0.073 0 0 0 1 0.973 0.953 0.953 0.073 0.071 0.070 0.070 0 0.823 0 0 0.973 1 0.894 0.906 0.801 0.823 0.736 0.746 * 0 0 0.192 0 0.953 0.894 1 0.895 0.183 0.172 0.192 0.189 0 0 0 0.140 0.953 0.906 0.985 1 0.133 0.127 0.127 0.140
The indirect effects affecting live weight at 5 week narbon vetch,
Path coefficients for 6 week narbon vetch,
1 2 3 4 1 Y X Y X Y X Y X P 1 0 .6 3 2 0 .6 8 8 0 .4 0 8 0 .4 9 8 0 .2 6 8 P 0 .6 3 2 1 0 .2 6 1 0 .3 7 8 0 .2 9 9 0 .0 1 9 = * P 0 .6 8 8 0 .2 6 1 1 0 .3 8 4 0 .4 7 8 0 .2 0 0 0 .4 0 8 0 .3 7 8 0 .3 8 4 1 0 .4 3 5 0 .2 5 6 P
The indirect effects affecting live weight at 6week narbon vetch,
Path coefficients are the regression coefficients belonging to standardized data given in Table 2. The regression coefficients have a direct effect on the dependent variable. The values of these resulting effects belonging to week range between 4 and 6 are given in Table 4.
The correlation coefficients and significance levels belonging to the variables examined at vetchs are given inTable 3. The correlation coefficients between plant length and fresh stem weight, dry stem weight, fresh leaf weight, and dry leaf weight were determined as unsignificant statistically at 4wekvetch. The correlation coefficients between plant length and fresh stem weight, dry stem weight, fresh leaf weight, and dry leaf weight were determined as significant statistically at 5 week vetch (P<0.01). The correlation coefficients between plant length and fresh stem weight, fresh leaf weight, and dry leaf weightwere determined as significant statisticallyat 6 week vetch (P<0.01).
When Model parameters were examined it was seen that, when fresh stem weight was changed one unit,plant length was change 0.016 unit, when dry stem weight, fresh leaf weight, dry leaf weight were changed one unit, plant length was change respectively 0.025, 0.015 and -0.003 unit at 4weeknarbon vetch. When fresh stem weight, dry stem weight, fresh leaf weight, dry leaf weight were changed one unit, plant length was change respectively 0.073, 0.071, 0.070
0.268 0 0 0 1 0.632 0.688 0.408 0.268 0.169 0.184 0.109 0 0.019 0 0 0.632 1 0.261 0.378 0.012 0.019 0.005 0.007 * 0 0 0.200 0 0.688 0.261 1 0.384 0.138 0.052 0.200 0.077 0 0 0 0.256 0.408 0.378 0.384 1 0.104 0.097 0.0 98 0.256
Table 3. The correlation coefficients between the variables examined in vetch 4 week Y X1 X2 X3 X1 0.122 X2 0.123 0.158 X3 0.134 0.920** 0.208 X4 -0.106 -0.212 -0.034 -0.234 5 week Y X1 X2 X3 X1 0.824** X2 0.849** 0.973** X3 0.751** 0.953** 0.894** X4 0.781** 0.953** 0.906** 0.985** 6 week Y X1 X2 X3 X1 0.498** X2 0.299 0.632** X3 0.478** 0.688** 0.261 X4 0.435** 0.408** 0.378* 0.384* * P<0.05; ** P<0.01
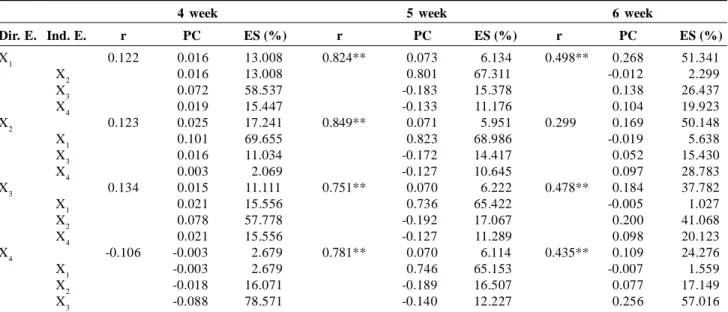
Table 4: Direct and indirect effects of plant length at narbon vetch.
4 week 5 week 6 week
Dir. E. Ind. E. r PC ES (%) r PC ES (%) r PC ES (%) X1 0.122 0.016 13.008 0.824** 0.073 6.134 0.498** 0.268 51.341 X2 0.016 13.008 0.801 67.311 -0.012 2.299 X3 0.072 58.537 -0.183 15.378 0.138 26.437 X4 0.019 15.447 -0.133 11.176 0.104 19.923 X2 0.123 0.025 17.241 0.849** 0.071 5.951 0.299 0.169 50.148 X1 0.101 69.655 0.823 68.986 -0.019 5.638 X3 0.016 11.034 -0.172 14.417 0.052 15.430 X4 0.003 2.069 -0.127 10.645 0.097 28.783 X3 0.134 0.015 11.111 0.751** 0.070 6.222 0.478** 0.184 37.782 X1 0.021 15.556 0.736 65.422 -0.005 1.027 X2 0.078 57.778 -0.192 17.067 0.200 41.068 X4 0.021 15.556 -0.127 11.289 0.098 20.123 X4 -0.106 -0.003 2.679 0.781** 0.070 6.114 0.435** 0.109 24.276 X1 -0.003 2.679 0.746 65.153 -0.007 1.559 X2 -0.018 16.071 -0.189 16.507 0.077 17.149 X3 -0.088 78.571 -0.140 12.227 0.256 57.016
* P<0.05, ** P<0.01; Dir. E.: Direct effect; Ind. E.: Indirect effect; r: Correlation coefficient; PC: Path coefficient; E. S. (%): Effect share; X1: Fresh stem weight; X2: Dry stem weight; X3: Fresh leaf weight; X4: Dry leaf weight.
and -0.070 unit at 5 week narbon vetch. When fresh stem weight, dry stem weight, fresh leaf weight, dry leaf weight were changed one unit, plant length was change respectively 0.268, 0.169, 0.184 and 0.109 unit at 6 week narbon vetch. These changes are direct effects.
The correlation description shares are given as effect share (%). The correlation coefficient between plant length and fresh stem weightwas determined as 0.122at4 week narbon vetchs. When this correlation was separated into the elements, the indirect effects of fresh stem weight on plant measures were determined as follows: on dry stem weight is 0.016 with 13.008% ratio; on fresh leaf weight is 0.072 with 58.537% ratio; on dry leaf weight is 0.019 with 15.447% ratio. The correlation coefficient between plant length and dry stem weight was calculated as 0.123. When
this correlation was separated into the elements, the indirect effects of dry stem weight on plant measures were determined as follows: on fresh stem weight is 0.101 with 69.655% ratio; on fresh leaf weight is 0.016 with 11.034% ratio; on dry leaf weight is 0.003 with 2.069% ratio. The correlation coefficient between plant length and fresh leaf weight was calculated as 0.134. When this correlation was separated into the elements, the indirect effects of fresh leaf weight on plant length, such as, fresh stem weight, dry stem weight, dry leaf weight were determined respectively as 15.556, 57.778, and 15.556 on percent basis. The correlation coefficient between plant length and dry leaf weight was calculated as -0.106. When this correlation was separated into the elements, the indirect effects of dry leaf weighton plant length, such as, fresh stem weight, dry stem weight, fresh leaf weight were determined respectively as 2.679, 16.071and 78.571 on percent basis.
The correlation coefficient between plant length and fresh stem weight was determined as 0.824 at 5 week narbon vetch. When this correlation was separated into the elements, the indirect effects of fresh stem weight on plant measures were determined as follows: on dry stem weight is 0.801 with 67.311% ratio; on fresh leaf weight is -0.183 with 15.378% ratio; on dry leaf weight is -0.133with 11.176% ratio. The correlation coefficient between plant length and dry stem weight was calculated as 0.849. When this correlation was separated into the elements, the indirect effects of dry stem weight on plant measures were determined as follows: on fresh stem weight is 0.823 with 68.986% ratio; on fresh leaf weight is -0.172 with 14.417% ratio; on dry leaf weight is -0.127 with 10.645%ratio. The correlation coefficient between plant length and fresh leaf weight was calculated as 0.751. When this correlation was separated into the elements, the indirect effects of fresh leaf weight on
plant length, such as, fresh stem weight, dry stem weight, dry leaf weight were determined respectively as 65.422, 17.067 and 11.289 on percent basis. The correlation coefficient between plant length and dry leaf weight was calculated as 0.781. When this correlation was separated into the elements, the indirect effects of dry leaf weight on plant length, such as, fresh stem weight, dry stem weight, fresh leaf weight were determined respectively as 65.153, 16.507 and 12.227 on percent basis.
The correlation coefficient between plant length and fresh stem weight was determined as 0.498 at 6 week vetchs. When this correlation was separated into the elements, the indirect effects of fresh stem weight on plant measures were determined as follows: on dry stem weight is -0.012 with 2.299% ratio; on fresh leaf weight is 0.138 with 26.437% ratio; on dry leaf weight is 0.104 with 19.923% ratio. The correlation coefficient between plant length and dry stem weight was calculated as 0.299. When this correlation was separated into the elements, the indirect effects of dry stem weight on plant measures were determined as follows: on fresh stem weight is -0.019 with 5.638% ratio; on fresh leaf weight is 0.052 with 15.430% ratio; on dry leaf weight is 0.097 with 8.783% ratio. The correlation coefficient between plant length and fresh leaf weight was calculated as 0.478. When this correlation was separated into the elements, the indirect effects of fresh leaf weight on plant length, such as, fresh stem weight, dry stem weight, dry leaf weight were determined respectively as 1.027, 41.068 and 20.123 on percent basis. The correlation coefficient between plant length and dry leaf weight was calculated as 0.435. When this correlation was separated into the elements, the indirect effects of dry leaf weight on plant length, such as, fresh stem weight, dry stem weight, fresh leaf weight were determined respectively as 1.559, 17.149 and 57.016 on percent basis. Chandirakala and Subbaraman (2010) found out that 100 seed weight, days to maturity, days to 50 per cent flowering, pod length and seeds per pod had high positive direct effect on seed yield in Pigeonpea. Goksoy ve Turan (2003) determined grain number (75.3%) and 1000 grains number (64.9%) had the biggest direct effect on sunflower grain yield with the help of path analysis. Yucel (2004) used path analysis in narbon vetch (Vicia narbonnesis L.) to determine that seed yield was affected by days to flowering, number of seeds per plant, number of pods per plant, one thousand seed weight, and harvest index.Karadavut et al.
(2005) found important relationships between ripening period, broad bean number in plant, grain number in plant and a hundred grains weight and yield in Eskisehir 855 bean (Phaseolus vulgaris L.) plant according to path analysis in their study conducted in Sakarya. In the study, it was seen that a hundred grains number had the biggest direct effect. Kara ve Akman (2007) found out positive and important relationships between grain yield and plant length, 1000 grains weight and hectolitre in wheat in their study. Turk et al. (2008) proposed harvest index and biological yield to be the primary selection criteria to improve seed yield in narbon vetch. In the study conducted with narbon vetch (Seydosoglu et al., 2014), in genotypes plant length was 44.2-61.3 cm, main stem length was 70.8-92.5 cm, broad bean number in plant was 9.6-14.6, green plant yield was 2207.0-4097.8 kg da-1, dry
plant yield was 526.2-935.2 kg da-1 and seed yield was
267.7-431.6 kg da-1. According to path analysis, characteristics
like plant length, hectolitre weight and 1000 grains weight which had both direct and indirect positive effects on grain yield were evaluated as yield criteria. The given study results are different from the results obtained from this study. In this study, the direct and indirect effects of fresh stem weight, dry stem weight, fresh leaf weight and dry leaf weight, which are considered to have an effect on plant length of narbon vetch, were estimated using path analysis.
The relationship between plant length and fresh stem weight was positive in narbon vetch plant. The rise in fresh stem weight would cause plant lentgh to increase. The relationship between plant length and dry stem weight was positive. The rise in dry stem weight would cause plant lentgh to increase. The relationship between plant length and fresh leaf weight in narbon vetch plant of 4 and 6 weeks was positive; this relationship was negative in narbon vetch plant of 5 weeks. The rise in fresh leaf weight negatively affects plant length in narbon vetch of 5 weeks while it causes plant length to increase in plants of 4 and 6 weeks. The relationship between plant length and dry stem weight was negative in narbon vetch plant old 4 weeks; this relationship was positive in narbon vetch plant of 5 and 6. The rise in dry leaf weight in narbon vetch negatively affects plant length whereas it causes plant length to increase in plants of 5 and 6 weeks.
Consequently, in narbon vetch plant dry stem weight had a more direct effect on plant length in plants of 4 weeks and fresh stem weight had a more direct effect on plant length in plants of 5 and 6 weeks.
REFERENCES
Acikgoz, E. (2001). Forage Crops. Department of Field Crops, Faculty of Agriculture, University of Uludag, 182, Bursa, 410 p. Alpar, R. (2011). Applied Multivariate Statistical Methods. Detay Publications No: 429, Ankara, 853 p.
Bal, C., Dogan, I. (2000). Path Analysis and An Application. 5. Biyoistatistik congress Osmangazi University Publication, 376 p.
Bennett, S.J., Maxted, N. (1997). An ecogeographic analysis of the Vicia narbonensis complex. Genet. Resour. Crop Evol.,
Board, J.E., Kang, M.S., Harville, B.G. (1997). Path analyses identify indirect selection criteria for yield of late planted soybean. Crop Science, 37: 879-884.
Buyukburç, U., Iptas, S. (2001). The Yield and Yield Components of some Narbonne Vetch (Vicia narbonensis L.) Lines in Tokat Ecological Conditions. Tr. J. of Agriculture and Forestry, 25: 79-88.
Caballero, R., Alzueta, C., Ortiz, L.T., Rodriguez, M.L., Barro, C., Rebole, A. (2001). Carbohydrate and Protein fractions of fresh and dried common vetch at three maturity stages. Agron. J., 93: 1006–1013.
Chnirakala, R., Subbaraman, N. (2010). Character association and path analysis for yield attributes in full sib progenies in Pigeonpea (Cajanus cajan (L.) Mill Sp.). Electronic Journal of Plant Breeding, 1: 824-827.
Chowdhurry, D., Tate, M.E., McDonald, G.K., Hughes, R. (2001). Progress towards reducing seed toxin levels in common vetch (V. sativa L.). Proceeding of the Australian Society of Agronomy. The regional institute Ltd. Online Community Publishing. Session 5, 1600-1700. Australia.
Davis, P.H. (1970). Flora of Turkey and East Aegean Islands. Edinburgh University Press, Edinburgh, UK. 328-369. Edwards, J.R., Lambert, L.S. (2007). Methods for Integrating Moderation and Mediation: A General Analytical Framework
Using Moderated Path Analysis. Psychological Methods, 12: 1-22.
Goksoy, A.T., Turan, Z.M. (2003). Evaluation of Biometrical Variations in The Hybrid Genotypes of Sunflower II. Correlation and Path Analysis. Journal of Agricultural Faculty of Uludag University, 1: 1-11.
Güler, M., Adak, M.S., Ulukan, H. (2001). Determining relationships among yield and some yield components using path coefficient analysis in chickpea (Cicer arietinum L.). European Journal of Agronomy, 14: 161-166.
Hayes, A.F., Preacher, K.J. (2014). Statistical mediation analysis with a multicategorical independent variable. British
Journal of Mathematical and Statistical Psychology, 67: 451-470.
Hu, X.P., Wang, C.F. (2001). SAS Data and Windows Tutorial of Statistics. 1st Edn. (Cartographic Publishing House of Xi’an: Xi’an, China).
Ikanovic, J., Glamoclija, D., Maletic, R., Popovic, V., Sokolovic, D., Spasic, M., Rakic, S. (2011). Path analysis of the productive traits in sorghum species. Genetika, 43: 253 -262.
Khan, A.S., Ashfaq, M., Asad, M.A. (2003). A Correlation and Path Coefficient Analysis for Some Yield Components in Bread Wheat. Asian Journal of Plant Sciences, 2: 582-584.
Kara, B., Akman, Z. (2007). Path Analysis and Relations of Features Local Wheat Eco Type. Journal of the Institute of Science and Technology of Süleyman Demirel University, 11: 219-224.
Karadavut, U., Genc, A., Ozdemir, S. (2005). Calculation of Linear regressionpath coefficient and applied in agriculture.
Vegetable Research Journal, 1: 27–34.
Li, C.X, Jlang, L.N., Shao, Y., Wang, W.L. (2005). Biostatistics. 3rd Edn. (Science Press: Beijing, China.
Maasen, G.H., Bakker, A.B. (2001). Suppressor Variables in Path Models. Sociological Methods and Research,
30: 241-270.
MacKinnon, D.P. (2008). Introduction to Statistical Mediation Analysis. Mahwah, NJ: Erlbaum, New York, 490 p. Prasad, B., Patwary, A.K., Biswas, P.S. (2001). Genetic Variability and Selection Criteria in Fine Rice (Oryza sativa L.).
Pakistan Journal of Bioogical Sciences 4: 1188-1190.
Preacher, K.J., Hayes, A.F. (2004). SPSS and SAS procedures for estimating indirect effects in simple mediation models.
Behavior Research Methods, Instruments, & Computers, 36: 717-731
Ramos, E., Alcaide, E.M., Yanez-Ruiz, D., Fernandez, J.R., Sanz Sampelayo, M.R. (2000). Use of different leguminous seeds for lactating goats. Amino acid composition of the raw material and the rumen undegrable fraction. Options
Mediter, 74: 285-290.
Rauf, S., Khan, T.M., Sadaqat, H.A., Khan, A.I. (2004). Correlation and path coefficient analysis of yield components in cotton (Gossypium hirsutum L.). International Journal of Agriculture & Biology, 6: 686-688.
Seydosoglu, S., Sayar, M.S. and Basbag, M. (2014). Determination of Yield and Yield Components of Some Narbon Bean Genotype in Diyarbakir Ecological Conditions. Turkish Journal of Agricultural and Natural Science, 1: 64-71. Soya, H., Avcioglu, H., Geren, H. (2004). Forage Crops. Hasad Publications Ltd. Sti., Istanbul, 223p.
Turk, M., Celik, N., Bayram, G. and Budakli, E. (2008). Relationships between seed yield and yield components in narbon bean (Vicia narbonensis L.) by path analysis. Bangladesh J. Bot., 37: 27-32.
Udensi, O., Ikpeme, E.V. (2012). Correlation and Path Coefficient Analyses of Seed Yield and its Contributing Traits in
Cajanus cajan (L.) Millsp. American Journal of Experimental Agriculture 2: 351-358.
Wright, S. (1968). Genetic and Biometric Foundation. The University of Chicago Pres. Vol. 1, IL, USA. 480 p.
Wilson, R.T., Yilmaz, O., Ertuðrul, M. (2011). The Domestic Livestock Resources of Turkey: Pig. Pig Veterinary Journal,
66: 26-30.
Yucel, C. (2004). Correlation and path coefficient analyses of seed yield components in thenarbon bean (Vicia narbonensis L.). Turkish Journal of Agriculture and Forestry 28: 371-376.