https://doi.org/10.1080/17567505.2017.1399959
Surveying and Modelling of Historical Buildings Using Point
Cloud Data in Suleymaniye in Istanbul, Turkey
Gülhan Benlia and Tuna Kanb
aDepartment of architecture, school of Fine arts, Design and architecture, istanbul medipolUniversity, istanbul, Turkey; bBimtaş co., istanbul, Turkey
ABSTRACT
Suleymaniye was one of the most densely populated areas of Istanbul in the Ottoman period. In order to protect the traditional cultural identity of Suleymaniye region and bring it in line with contemporary living conditions, a new project has been created by the Istanbul Metropolitan Municipality. Within the framework of the research on cloud computing on architecture, this paper will present both the results of terrestrial laser scanning which was used to obtain 3D point clouds through 3D survey measurements and scans of silhouettes of streets and roads, which were then transposed into survey images and designed as an example of city modelling. Additionally, the study will cite examples of how this technology has been used in Suleymaniye region.
Introduction
Usually architectural plans of historical buildings are drawn on paper or stored in vector data. The plans drawn in blueprints can be used as raster images, which can also be pictured as the form of the user interface. However, the 3D data obtained in Suleymaniye were used in tandem with 2D city maps.1 The imaging of an area in three dimensions made it possible
to correctly map out the existing urban residential areas and better understand the current situation of such areas. This approach also made it possible to analyse the relationship between a road, sidewalks and the adjacent buildings that line the road, as well as to study the relationship between their relative heights, roofs and eaves. Additionally, other fixed elements could be analysed as well, such as street lighting, trees and garden walls. 3D scan-ning made it possible to better understand the original architectural texture of a building because all of the decorative elements of a façade could be seen together, such as windows, entryways, balconies, bay windows, and mutules, all of which contribute to the creation of the ambiance of a street. In the meantime, the quality of the 3D drawings of data varied according to the façade details.
© 2017 informa UK limited, trading as Taylor & Francis Group
KEYWORDS
laser scanning; point cloud data; surveying; modelling; historical buildings; heritage list; ottoman period; istanbul
Purpose and Importance of the Work Held in Suleymaniye Region
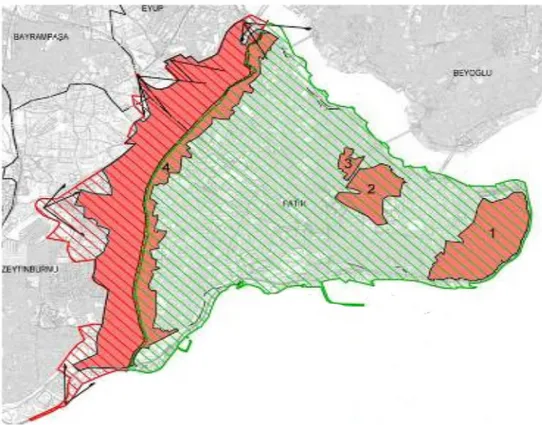
Istanbul Historical Peninsula, which connects Asia and Europe, and which has been valued by all civilizations that reigned in the vicinity throughout the history for its strategic position, is one of the rare settlements in the world which are divided by sea. As many structures from various religions, cultures and communities coexist in this geography, four regions of the Historical Peninsula were included in the UNESCO World Heritage List in 1985. These areas are as follows in Figure 1;
(1) Archaeological Park including Hippodrome, Hagia Sophia, Hagia Irene, Little Hagia Sophia Mosque and Topkapi Palace,
(2) Suleymaniye Protected Area including Suleymaniye Mosque and its surroundings, (3) Zeyrek Protected Area including Zeyrek Mosque and its surroundings, and (4) City Walls Protected Area including Historic Land Walls.
Suleymaniye Protected Area, which includes Suleymaniye Mosque and the surrounding area, is referred to as Suleymaniye region in this study. The region has international impor-tance and value, and it harbours some historical buildings which are worth protecting. Suleymaniye Protected Area including Suleymaniye Mosque and the surrounding area.
The traditional architectural texture and wooden houses that make up the neighbour-hoods in Suleymaniye make the area a rare one in Istanbul as it brings the
Figure 1. istanbul World heritage map (source: istanbul metropolitan municipality, 2003, whc.unesco. org/en/list/356).
neighbourhood-centred lifestyle of the Ottoman period into the modern era (Figure 2). Handing the architectural texture of Suleymaniye as a whole down to the next generations is of great importance for our country as well as for world culture.
Within the core of Suleymaniye neighbourhood there are some social buildings including mosques, workhouses, marketplaces, education and health buildings, which are among the few surviving examples that have reached the present in this way. However, in recent years, the world heritage sites in the historical peninsula have begun to be affected negatively due to pressure of dense and tall housing caused by rapid urbanisation.
As a precaution against this situation, planning and urban design projects were initiated for the preservation of the Protected Areas of Historical Peninsula by the Directorate of Cultural Heritage, Metropolitan Municipality of Istanbul in 2006. Formation and implemen-tation of urban design projects in the district (including Suleymaniye region) were drawn up in accordance with the note regarding the ‘implementation of development programs in the first degree protection areas should be in compliance with the general context of urban texture’ mentioned in the Law about Preservation passed in 2005.2 Use of ‘Laser
scan-ning’ technology has provided an opportunity in order to perform fast and reliable docu-mentation in this region with an intensive inventory of cultural assets.
Within the scope of the project, this method was used to perform the documentation work on an area of dense architectural texture consisting of 728 buildings listed amongst
Figure 2. settlement in historical Peninsula within the fifteenth – eighteenth centuries.
approximately 2000 buildings in Suleymaniye region, which has an area of approximately 90 hectares (90,000 m²). More numbers could be added from the report of Master Plan of Eminonu-Fatih Historical Peninsula in 1/5000 scale which was printed in Istanbul in 2003.3
As it was clear that it would take many years to complete the project using conventional technical and technological methods while identifying such a large area, the municipality began to search for innovative methods. As a result of the research and analysis work per-formed in this direction, the solution of using 3D laser scanning devices, the most advanced technology, for documentation of the area was developed.
Work of documentation and surveying the streets performed in Suleymaniye in accord-ance with the law numbered 2863 and 5366 in Turkey4 was carried out between 2006 and
2008 by Bímtaş Co.,5 which is a subsidiary of the Istanbul Metropolitan Municipality.
Although the inventory of nearly 728 historical buildings located in Suleymaniye region was organised prior to 2000 according to the data of the Ministry of Culture and Tourism of Turkey, the inventory is in the form of sheets for a single structure. It was seen that the sheets analysed within the scope of the project did not contain information relating to the overall street or area. For this reason, the documentation of the street façades of Suleymaniye using 3D laser scanning devices is of great importance so as to integrate the inventory work carried out in the past to make them more meaningful. At the same time, after the major traumatic earthquake experienced in Istanbul in 1999, in a region like Suleymaniye, the 3D documen-tation and archiving of wooden buildings located in a rare settlement in the city where Ottoman neighbourhood texture is still alive is of great importance for Turkey.
Examining Suleymaniye and its surroundings, one of the least-affected areas in the 1999 earthquake in Istanbul in this context, analysing the formation of structures and street tex-tures and transforming them into city models provide further opportunities for future researchers as well.
Location of Suleymaniye Region
Suleymaniye region is on a hill starting from Sehzade Mosque, which is the work of Mimar Sinan, including all Vefa district, going down the hill towards the Golden Horn, so it is located almost in the centre of Istanbul Historical Peninsula. In the south, Beyazid Mosque and its square, in the east Hanlar district and Grand Bazaar including Tahtakale are situated. Suleymaniye region consists of eight neighbourhoods including Yavuz Sinan, MollaHusrev, Demirtas, Hacikadin, HocaGiyasettin, Sari Demir, Kalenderhane and Suleymaniye regions (Figure 3).6
Suleymaniye region was built up around Suleymaniye Complex, which is the work of Mimar Sinan, in the sixteenth century. At the same time, it was the most preferred living area in Istanbul during the period starting from that century until the beginning of the twentieth century. The region has possessed the buildings to meet its civil and social needs including the Suleymaniye Mosque as the focal point, affiliated madrasahs, library, imaret, guesthouse, observatory, bath, and hospital, forming a social complex as a whole and a neighbourhood texture developed around it in the past 400 centuries.7 It was also the most preferred region
for resettlement in the Ottoman period due to its proximity to Grand Bazaar, Hanlar District and Eminonu, which were the focus of trade.
The Process of Surveying the Streets of Suleymaniye Region
The usual and preferred method of many years for outline drawings of the protected areas in Turkey is photogrammetric surveying. However, the call to survey the streets and façades as well as city modelling studies in Suleymaniye were required to be created in a short period of time. Therefore, it was planned to obtain data by 3D laser-scanning devices and then generate the survey through a virtual drawing program. Thus, 3D accurate digital documen-tation with millimetre-level positional accuracy was needed within the project. Data derived from laser scanners and 3D digital orthoimages provide the opportunities to design digital surface models. However, for drawings to be made as the result of fast, accurate and intensive data collection through 3D laser scanning, devices are required to be as precise as the meas-urement at least. Therefore, the selection of the laser scanning device is directly related to the quality of the survey process to be performed. In projects to survey the street silhouette only, measurement can be performed faster with sending less frequent laser point to the façades. Details will be perceived less in an image with a sparse point cloud. Buildings located in historic areas to be protected like Suleymaniye usually have the artistic styles of the craft-work of their period. Intensive scanning should be done with a scale providing the decoration and details to be drawn on façades. Every curve and cove should be detected clearly. Laser point cloud data, where details can be clearly detected, is a dense image with many points. Drawing with moving on the screen through this dense data is also difficult. Therefore, determining the scanning method based on the project to be prepared in advance is the right way to follow.
A working team was organised including a Survey Engineer, a Survey Technician, an Architect, a Restorer and a Graphic designer within the structure of Bímtaş Co. undertaking the project. Obtaining data by terrestrial laser scanning method was started with field surveys initiated in 2006.8 A team of six, including survey engineers and technicians, worked for
Figure 3. settlement in historical Peninsula within the centuries of 15th–18th.
about six months in Suleymaniye region during these studies. While the field survey contin-ued, another team of six people including survey engineers and technicians carried out the work of combining data coming from the project.
Surveying of Historical Buildings
Despite the fact that conducting no feasibility studies for the region before surveying work to be held in Suleymaniye was a handicap, rapid analysis made on-site and on-time led the field for the future projects. The study consists of two main parts including;
• Part 1: Studies performed in the office environment (preparation phase), • Part 2: Studies performed in the field (land work).
Façades of the buildings forming the street silhouette can be displayed on individual building basis or on row housing basis depending on the needs of the project. Connected to the coordinate system, these digital images have helped to measure the elevation differ-ence between the streets. Measurements of the streets of Suleymaniye are obtained by connecting to the earth (global) coordinate system.
Work Performed in the Office (Part 1)
Obtaining all ongoing work of Suleymaniye from the relevant municipality, manual work was conducted concerning field sizes. The total length of the streets to be scanned by laser was calculated. In the same way, the surface areas of the façades in the streets to be scanned were calculated with the help of data concerning storey heights obtained from the munic-ipality. Meanwhile, by sending a leading team to the region, scanning data were obtained on a trial basis. Based upon this example, a general business programme was created. The number of laser scanning devices and working teams required was identified on the basis of the sizes of the present areas.
Two teams consisting of three people were organised to operate in the region based on this programme. These teams included survey engineers and survey technicians. Before the work started, the team to work in the field received short-term training on how to use the laser scanning device. Teams working in the region encountered some problems which adversely affected the project process.
According to the work programme related to obtaining data by laser scanning, streets to be subjected to scanning primarily and locations for scanning stations to be installed were identified on the map. Location identification (geo-referencing) were created to establish the inter-station network through the coordinate mechanism. It was planned to hang printed paper ‘targets’to provide location identification for geo-referencing. These targets were printed on A5 size paper in black and white in the office environment.
When cracks, cavities, biological degradations, fouling, deformations or any important parts of building façades in survey drawings could not be determined clearly through point clouds, taking the advantage of detail photographs was proposed. For this reason, cameras to be used in land were prepared as calibrated with the lens of 50 mm in order to minimise distortion.
Work Performed in the Field (Part 2)
As planned, black-and-white targets to provide geo-referenced location identification and control points between scanning stations, were affixed to the façades of chosen buildings at a height of about 1.3 m.9 The entire area was woven like a network by means of the targets,
matched with the base map, and the buildings on it were defined on the map. A specified terrestrial laser scanning system was used with the support of digital cameras.
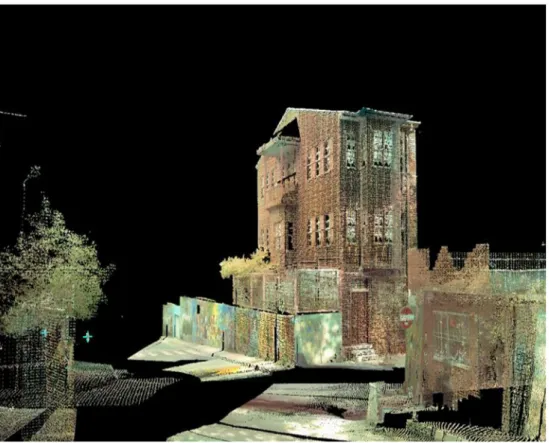
The beam from laser scanning device was sent to the façade across returns to computer environment as millions of point data. Each point in the point cloud has 3D coordinates (x, y, z). The façade view can be defined in a virtual environment with millions of 3D coordinates in minutes. Façade surface formed by the point cloud can now be seen on the screen in a digital environment. This surface is now in high accuracy and real size. Also, it can be trans-ferred to any drawing programme desired because it has been coordinated according to the ground level (Figure 4).
Laser scanning data and geodesic measurements are obtained together in the field work. In this context, work in the field is realised through the following stages:
• Geodesic Measurement.
• Setup (the number of sessions for scan is planned in the exploratory study). • Data transfer (transferring data coming from the sessions to computer).
Figure 4. Point cloud Data obtained by laser scanning in urban design works of suleymaniye.
Point cloud data coming from many sessions collected in the field were combined, and then coloured according to the colours obtained from the photographic data (Figure 4). Powerful computer hardware and a trained technical team are needed at this stage. Point cloud data from each settlement is so intense that it can only be done by an operator spe-cialised in this field. When point clouds are combined, they should not only have the density to reflect the structure most accurately but also be small enough to be handled in the drawing programme. At this stage of the study, it might be necessary to repeat the process again and again until receiving the best results in the cases that data is too obscure to be read due to being subtilized or that it cannot be opened because of the density of data sent for drawing.
Point cloud data, whose merging process has been completed, is drawn by being trans-ferred to special software that allows for 3D vector drawing from point cloud. Better results can be obtained by matching point cloud data with special screening calibre photographs taken together with scanning at the points where the point cloud is not dense enough.
The Creation of Vector Graphics and Surveying on Digital Environment
Pre-determination of drawing details and scales of the surface to be drawn is one of the decisions to be made in surveying process. The scale of detail to be drawn is directly pro-portional to the intensity of the laser beams to be reflected to the building. The surface angle of the laser light also plays an important role in obtaining details of concave or convex curves of architectural elements of the façade of the building. In spite of getting a clearer point cloud image in scanning with a 90 degree angle to the façade, in cases where the scanning angle is inappropriate, data will need to be combined by performing a number of scans.
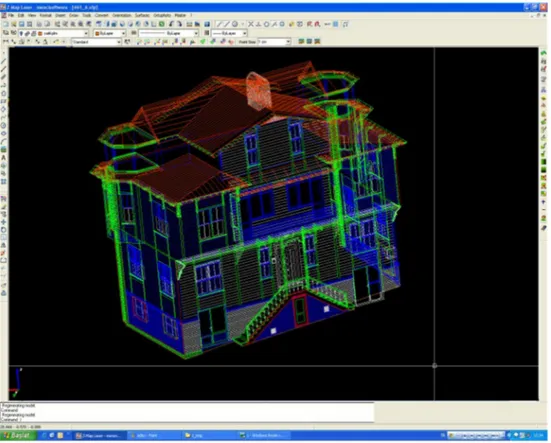
Then, these data can be superposed in the office environment with other data whose coordinates are definite. The greater the density of the point cloud, the better the clarity of architectural details of a façade such as profiled mouldings around doors and windows, bay windows, mutules under the roof, doorjambs, decorative elements of the façade, balcony railings and roof levels will be seen. This is an important criterion in making sure that the façade of the building can be rendered with maximum accuracy in the stage of creating architectural drawings without the need for any interpretation. However, some dark parts may be formed in the façades behind the items, when they are positioned in front of build-ings. In such circumstances, by taking new measurements with terrestrial scanners for these façades, that data should be combined with other point cloud data. When looking at the point cloud data of a street that has been scanned, a shadow copy of this surface can be seen in the digital environment; thus, it can be said that this image now represents virtual surveying. Either black and white or colour images can be obtained depending on the scan speed, capacity, model and brand of the scanner used (Figure 5).
In the restoration to be carried out in Suleymaniye Region, which is our essential cultural and architectural heritage area to be protected, drawings on 1/200 scale were planned to be used, as proposed for re-functioning and urban design projects to be used for street silhouettes. Within the scope of the project, the drawing standards required by1/200 scale were taken as a basis. Preparation of surveying drawings using 3D point cloud data was started in 2008 by 36 technicians established within Bimtaş Co., by using 36 licensed Z-MAP programs of the Italian Menci-software Company.10
During the process of producing the surveying through the point cloud, when the loca-tion, size, recessed and protruding areas of surfaces of the structure façades constituting the street could not be seen clearly relative to the ground plane and surroundings, the information was obtained through photography. Being able to access the perspective images of silhouettes of façade and street in the virtual environment provided a control for the surveyed drawings made in the field.
As a street façade is a formal composition with its visible aspect, architectural details such as access doors, windows, eaves, and oriels, constituting the façade view were drawn in virtual environment through point clouds and could be shown accurately in the surveying. The photographs taken with calibrated machines in the region were brought to the necessary coordinates and matched with point clouds. Thus, details and places that required detailed study could be seen through detailed photographs, the position and quantity of deteriora-tion and deformadeteriora-tion to be processed on the surveying could be processed correctly through the photographs taken. Measuring and drawings in places difficult to reach such as the bottom of an eave or the bottom of a bay window could be comfortably performed through laser point clouds.
Because each point in the point cloud data consisted of millions of points obtained from 3D laser scanning device has its own coordinate value, by capturing and combining the sharp lines formed by these points and also with the support received from photograph data, in the licensed Z-MAP program, street surveying base studies in Suleymaniye were produced as 3D between the years 2008 and 2010. Surveys produced by different technicians were combined by the architect or the restorer who controlled the work. However, in places such as roof tops, where terrestrial measurements could not be performed, aerial photo-graphs and terrestrial laser scanning were overlapped by being matched according to their Figure 5. view of Point cloud Data in drawing program obtained by laser scanning in the study of Urban Design of suleymaniye region.
coordinates. The roof diffraction points and the contours of the eaves were drawn through this overlapped data. However, some roof drawings could not be made due to unclear roof images in aerial photographs and trees which had overgrown and covered the roof.
The survey files generated in the Z-MAP program take their final forms also in the licensed AutoCad programs.11 Because the surveying brought to CAD environment is 3 dimensional,
all intrusions and protrusions in the façade are seen. However, in Turkey, as required by ‘Cultural Heritage Protection Boards’ that give approval to antiquities projects, surveying is presented only as 2D for the time being. Therefore, even when 3D scanning or surveying is performed, if an application is to be made for legal permission for the restoration of an antique structure to the relevant protection board, all surveying drawings need to be reduced to 2 dimensions. As a result, surveying is prepared as façade-based in different layers. If desired, these drawings can be presented as 2D drawings such as only front view or side view by being divided into layers belonging to the façades. The lines in the third dimension which give the depth in the façade surface on the CAD environment are also drawn in dif-ferent layers (Figure 6). In this case, the layers belonging to the depths of the profiled archi-tectural elements which make intrusion-protrusion on the façade (flat moulding, mutule, console, eaves, sill etc.), and the layers belonging to the depth of balconies and bay windows were closed and 2D drawing output could be received.
Figure 6. 3D drawings produced over Point cloud Data.
By using point cloud data interface drawing programmes, measuring in metric units and drawing through this can be performed, and any point on the façade has its own real size. Thus, the existing faade image can be drawn with high accuracy and at millimetric precision. For example, the elevation from the ground of an oriel in the façade of a wooden structure, elevation of an eaves bottom, all dimensions of the windows in the façade and wooden sill surrounding the window can be obtained.
Contribution of Point Cloud Technology to Building Surveying
As the laser scanning devices provided quick and effective measurement of Suleymaniye region where the historical buildings are dense, they have enabled civil architecture exam-ples to be evaluated together with monumental artefacts such as mosques, fountains, small mosques, baths and churches.
From the 3D laser point clouds performed in Suleymaniye, the following urban data have been collected:
• the relationship between historical buildings and reinforced concrete new structures, • additions to historical buildings, illegal floors,
• the relationship between historical buildings and street and square, • the function, clearance height and current aesthetic situations of buildings, • the detection of free fields,
• the existing transport situation,
• floor, garden, road and pavement grades, • vegetation and trees,
• street lights and trashcans.
While creating the façade surveying of the Suleymaniye streets, details, such as the dis-tance, elevation relation, alignments of the eaves and the roofs, balcony, bay window, and garden wall, between many historic monuments adjacent to each other or located close, could easily be detected on the integrated point cloud.
It was possible to see together, evaluate and interpret all the architectural features of the façades constituting the streets. As all façades could be seen together in the digital environ-ment, overlooked architectural details (such as broken window sills or broken moulding under eaves) during surveying in the area were completed through the point cloud during office work. Within the framework of facilities offered by technology, in some cases work was carried out during the night without the need for sunlight. Aside from the building façades constituting the streets, the analyses of the environment and urban conditions such as trees, street lights, trashcans and sidewalks were done. Opportunities were found for sectioning and drawing from the desired point through the combined point cloud data related to the area.
Modelling
Besides the production of 2D or 3D drawings, from the data obtained in the digital environ-ment3D animations, solid surface models or textured 3D city models can also be produced. Thus, high resolution 3D city models can be prepared with advanced technology. From these city models, it has become possible to conduct an analysis of the existing texture and
integrate new architectural designs into the existing urban texture. It is of vital importance that the existing urban texture be perceived when new urban design decisions or construc-tion applicaconstruc-tions are to be made in the area. In order for the protecconstruc-tion decisions to be made for the entire area, information about the construction areas – whether occupied or vacant – squares, the widths of the roads, the height of the buildings, landscape and green areas in the region and the like must be obtained. Although it is known that the Suleymaniye region needs such a holistic study, there is no example of a project related to a large scale city settlement in our country.
Standards in Turkey and City GML
CityGML (City Geography Markup Language) began to be developed in 2002 in Germany by the SIG-3D (Special Interest Group 3D) and GDI-NRW (Geodata Infrastructure North-Rhine Westphalia) organizations.12 CityGML is an open data model and an XML-based format for
3D city models for storage and exchange. The purpose of the creation of CityGML is to exe-cute the basic concepts and relationships of 3D city models in a common definition. In this context, it is a reference to three dimensional applications. Standards improved for City GML 3D city modelling are entire. City GML has an integrated spatial data infrastructure. At the same time, it meets the ISO (International Standardization Organization) standards, and since 2008 it also meets the OGC (Open Geospatial Consortium) standards. It offers flexibility that can be used from large-scale maps to small-scale maps. It is in a structure that can work between different databases where consistent meaningful geometric modelling can be done. With City GML system building interior details can be added to the system and even volumes of unclosed surfaces can be calculated.
CityGML is an independent geographic information model for virtual 3D city models and land. City GML has five different levels of detail defined; LOD – Levels of Detail. These are defined as LOD 0, 1, 2, 3, 4.
LOD 0 defines 2,5D digital field model.
LOD 1 defines 3D building model which has no roof data, i.e. defined abstract building.
LOD 2 defines 3D building model of which the roof data and surfaces are textured, i.e. defined exterior surface (Boundary Surface) and its components, roof, walls, floors, closed surfaces.
LOD 3 defines building model with detailed architecture, i.e. openings such as windows, doors belonging to the defined exterior surface.
LOD 4 defines inside ambulatory and detailed 3D building model, i.e. the components of defined exterior surface layer which are ceilings, interior walls, floors and the components of the abstract building layers, rooms and wares.
In Suleymaniye region, which aspired to be an exemplar in the scope of this research, modelling studies were performed at LOD 0, 1, 2 and 3 levels. However, the size of the area and limited duration of the project did not enable the modelling of all the structures at LOD 3 level. The laser scanning of antique structures deemed proprietary in terms of architectural features in the region was performed by reading 100,000 points per second and modelled accordingly.
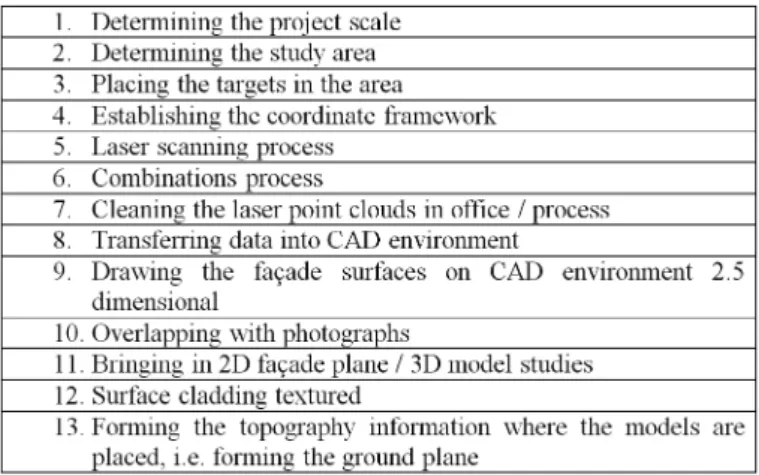
Methodology on Study Area
In documentation studies performed by using terrestrial laser scanning method, planning stages before scanning hold an important place in the process.
Pre-scanning Planning
In the laser scanning business plan, primarily the addresses where the street scanning will be performed were determined. In the planning stage, installation locations of the scanning stations were marked on the map and the numbers were determined. On each session of installation and scanning, all surfaces of the building to be scanned were covered in targets. A work flow diagram is shown in Figure 7.
A decision was taken on the image resolution of the scanning. The image resolution of the scanning depends on the angular resolution, which determines the frequency of meas-uring points with distance measurement accuracy of the scanner. Leica ScanStationC10 laser scanner used in the study can measure highly accurately up to 300 m and can read 50,000 points per second.13 The distance between scanning stations and the farthest area scanned
in the study area was less than 50 m.
Within the scope of this study, as the distance between the scanner and scanned system is close, the resolution of the scanning was selected generally at a ‘medium’ degree of reso-lution. In all of the installed stations, 360-degree scanning was performed. Point cloud data obtained from the scanning results, aside from the building essential to scanning, contained a lot of data as well as redundant data. Environmental data not to be used in 3D drawing and modelling (distant buildings, cars, human images, etc.) were removed with the help of Leica Cyclone software and the data were moved on the CAD environment by using Leica Cloudworx module. The coordinate system of the obtained point clouds was determined as scanner-based coordinate system of the station where the first scanning was performed.
Scanning Process
To obtain the 3D point cloud of the entire structure, the scanning process was performed from each station determined in the planning stage. Three different scanning processes are performed at each station. The first one of the scanning is the general area scanning, where
the scanner sees from its position; the second is the scanning of the targets, and the third is the detailed area scanning, which has to be performed from the position where the scanner is. For combining the point data obtained from different stations, there must be at least three common targets in sequential scanning. In the scope of Suleymaniye study, the structures in the region are divided into three groups:
• Proprietary monumental structures (church, mosque, bath, library, madrasah etc.), • Proprietary examples of civil architecture (houses),
• Other non-Proprietary buildings.
Decisions were made for proprietary monumental buildings to be scanned by point cloud which has density of 1–2 centimetre margin of error, for proprietary examples of civil archi-tecture structures to be scanned by point cloud which has density of 2–5 centimetre margin of error. As for non-proprietary buildings, point cloud data with 5–10 centimetre margin of error was accepted for the entire study.
Creating Orthophoto Images
An orthophoto image is a digital image where the errors occurring due to tilt, facing and elevation difference are corrected and brought into the vertical projection. In this study, orthophoto images of building façades were produced, which would form the basis for architectural drawings. As orthophoto images belonging to the façades would be produced, planes were formed according to XZ plane.
The point cloud data obtained through the scanning process were automatically com-bined by using Leica Cyclone software. As the margin of error, ±5 mm standard was agreed upon. The margin of error during the combination of data for Suleymaniye was ±2 mm. During the combination process, error vectors were examined, and it was decided that the results were accurate enough; therefore, the combination process was completed. To transfer the point cloud data combined in Leica Cyclone software into AutoCAD software, Leica Cloudworx software was used.14
Data Cleaning
Raw laser data coming from the area pass through the pre-processing stages before being converted to 3D CAD drawings. Raw laser data are accurately coordinated primarily by using the control points in the area. In the next step, the laser point cloud data are partitioned to the size to work comfortably in software. Also at this stage, non-essential details on laser point cloud data coming from the area, causing both complications in the drawing and leading to high file size, are cleared. Data belonging to the parked cars blocking the façades of the structures or structures in background are simplified.
Suleymaniye: The 3D City Model
Each building in the study area of Suleymaniye region is named with its block and parcel number. For example, a building archived with file number 496/8, has 496 building block number in the region and no. 8 parcel number. The 3D laser scans made in the area, by being named with the same block and parcel number in the same way, were filed in the digital environment and subsequently received a sequence number. All the photographs belonging to that building were grouped again with the same method and received a sequence number
such as f1, f2, f3. A 3D building mass was formed from the laser point cloud data obtained by the laser scanners by using the Z-map software of Mencisoftware Company.15 These CAD
data were converted into solid models by using Studio Max software, and its visualisation was made. Texturing of the 3D models obtained was realised with high resolution images.
LOD 0: The map information of Suleymaniye region was provided from the Istanbul Metropolitan Municipality in the virtual environment. For the whole of the terrain, informa-tion about the block number, parcel number, building number, avenue and street names were grouped in the digital environment. The geodetic measurements made in the area and the grades of floor (ground) on the map from municipality were paired. Thus, the terrain model in LOD 0 level of the area to be modelled was produced.
LOD 1: The information about the flat numbers belonging to all structures in the study area was obtained from the municipality. At the same time, the total number of the storeys of the structures was controlled by the architecture group working in the area. The city model in LOD 1 level was created by reading point cloud coming from scanning in Z-Map software program, drawing the building façade contours in the CAD environment and superposing with the building sitting lines received from base maps. City model in LOD 1 level is a city model at a basic level (Figure 8).
LOD 2: Vector data such as transportation network, railways, and trees, obtained from 1/1000 scale maps of municipality and 3D city objects which would complete the integrity
Figure 8. a basic level of city model of suleymaniye regiont in loD 1.
of the model were added to the model. Furthermore, ortho-images of 500 mm resolution surface were used as the base in this study. Images were made ready for use by pixilation. The biggest problem in LOD 2 stage was the lack of information about configurations and elevations of the roofs. Although the Air Lidar technology was known in Turkey during Suleymaniye region modelling study, the fact that the use of the technology was not wide-spread and it was not involved in the project budget, did not enable the use of Lidar tech-nology.16 Therefore, the need arose for articulation of roofs into 3D modelling made on the
basis of street and structure block, by modelling in a separate system. In this regard, it was decided for the roofs of the buildings located in the study area to be drawn as 3D from stereo aerial photographs.
In order to solve this problem, for modelling only the roofs of the buildings, a small work-ing group was established from the team of map technicians and restorers of Bimtaş Co. After a short-term training, the roof modelling group of five people started production by using Z-Map Photo software of the Mencisoftware Company. 100 mm resolution digital aerial photographs and digital elevation model were the basic data used for creating the city model. Primarily, the internal and external routings of the images of the stereo aerial photographs were made by using Zmap Photo software of Menscisoftware Company. After the routing processes were completed, digitising the 3D roofs was performed.
The roofs, whose drawings were completed and divided into two different polygon layers as roofs and roof bases, to be used for modelling of buildings at later stages. For this process, each part constituting the roof was converted into a polygon. While being converted into 3D polygons, the roofs were divided into two layers as the parts constituting the roof geom-etry and the roof base. Elevation data of the roof base was obtained from point cloud data performed in the area. Therefore, the lower level elevation of the roof compared to the ground elevation is clearly known. The parts constituting the roof geometry are the diffrac-tion lines of the roof in bird’s-eye view. These diffracdiffrac-tion lines and elevadiffrac-tions were created by being taken from stereo aerial photographs. The parts constituting the roof geometry were added to the model of the structures and in detail level 2, added to the integrated urban model (Figure 9).
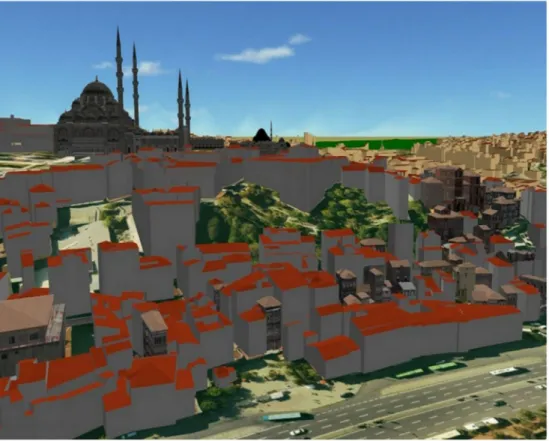
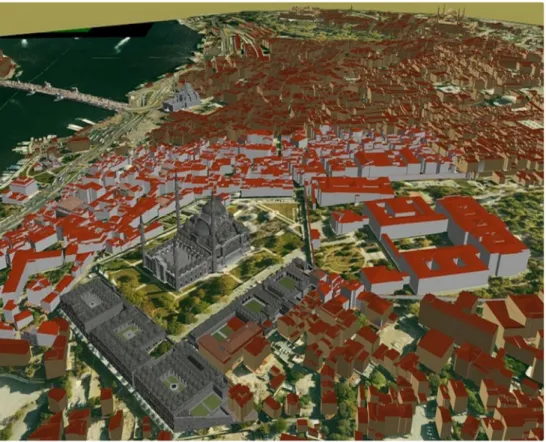
LOD 3: In order to increase the visual quality of the model, important landmarks such as Suleymaniye Complex (mosques and madrasahs around) and buildings under protection were modelled in LOD 3 level along with their surroundings. The digital elevation model used for creating the city model and ensuring the compatibility of ortho-image mosaic was of great importance. Therefore, the 3D city model produced was prepared by using Autodesk Landxplorer Studio Professional software (Figures 10–12).17
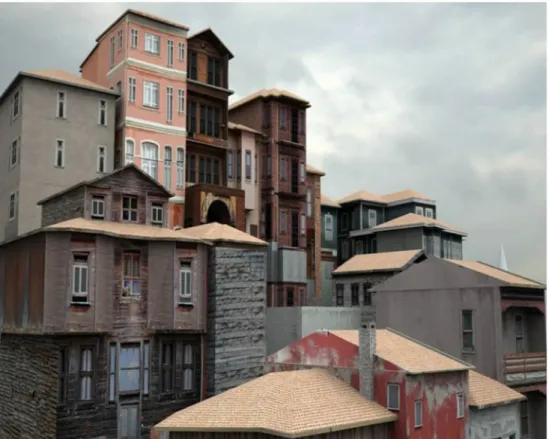
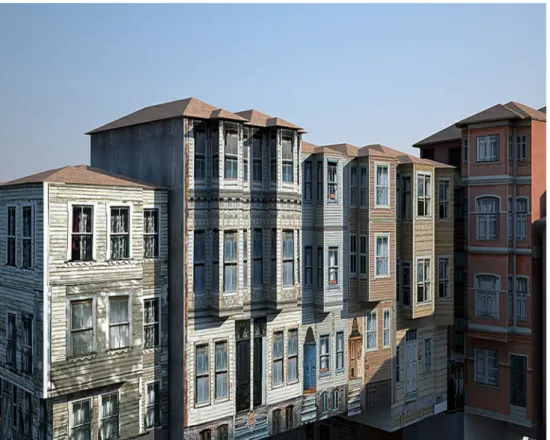
LOD 4: Model studies created at this level in the study area have not been finalised.
Contribution of Point Cloud Data to New Design
Point cloud data led to new plan decisions to be taken in the area. It facilitates the decisions to be taken on the size, colour, material and texture information of the new architectural elements to be implemented in the area. While the survey drawing process continues, prepa-rations and decisions of the design studies to be implemented in the area can be completed through the combined 3D laser point cloud. With such an operation, the opportunity for considerably shortening the duration of the resulting project results. Experts who work in the area can see and integrally investigate the region defined as protected area in the digital
environment as an integrated whole. This situation will provide the decisions to be taken in urban scale over the area to be fast, right and healthy.
Conclusion
3D city models that provide virtual reality environments are in increasing demand. These models are supported by the CBS data: thus, the properties as well as the images of the object can be presented to the user. Such a practice, especially the registration of the historic areas, provides important support for their preservation for the future. It especially consti-tutes the database feature belonging to the historic areas and new data related to the study area can be added to this environment in stages. 3D applications constitute an important basis, especially for planners and other decision-makers to make the right decision.
In order to obtain 3D modelling through the point cloud with laser scanners, either • the modelling method generated with automatic correction of simple geometric shapes
which can be read through the point cloud, or
• the modelling method generated by processing of point cloud for forming the mesh models of complex geometries,18 is preferred.
Figure 9. level of city model of suleymaniye area in loD 2.
In the first method, the object data take up less space and object geometries are easier. In the second method, data take more space; therefore, it is more convenient for use for sculptures and complex geometrical objects whose geometries are unclear. For architectural purposes, methods that combine different techniques are more convenient solutions.19
However, the following requirements should be sought for in 3D city models to be made in the cultural heritage areas requiring protection:
• Very comprehensive, high-resolution and multi-source 3D (even 4D if possible) infor-mation to be recordable and processable,
• The resulting 3D model needs to have a manageable and information addable structure for future applications,
• Owned visualization should be accessible and sharable by other users through online databases or the internet,
• To have digital inventory status and standards,
• Owned images to be able to serve education, research, protection, recreation, tourism and similar purposes.20
In obtaining realistic 3D models of large and complex areas in our days, traditional survey techniques or image-based21 and area-based (range-based)22 survey techniques are used.
Here, the selection of the model or integration with each other depends on factors such as Figure 10. lod2 in suleymaniye.
the purpose of the project, the accuracy expected from the scope of the project, sizes and façade properties of the structures at the current situation, the location of buildings with each other; as well as other factors, such as portability of the preferred system, experience of the working team and project budget.23
In most applications, a single 3D modelling technique is insufficient to meet all the requirements of the project. Sensor applications including photogrammetry and laser scan-ning should be used together in recording the architectural structure or structure groups, complex structures, detailed sections and archaeological sites. However, in Turkey, urban modelling has not yet been realised enough and widespread due to different reasons such as;
• İt is too expensive to obtain the 3D data,
• starting with 3D data request, and then finding 2D documentation sufficient upon facing difficulties and high costs,
• difficulties with the integration of newly acquired 3D data with the existing 2D munic-ipality data,
• having a limited number of experienced and qualified staff for the production of eligi-ble 3D urban models to be outnumbered urban modelling has not yet been realised enough and widespread.24
Figure 11. lod3 in suleymaniye.
Geolocation information
SCOPUS autor id is: 57096035500
Notes
1. Baz et al., “Documentation of Istanbul Historic Peninsula.”
2. Turkish Government, Usage of Timeworn Historical.
3. Istanbul Metropolitan Municipality, The Report of Master Plan of Eminonu-Fatih.
4. Turkish Government, Conservation of Natural and Cultural Property.
5. www.bimtas.com.
6. See note 3 above.
7. Müller-Wiener, A Pictorical Dictionary.
8. For more detailed information in this subject, please refer to Baz et al., “Documentation of Istanbul Historic Peninsula” and Buhur et al., “3D City Modelling for Planning Activities.”
9. See note 1 above.
10. http://www.menci.com/en/.
11. See note 1 above.
12. CityGML Standards website from www.citygml.org.
13. Buhur et al., “3D City Modelling for Planning Activities.”
14. See note 13 above.
15. Dursun et al., “3D City Modelling of Istanbul.” Figure 12. lod4 in suleymaniye.
16. On this technology, see Crutchley and Crow, The Light Fantastic.
17. https://www.autodesk.co.uk/.
18. Chevrier and Perrin, “Laser Range Data.”
19. See note 18 above.
20. Remondino and Rizzi, “Reality-Based 3D Documentation.”
21. See note 20 above.
22. Rizzi et al., Optical Measurement Techniques.
23. See note 20 above.
24. See note 20 above.
25. Ortaylı, Pages from Istanbul [İstanbul’danSayfalar].
26. Google maps: https://www.google.com.tr/maps/@41.0161629,28.9511321,14z
Acknowledgements
We are grateful to Bimtaş Co. for the results shared in this paper and for allowing us to use the figures.
Disclosure statement
No potential conflict of interest was reported by the authors.
Notes on contributors
Gulhan Benli completed her PhD degree in the Department of Restoration and Surveying in YTU University. She has undertaken many academic studies on urban conservation, preserving protected areas, surveying, restitution and restoration projects.
Tuna Kan completed her PhD on the conservation of historical environment and site management plans in MSU University. Kan, has been working on surveying, urban conservation and urban design projects of historical sites as a member of BİMTAŞ.
ORCID
Gülhan Benli http://orcid.org/0000-0001-8825-8716
Bibliography
Baz, I., T. H. Kersten, G. Buyuksalih, and K. Jacobsen. “Documentation of Istanbul Historic Peninsula by Static and Mobile Terrestrial Laser Scanning.” In ISPRS. Volume XXXVII Part B5, edited by Chen Jiang and H-G. Maas, 993–998. 2008. http://www.isprs.org/proceedings/XXXVII/congress/5_pdf/172.pdf. Bimtaş Co. Website from www.bimtas.com.
Buhur, S., L. Ross, G. Buyuksalih, and I. Baz. “3D City Modelling for Planning Activities, Case Study: Haydarpaşa Train Station, Haydarpaşa Port and Surrounding Backside Zones, Istanbul.” In edited by Heipke Jacobsen and M. Gerke. 2009. Unpaginated. http://www.isprs.org/proceedings/ XXXVIII/1_4_7-W5/paper/Buhur-175.pdf.
Çelik, Z The Remaking of Istanbul: Portrait of an Ottoman City in the Nineteenth Century. Berkeley: University of California Press, 1993.
Chen, J., J. Jiang, and H-G. Maas, eds. “International Archives of the Photogrammetry, Remote Sensing and Spatial Information Sciences.” Volume XXXVII Part B5, ISPRS Congress, Beijing, Republic of China, July 3–11, 2008. http://www.isprs.org/proceedings/XXXVII/congress/tc5.aspx.
Chevrier, C., and J. P. Perrin. “Laser Range Data, Photographs and Architectural Components.” International Archives of the Photogrammetry, Remote Sensing and Spatial Information Sciences, Vol. XXXVII. Part B5, Commission WG V/2, Beijing, China, 2008. pp. 1113–1118.
CityGML Standards. Website from www.citygml.org.
Crutchley, S., and P. Crow. The Light Fantastic: Using airborne Laser Scanning in Archaeological Survey. Swindon: English Heritage [Historic England], 2009. https://content.historicengland.org.uk/images-books/publications/light-fantastic/light-fantastic.pdf/
Dursun, S., D. Sagir, G. Buyuksalih, S. Buhur, T. H. Kersten, and K. Jacobsen. “3D City Modelling of Istanbul Historic Peninsula by Combination of Aerial Images and Terrestrial Laser Scanning Data.” 4th Workshop on Remote Sensing for Developing Countries/GISDECO 8’, Istanbul Technical University, Istanbul, Turkey, June 4–7, 2008. pp. 1239–1245. http://www.isprs.org/proceedings/XXXVII/ congress/7_pdf/6_WG-VII-6/33.pdf
Fatih Municipality. The Strategic Plan of Fatih Municipality, 2010–2014, 52. Istanbul, Turkey, 2010. Geoportal. Website from www.goeportal.nrw.de.
Heipke, C., K. Jacobsen, and M. Gerke, eds. ISPRS Archives Volume XXXVIII-1-4-7/W5. ISPRS workshop of
High-Resolution Earth Imaging for Geospatial Information, Hannover workshop 2007, Germany, May
29–June 1 2007, 2009. http://www.isprs.org/proceedings/XXXVIII/1_4_7-W5/
Istanbul Metropolitan Municipality. The Report of Master Plan of Eminonu-Fatih Historical Peninsula in
1/5000 scale, 132. Istanbul, Turkey, 2006.
Müller-Wiener, W. A Pictorical Dictionary of the Toppgraphy of Istanbul: Byzantium, Constantinople,
Istanbul since the beginning of the 17th century [BildlexikonzurTopographieIstanbuls: Byzantion, Konstantinupolis, Istanbul biszumBeginn d. 17. Jh], Wasmuth, Germany, 1977.
Ortaylı, İ İstanbul’danSayfalar [Pages from Istanbul]. 2nd ed. İstanbul, Turkey: HilYayın, 1987. Remondino, F, and A Rizzi. “Reality-Based 3D Documentation of World Heritage Sites: Methodologies,
Problems and Examples.” In 22nd CIPA Symposium, Kyoto, Japan, 2009.
Rizzi, A, F Voltolini, F Remondino, S Girardi, and L Gonzo. Optical Measurement Techniques for the Digital
Preservation, Documentation and Analysis of Cultural Heritage. State College: The Pennsylvania State
University, USA, 2007.
Turkish Government. Law No. 5366 of June 16, 2005 on Usage of Timeworn Historical and Cultural Real
Property with Restoration and Protection [5366 sayılı Yıpranan Tarihî ve Kültürel Taşınmaz Varlıkların Yenilenerek Korunması ve Yaşatılarak Kullanılması Hakkında Kanun].
Turkish Government. Law No. 2863 of July 21, 1983 on Conservation of Cultural and Natural Property (as
last amended by Law No.648 of August 8, 2001 and Law No. 653 of August 23, 2011) [2863 sayılı Kültür
ve Tabiat Varlıklarını Koruma Kanunu].