* -J. . v^< ,4 jt А]Л\Г i «t***-t -fi*“?· ^ ;·.·'^ '«f» «y* r W V - ^ мш·« ·. ам( W ' M' x ^ '« i' )■'' i
:^ε·Ϊ5υΒΰΏ©?!! Í5¿· J¿'5'D;:3
íЙ Tiy^ÄiY
é Tb,ú¿-.?'' . Ù M OJ'v ^‘j ^ S l t ó t b l i iä) SiïOKDjjjÎS^lî 'i i i kÆ 'ïfSB ¿fl В^ійбн!3jj P ü íílái í-yiiíiibjíili i / i]iií
Ѣ : İL · o !
ЗТізШ-д'чЗ*·;-· ν J W -· w' u' "■'
THE EFFECT OF TAXES
ON
DISTRIBUTION OF INCOME IN TURKEY
A Thesis
Submitted to the Department o f Economics
and the Institute o f Economics and Social Sciences o f
Bilkent University
In Partial Fullfillment o f the Requirements
for the Degree o f
MASTER OF SCIENCE IN ECONOMICS
by
Özlem Onaran
May, 1994
HJ
g ' î t O . L , • 0 5 i
I certify that I've read this thesis and in my opinion it is fully adequate, in scope and in quality, as a thesis for the degree of Master o f Science in Economics.
5 O uk
Prof. Dr. Sydney N. Afriat
I certify that I've read this thesis and in my opinion it is fully adequate, in scope and in quality, as a thesis for the degree of Master o f Science in Economics.
v/cJtU
Assoc. Prof. Dr. Erinç Yeldan
I certify that I've read this thesis and in my opinion it is fully adequate, in scope and in quality, as a thesis for the degree of Master o f Science in Economics.
Assoc. ProfrDr. Osman Zaim
ABSTRACT
THE EFFECT OF TAXES ON
DISTRIBUTION OF INCOME IN TURKEY
ÖZLEM ONARAN
M.S. in Economics
Supervisor: Assoc. Prof. Dr. Osman Zaim May 1994
This study analyzes the effects of tax system on distribution of income in Turkey. For this purpose, the geneal elements in the system, such as distribution of direct and indirect taxes; taxes on income, wealth and expenditures; effect of inflation are analyzed. The measures of degree of progression are applied to income taxation and the distribution of effective tax burden over factor income groups is analyzed. An additional discussion is made about the distribution of value-added tax biu^den as percentage of monthly disposable income. Combining the results, it is found that the tax system in Turkey redistributes income to the disadvantage of tow income individuals and working masses. A more progressive and unitary income tax structure; a low, uniform rated value-added tax scheme with a progressive reimbursement mechanism is proposed to increase tax equity even without reducing tax revenue.
Key Words: Turkey, distribution of income, income tax, progressivity, effective tax burden, value-added tax, regressivity.
ÖZET
TÜRKİYE'DE VERGİLERİN GELİR DAĞILIMINA ETKİSİ
ÖZLEM ONARAN
Yüksek Lisans Tezi, İktisat Bölümü Tez Yöneticisi; Doç. Dr. Osman Zaim
Mayıs 1994
Bu çalışma, Türkiye'de vergi yapısının gelir dağılımı üzerine etkilerini incelemektedir. Bu amaçla, dolaylı ve dolaysız vergilerin, gelirden, servetten ve harcamalardan alınan vergilerin dağılımı; enflasyonun etkileri gibi vergi yapısının genel özellikleri incelenmiştir. Gelir vergisine artan oranlılık derecesiyle ilgili ölçümler uygulanmıştır ve efektif vergi yükünün faktör gelirlerine göre dağılımı incelenmiştir. Katma değer vergi yükünün, aylık harcanabilir gelirin yüzdesi olarak dağılımına dair bir tartışma yapılmıştır. Sonuçlar birleştirilerek, Türkiye'nin vergi yapısının geliri düşük gelir grupları ve çalışanlann aleyhine yeniden dağıttığı bulunmuştıu·. Vergi gelirlerini azaltmaksızın vergi adaletini arttırmak için daha artan oranlı ve üniter bir gelir vergisi yapısı; düşük, sabit oranlı bir katma değer vergisi ve artan oranlı bir vergi iadesi şeması önenlmiştir.
Anahtar Sözcükler: Türkiye, gelir dağılımı, gelir vergisi, artan oranlılık, efektif vergi yükü, katma değer vergisi, azalan oranlılık.
Acknowledgements
I would like to express my graditude to Assoc. Prof. Dr. Osman Zaim for his valuable supervision and for providing me with the necessary background by teaching me Public Finance. I am thankful to Prof. Dr. Sydney N. Afriat for his comments about the use of price indices in the adjustment o f tax brackets. I also would like to thank to Assoc. Prof. Dr. Erinç Yeldan for his comments.
Contents
1 Introduction
The General View o f the Turkish Tax Structure 2.1 Introduction
The Share of Direct and Indirect Taxes in the System Taxes on Income, Wealth and Expenditures
Exemptions
2.4.1 The General and Special Exemption 2.4.2 Other Exemptions and Immunities The Effect of Inflation on Tax System Conclusion and Suggestions
Appendix 2.2 2.3 2.4 2.5 2.6 2.7 2 2 2 3 3 3 4 6 8 9 Taxes on Income 3.1 Introduction
3.2 The Degree of Progressivity of Income Taxation 3.2.1 How Progressive Should Income Tax Be? 3.2.2 How Does Progressivity Effect Tax Revenue? 3.2.3 Optimal Income Tax Rates
3.2.4 Measures of Progression
3.2.5 Developments in the Turkish Income Tax System 3.2.6 The Change in the Degree of Progression
3.3 Taxes on Income and Redistribution of Income 3.4 Conclusion and Suggestions
3.5 Appendix 10 10 10 10 11 13 14 15 18 22 25 30 4 Value-Added Taxation and Regressivity
4.1 Introduction
Discussions about the Regressivity of VAT Confronting the Regressivity of VAT
4.3.1 Solutions within the Stnicture of VAT 4.3.2 Role of a VAT in Fiscal Structure VAT System in Turkey
Conclusion and Suggesrtions Appendix 4.2 4.3 4.4 4.5 4.6 5 Conclusion 6 References 31 31 31 32 32 36 37 41 43 44 47
1 Introduction
Public finance is an important part of the economic activity of the governments. Taxation has the heaviest weight within the government budget that is used to finance the public expenditure programs. When we consider the volume of the economic activity of the government, we see that both taxation and the general policy applied within the public expenditure program have important effects on the redistribution of income. There comes out the trade off between efficiency and fairness in a public finance structure. On the one hand, there is an efficiency cost, if the taxes distort the optimality conditions for the individuals' economic decisions. On the other hand, the system must provide some degree of fairness in taxation that is determined by the social welfare function of the community. The optimal level of the provision of public goods and services, the tax rates on income and expenditures and the types of the taxes will be determined through a complex system of social and individual preferences in a society with different individuals.
Though it is very important to build the necessary data base for such an optimal tax model for Turkey, for the time being we will analyze the existing situation in Turkey, especially from the view point of redistribution of income through taxation.
First we will comment on the general elements in the Turkish Tax Structure that are effective on the distribution of income. Then we will focus on two very important items in the taxation system: Taxes on income and value-added tax. Here we will analyze the change in the degree of progressivity of income taxation and the distribution of effective tax burden over different income groups. The calculations about the distribution of the burden of VAT will complete this analysis. In both parts the relevant discussions in public finance will be reviewed.
As a result of these analyses, we will propose some solutions or keys to solutions in order to achieve a tax system that is effective in maintaining a more equal distribution of income. In doing so, considering the trade off between level of tax revenue and fairness, we will try to find out ways of achieving a more progressive tax stmcture without big reductions in the tax revenue.
2.1 Introduction
Before we analyze specific parts of the Turkish tax structure, it is more convenient to have a global look at the system. For this purpose we'll analyze the general structure of the tax system in terms of the share of the direct and indirect taxes, taxes on income, wealth and expenditures; exemptions and the effect of inflation.
2.2 The Share o f Direct and Indirect Taxes in the System
The share o f the direct and indirect taxes in the tax system is a major factor that determines the fairness of a tax structure. Indirect taxes are regressive taxes; the tax incidence is on consumers and therefore the tax burden on families with low income, who have to allocate a larger share for consumption in their budget, increase. However, in some cases indirect taxes are adopted to raise a progressive effect, especially when they are put on luxurious goods.
In Turkey, the indirect tax rates on goods and services are quite high and this creates a regressive effect. In addition to this, the degree of progressivity of direct taxes is decreasing through years. The extensive application of exemptions and the erosion in the income tax brackets due to inflation, distorts the ability of direct taxes to achieve tax equity. The analysis about the degree of progressivity of income taxation and the distributional aspects of value- added taxation will be considered in the following pints.
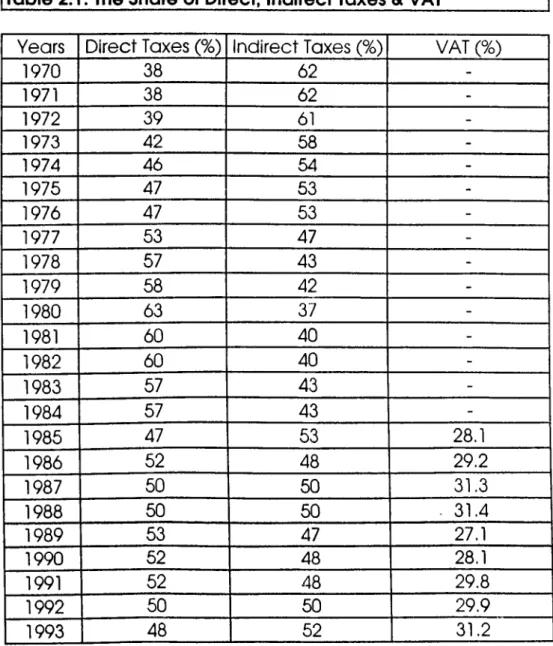
When we observe the distribution of direct and indirect taxes within the total tax revenue, we see that between 1980 and 1993, the share of indirect taxes was 37% at the beginning and it increased gradually with a steeper increase after 1985 (See Table 2.1 in Part 2.7: Appendix). The reason for this sharp increase is basically the adoption of VAT in 1985. Afterwards the shares of direct and indirect taxes within total tax revenue have become equal and in 1993 the expected share of direct taxes is 48% whereas the share of indirect taxes is 52%. It will be useful to compare these numbers with those in EEC and OECD countries. In 1990 the average share of the indirect taxes in total tax revenue is 23.6% and 28.6% in EEC and OECD countries respectively.' The share of indirect taxes in Turkey in 1990 is 48% and this is the highest number among all other countries.
2 The General View o f the Turkish Tax Structure
2.1 Introduction
Before we analyze specific parts of the Turkish tax structure, it is more convenient to have a global look at the system. For this purpose we'll analyze the general structure of the tax system in terms of the share of the direct and indirect taxes; taxes on income, wealth and expenditures; exemptions and the effect of inflation.
2.2 The Share o f Direct and Indirect Taxes in the System
The share of the direct and indirect taxes in the tax system is a major factor that determines the fairness of a tax structure. Indirect taxes are regressive taxes; the tax incidence is on consumers and therefore the tax burden on families with low income, who have to allocate a larger share for consumption in their budget, increase. However, in some cases indirect taxes are adopted to raise a progressive effect, especially when they are put on luxurious goods.
In Turkey, the indirect tax rates on goods and services are quite high and this creates a regressive effect. In addition to this, the degree of progressivity of direct taxes is decreasing through years. The extensive application of exemptions and the erosion in the income tax brackets due to inflation, distorts the ability of direct taxes to achieve tax equity. The analysis about the degree of progressivity of income taxation and the distributional aspects of value- added taxation will be considered in the following parts.
When we observe the distribution of direct and indirect taxes within the total tax revenue, we see that between 1980 and 1993, the share of indirect taxes was 37% at the beginning and it increased gradually with a steeper increase after 1985 (See Table 2.1 in Part 2.7: Appendix). The reason for this sharp increase is basically the adoption of VAT in 1985. Afterwards the shares of direct and indirect taxes within total tax revenue have become equal and in 1993 the expected share of direct taxes is 48% whereas the share of indirect taxes is 52%. It will be useful to compare these numbers with those in EEC and OECD countries. In 1990 the average share of the indirect taxes in total tax revenue is 23.6% and 28.6% in EEC and OECD countries respectively.* The share of indirect taxes in Turkey in 1990 is 48% and this is the highest number among all other countries.
2 The General View o f the Turkish Tax Structure
2.3 Taxes on Income, Wealth and Expenditures
The distribution of taxes on income, wealth and expenditures is another important point of analysis. In fact this distinction is not very different from the distinction between direct and indirect taxes. The taxes on income and wealth represent direct taxes whereas the taxes on expenditures represent indirect taxes. However, it's still important to distinguish between the taxes on income and wealth.
Between 1982 and 1993, taxes on income have the highest share within total tax revenue (See Table 2.2 for the Percentage Distribution of General Budget Collected Tax Revenue). However this share has decreased from 58.6% in 1982 to 47.2% in 1993. Taxes on income include income taxation and corporate taxation. The largest share within total tax revenue belongs to income taxation. The share of corporate tax has reached to a level of 15% in mid 80’s; however the number decreased to 6.6% in 1993. The OECD and EEC averages for the share of income tax are lower than that for Turkey and the situation is just the opposite for corporate tax share (See Table 2.3 and 2.4).
The share of taxes on wealth within total tax revenue is very low. Between 1981 and 1993, apart from small changes, this ratio has been around 0.8-0.9%. This share is even lower than half of the average share of taxes on wealth in the OECD and EEC countries (See Table 2.5). The share of taxes on wealth should be higher also in Turkey for measures of tax equity.
Through the period in concern, the share of taxes on goods and services has increased from 24.6% to 34.5%. The taxes on goods and services have the second highest share within total tax revenue. The high proportion of taxes on expenditures negatively effects the distribution of income for low income earning individuals.
2.4 Exemptions
2.4.1 The General and Special Exemption
It's a common practice for most of the countries to exempt a certain level of income from tax. For the sake of tax equity, it is accepted that the ability to pay tax begins above a certain level of income. According to the "ability to pay" principle, the tax rates on wage income should be relatively lower and/or there should be a special exemption for a certain part of wage income, since the wage earners usually have lower ability to pay than profit earners.
In Turkey the application of general and special exemption started in 1981 and the level of exemption stayed constant until 1985. Between 1981 and 1985, the general exemption was 20 TL of the daily earning for the individual tax payer and there were additional exemptions of 15 TL/day for the mate and 5 TL/day for the children who were dependent on the tax payer. The level of
special exemption, which was available only for the wage income earners, was 150 TL/day, 4500 TL/day and 54000 TL/year. This level of discount was equal to the minimum wage level of the period. In 1986 the general exemption was canceled and was added to the special exemption level whose amount increased to 72.000 TL. The later arrangements were quite meaningless when compared with the high levels of inflation. Table 2.6 shows the real amount of special exemption for each year. The real amounts are obtained by deflating the nominal amounts by the consumer price index on the basis of 1981. If we accept the real exemption index in 1981 as 100, then in 1993 the index has decreased to 21.8 (See third column of Table 6). The exemption level in 1994, which is 600.000 TL/month is also much lower than the minimum wage level.
The exemption level for income taxation in Turkey, is also lower than other countries. In most countries the income necessary for minimum survival level is either exempted from tax or there are reimbursement mechanisms for the tax paid on this level of income.
In 1984, in countries like Egypt, Saudi Arabia who has a GDP amount near to Turkey, the ratio of exemption to family income for a foiu--individual family who earns a minimum level of income was 78%. The same ratio was 268% and 123% in Indonesia and Thailand respectively, whereas it is only 10% in Turkey.- Moreover, different from many other countries in Turkey expenditures like education or health isn't subject to any exemption. Therefore the level of exemption is quite irrelevant.
As a result the special exemption that was received by wage earners had a low level right from the beginning, and by the rapid rise of inflation through years, the exemption has completely lost its effect.
2.4.2 Other Exemptions and Immunities
There are some economic and social reasons for exempting some part of expenditures, income or wealth of tax payers. Although this generally has the purpose of creating incentive for productive activity, exports, etc., there also exists the disadvantages in terms of decreasing the tax revenue of government and creating tax advantages for some tax payers while distorting the tax equity and income distribution.
The exemptions for artisans, small agriculture's and the ones who earn a minimal level of income, have social purposes. On the other hand the exemptions in corporate taxation and exemptions for investment usually have economic purposes, such as creating incentive for certain activities. Most of the exemptions in Turkey are in corporate taxation and/or for investment. In general such exemptions have been widely applied after 1980 to motivate exchange earning activities and institutionalization.
Investment exemption has been adopted to support economic development and to create incentive for private investment in certain sectors. When the firm benefits from investment exemption, a certain percentage of investment expenditures can be discounted from taxable profits.
In order to benefit from investment exemption, the firm must determine its profits according to balance sheet and the investment in consideration must be proper according to the development plans that are prepared by the State Institute of Planning. In general the investment must be at least 1 billion TL; for agricultural sector and for the sectors that are accepted by the High Planning Committee this amount is 100 million TL.
The investment discount is usually 30% of the total investment. This ratio increases upto 40% for investments related to regional development and agricultural sector. Hundred percent of discount is also possible in regions that have priority in development plans.
Though exemption for investment gives incentive for investment, it also causes a certain percentage of income not to be taxed. The basic purpose of exemption for investment is to increase total investment, employment, efficiency and production in the long run. It is usually assumed that this increase can tolerate for the reduction in public revenue. But, there is also a probability such that exemption for investment will cause a general reduction in investment level by causing a reduction in public inve.stment.
In general there are 21 immunity and 18 exemption items in the corporate taxation law. The total exemptions and immunities added upto 593 billion TL in 1985 and this amount increased 7.5 times in 1988 upto 4.5 trillion TL.
The increase in certain exemptions and immunities is particularly striking. Especially the amount of exemptions for exports and investment has increased 11 times between 1985 and 1988. Table 2.7 shows the development of exemptions and immunities in this period.
It is more important to observe the effective tax rates and tax losses in corporate taxation. The ratio of total amount of exemption to the pre exemption profit in the corporate sector increased from 23.3% in 1985 to 45.6% in 1987 and 42.2% in 1988. The ratio of tax loss to the realized corporate tax revenue is 92% in 1988. Thus, in 1987 and 1988 there has been a tax loss that is equal to the realized tax revenue, through legal mechanisms. Table 2.8 shows the tax loss and effective tax rates in corporate taxation between 1985 and 1988.
The effective corporate tax rates are quite below the legal rate. Especially in 1987 and 1988 the effective tax rates that are 22 and 21% respectively, don't reach even to half of the legal rate which was 46%. By 1994, the legal rate is 25% and there is a legal restriction of 20% for the lower bound of the effective rate. But the confusion about the exemptions is not settled yet.
The number of exemptions and immunities in the law and the total amount that they add upto has caused corporate taxation to lose its real identity and to
turn out to be a law of exemptions. Also, the items of exemptions and immunities were not chosen after a detailed research about how they would effect the economy and the authorities haven't been selective enough in their choices. As a result some tax payers have developed a tendency to make use of the law of exemption for the purpose of tax evasion.
The exemptions and immunities in the tax system create an important distortion in relative prices between sectors that are exempted and that aren't. Moreover, in sectors that make use of the tax exemptions the effective tax rates are very low and this causes a ftuther distortion in terms of horizontal tax equity in addition to the vertical equity.
2.5 The Effect of Inflation on Tax System
The high rates of inflation that Turkey has been experiencing for a long period, effect all the elements of the tax system. The effects of inflation must be considered both from the view point of government and tax payers. In periods of high inflation, if the absolute numbers in the tax system aren't changed, then an important level of real erosion takes place in specific tax rates, exemptions, immunities and income tax brackets. The erosion in specific rates creates an advantage for tax payers. Conversely, all other erosions increase the tax revenue, thus creates an advantage for the government.^ In addition to these, inflation effects the value of quantities like interest income, stocks and wealth that are important items of the tax base. Therefore in general, inflation distorts the distribution of after tax income.
The mostly effected tax by inflation is the income tax. As nominal income increases due to inflation, the income tax brackets don't rise proportionally with inflation. Therefore the ones who are in lower tax brackets creep upto higher brackets. This creates a disadvantage for the tax payer and an advantage for the government in terms of tax revenue. On the other hand, the exemptions in income taxation, which are determined by nominal amounts, cannot compete with the high rates of inflation and this further increases the tax burden on tax payers. Moreover, since the width of the brackets increases more as we move up the income scale and the marginal tax rates are constant after a certain level of income, the individuals who are at the higher income levels don't experience the disadvantage that is caused by the bracket creep.
Inflation distorts both the progressive structure of the income tax scheme and the structure of corporate tax, taxes on wealth, etc. which are expressed by constant values due to the erosion in the tax base.
Also, the inflation tax that is bom out of the erosion in the value of liquid assets due to inflation, has created an important burden over large masses. It is reported that, during 1980's, the average burden of inflation tax over the
society has been around 3% of GNP·*. There are basically two ways to confront the problems that are created by inflation: The quantities that are expressed in nominal terms in the tax structure (income tax bracket, exemptions, etc.) can be indexed with respect to inflation rate or the tax system can be adjusted manually each year. During 1980's, there has been a great deal of adjustment in tax brackets and exemptions to catch up with the rises in prices. However we cannot talk of a success story about this attempt. There are only a few cases where the adjustments followed the inflation rate closely^. The history of general and special exemptions in income taxation, which we have already analyzed and the structure of income taxation that we will analyze in the following chapter proves these weaknesses.
Indexation method has been preferred by most of the Western countries after the high inflation rates in 1970's. However the problem doesn't end by a simple indication. Usually the index used for the adjustments, namely CPI, which gives a "summary" of the changing relation between commodities and consumers. This summary is by means of a single number and represents the average consumer. But when the level of unstability of the prices and the inequality in the distribution of income increases, neither CPI nor any other single number can adequately explain the real effect of price changes on different individuals. When relative prices change as well, the impact of this change will be as important as that of average price change. The adjustment of income tax brackets will be even harder under high inflationary conditions. There is the possibility that, when the price of the basic necessities is rising and the price of the superior goods is falling, the cost of living could be rising for the poor and falling for the rich^. CPI cannot explain such complexities. The simple application of CPI in the adjustment of tax brackets will under compensate the poor and overcompensate the rich, since it is only an average value for the real relation. The simple application of CPI to tax bracket adjustment could turn a progressive tax system into one with a regressive effect. An inflation-free tax system should eliminate this possibility. This is not a matter of constructing price indices for different groups, but of stepping back from the price index concept itself.’ In our analysis we will use the CPI to deflate the nominal values, although we are aware of the bias that is carried within this single number. This small remark points at the necessity to rework the data about the price changes in Turkey.
•»Uluatam, 6 (1990), p.26. ^ibid. pp.32-33.
'^Afriat, S. N. (1994). ’ibid.
2.6 Conclusion and Suggestions
The share of the direct and indirect taxes, the distribution of tax revenue between taxes on income, corporate profits, wealth and expenditures are all important items in building the criteria for tax equity. The position of Turkey, in terms of tax equity, is worse than the OECD and EEC countries on the average.
The level of exemption in income taxation has become completely irrelevant in time, whereas the exemptions in corporate taxation have increased to such an amount that they have almost turned out to be a legitimate mechanism for tax evasion. This is an important factor that contributes to the decreasing level of tax equity in Turkey. The system of exemptions needs a great deal of reconsideration.
The level of inflation especially creates disadvantages for the low income individuals and this further decreases the degree of progressivity in the tax system. There is an urgent need for an automatic adjustment mechanism in the tax system that considers the different rates of inflation applying to different income groups.
2.7 Appendix
Table 2.1 The Share of Direct and Indirect Taxes and VAT within Total Tax Revenue (1970-1993)
Table 2.2 Percentage Distribution of Tax Revenue (1982-1993)
Table 2.3 Share of Income Tax in Total Tax Revenue in OECD and EEC Table 2.4 Share of Corporate Tax in Total Tax Revenue in OECD and EEC Table 2.5 Share of Tax on Wealth in Total Tax Revenue in OECD and EEC Table 2.6 Special Exemption in Income Taxation (1981-1993)
Table 2.7 The Exemptions in Corporate Taxation (1985-1988) Table 2.8 Tax Loss and Effective Tax Rates in Corporate Taxation
Table 2.1: The Share of Direct, Indirect Taxes & VAT
Years Direct Taxes (%) Indirect Taxes (%) VAT (%)
1970 38 62 -1971 38 62 -1972 39 61 -1973 42 58 -1974 46 54 -1975 47 53 -1976 47 53 -1977 53 47 -1978 57 43 -1979 58 42 -1980 63 37 -1981 60 40 -1982 60 40 -1983 57 43 -1984 57 43 -1985 47 53 28.1 1986 52 48 29.2 1987 50 50 31.3 1988 50 50 . 31.4 1989 53 47 27.1 1990 52 48 28.1 1991 52 48 29.8 1992 50 50 29.9 1993 48 52 31.2
Table 2.2: Percentage Distribution of General Budget Tax Revenue (1982-1993)
Type of Revenue 1982 1983 1984 1985 1986 1987 1988 1989 1990 1991 1992 1993
1-Total Tax Revenue (2+5+8+9+10) 100 100 100 100 100 100 100 100 100 100 100 100
2-Taxes on Income (3+4) 58.8 56.6 56.5 46.3 51.1 48.9 48.6 52.7 51.2" 51.4 49.5 47.2
3-lncome Tax 45.6 45.5 45.1 34.6 35.2 34.2 33.7 38.6 41 42.4 42.4 40.6
4-Corporate Tax 13.2 11.1 11.5 11.7 15.9 14.7 14.9 14.1 10.2 9 7.1 6.6
5-Taxes on Wealth (6+7) 0.8 0.7 0.6 0.6 0.9 0.7 1 0.7 0.9 0.9 0.9 0.9
6-Tax on Motor Vehicles 0.5 0.4 0.4 0.4 0.7 0.6 0.8 0.5 0.7 0.7 0.7 0.8"
7-Tax on Bequest 0.3 0.3 0.2 0.2 0.2 0.2 0.2 0.2 0.2 0.2 0.2 0.2
8-Taxes on Goods & Expenditures 24.5 26.8 25.3 28.7 31 30.6 31.5 29.9 30.1 31.4 33.4 34,5
9-Taxes on External Trade 10.4 12.3 15.6 19.5" 16.6 19.6 18.8 16.6 17.7 16.4 16.1 17.1
10-Remedies of Canceied Taxes 5.6 3.6 1.9 4.9 0.3 0.1 0 0.1 0 0 0 0.2~
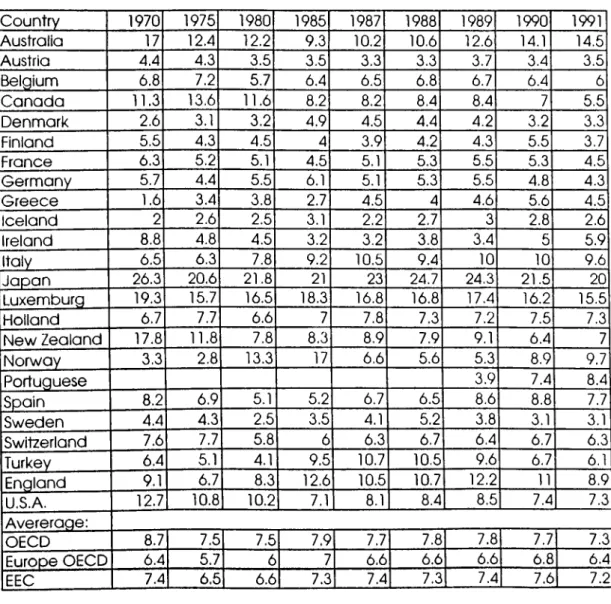
Table 2.3: Share of Income Tax in Total Tax Revenue in OECD and EEC C o u n try 1970 1975 1980 1985 1987 1988 1989 1990 1991 A u stra lia 37.3 43.6 44 45.3 45.2 45.7 44.3 43.1 41 .4 A u stria 20.7 21.6 23.2 22.9 22.7 22.4 19.9 21.1 21.9 Be lg iu m 24.4 31.9 35.2 34 32.5 31.7 30.5 30.8 30.3 C a n a d a 32 .4 32.8 34.1 35.2 38.5 37.1 38.4 40.4 40.7 D e n m a rk 48 .6 55.9 51.8 50.2 49.2 51 51.7 52.6 53 .4 Fin la n d 42 48 .5 44.7 47 45.4 46.2 45.3 46.8 48 .5 Fra n c e 12 12.3 12.9 12.8 12.8 12 11.8 11.8 13.5 G e rm a n y 26.7 30 29.6 28.7 29.1 28.9 29.5 27.6 27.1 G re e c e 9.7 8.9 14.9 13.9 12.6 14 13.3 14.5 12.5 Ic e la n d 19.9 20.2 23.1 19.5 20.7 23.8 24.2 26.5 26.4 Ire la n d 18.3 25.2 32 31.3 34.7 34.8 31.7 32 32,3 Ita ly 10.9 15.2 23.1 26.7 26.3 26.8 26.7 26.3 26.4 Ja p a n 21.5 23.9 24.3 24.7 24.1 23.2 24.7 26.8 26.9 Lu xe m b u rg 24.1 27.8 26.8 26.3 24.8 23.7 23 24.1 22.2 H o lla n d 26.8 27.1 26.3 19.4 19.6 20.5 21.3 24.7 26.2 N e w Ze a la n d 42.7 54.3 61 .6 59.8 49 .9 50.9 46.7 46 .4 45 N o rw a y 35.2 31.5 28 22.3 26.4 27.9 27.4 25.8 25.7 P o rtu g u e se 13.9 15.9 17.8 Sp a in 11.5 14.5 20.4 19.7 21.4 21.5 22.8 21.7 23.4 Sw e d e n 49 .8 46". 1 41 38.5 37.1 38.8 39.2 37.9 34.2 S w itze ria n d 33.2 36.1 35.6 34.9 34.1 34.2 33.5 34.3 34.3 Tu rk e y 27 32.9 43.5 27.5 24.9 23.8 26.4 26.8 28.7 E n g la n d 3 1 . i 37.9 29.8 26.5 26.6 26.6 27 28.6 28.5 U .S.A . 1 35.2 32.8 36.9 35.7 36.2 34.8 35.7 35.8 34.9 U n w e ig h te d A ve re ra g e ; O EC D 27.9 30.9 32.3 30.6 30.2 30.4 29.5 30.1 30.1 E u ro p e O EC D 26.2 29.1 30.1 27.8 27.8 28.3 27.3 27.9 28.1 EEC 22.2 26.1 27.5 26.3 26.3 26.5 25.3 25.9 26.1
Table 2.4: Share of Corporate Tax in Total Tax Revenue in OECD and EEC C o u n try 1970 1975 1980 1985 1987 1988 1989 1990 1991 A u stra lia 17 12.4 12.2 9.3 10.2 10.6 12.6 14.1 14.5 A u stria 4.4 4.3 3.5 3.5 3.3 3.3 3.7 3.4 3.5 B e lg iu m 6.8 7.2 5.7 6.4 6.5 6.8 6.7 6.4 6 C a n a d a 11.3 13.6 11.6 8.2 8.2 8.4 8.4 7 5.5 D e n m a rk 2.6 3.1 3.2 4.9 4.5 4.4 4.2 3.2 3.3 Fin la n d 5.5 4.3 4.5 4 3.9 4.2 4.3 5.5 3.7 Fra n c e 6.3 5.2 5.1 4.5 5.1 5.3 5.5 5.3 4.5 G e rm a n y 5.7 4.4 5.5 6.1 5.1 5.3 5.5 4.8 4.3 G re e c e 1.6 3.4 3.8 2.7 4.5 4 4.6 5.6 4.5 Ic e la n d 2 2.6 2.5 3.1 2.2 2.7 3 2.8 2.6 Ire la n d 8.8 4.8 4.5 3.2 3.2 3.8 3.4 5 5.9 Ita ly 6.5 6.3 7.8 9.2 10.5 9.4 10 10 9.6 Ja p a n 26.3" 20.6 21.8 21 23 24.7 24.3 21.5 20 Lu xe m b u rg 19.3 15.7 16.5 18.3 16.8 16.8 17.4 16.2 15.5 H o lla n d 6.7 7.7 6.6 7 7.8 7.3 7.2 7.5 7.3 N e w Ze a la n d 17.8 11.8 7.8 8.3 8.9 7.9 9.1 6.4 7 N o rw a y 3.3 2.8 13.3 17 6.6 5.6 5.3 8.9 9.7 P o rtu g u e se 3.9 7.4 8.4 Sp a in 8.2 6.9 5.1 5.2 6.7 6.5 8.6 8.8 7.7 Sw e d e n 4.4" 4.3 2.5 3.5 4.1 5.2 3.8 3.1 3.1 S w itze rla n d 7.6 7.7 5.8 6 6.3 6.7 6.4 6.7 6.3 Tu rk e y 6.4 5.1 4.1 9.5 10.7 10.5 9.6 6.7 6.1 E n g la n d 9.1 6.7 8.3 12.6 10.5 10.7 12.2 11 8.9 U.S.A . 12.7 10.8 10.2 7.1 8.1 8.4 8.5 7.4 7.3 A ve re ra g e : O EC D 8.7 7.5 7.5 7.9 7.7 7.8 7.8 7.7 7.3 E u ro p e O EC D 6.4 5.7 6 7 6.6 6.6 6.6 6.8 6.4 EEC 7.4 6.5 6.6 7.3 7.4 7.3 7.4 7.6i 7.2
Table 2.5: Share oi Taxes on Wealth In Total Tax Revenue in OECD and EEC C o u n try 1970 1975 1980 1985 1987 1988 1989 1990 1991 A u stra lia 11 8.8 7.8 7.8 9.2 9.7 8.8 9 9.8 A u stria 3.7 3.1 2.9 2.4 2.3 2.6 2.7 2.7 2.7 B e lg iu m 3 2.3 2.4 1.8 2.2 2.4 2.7 2.6 2.5 C a n a d a 13 9.5 9.1 9.3 8.8 9 9 9.2 9.5 D e n m a rk 6 5.9 5.7 4.2 5.1 4.7 4.4 4.2 3.7 Fin la n d 2.3 2.1 2.1 3 3.2 3.6 3.9 2.8 2.7 Frd n c e 3.5 3.4 3.5 4.4 4.7 5 5.1 5.3 5.8 G e rm a n y 4.9 3.9 3.3 3 3.1 3.1 3.1 3.4 2.8 G re e c e 9.3 9.7 4.6 2.7 2.6 3 3.4 4.8 3.8 Ic e la n d 4,5 5.1 6.3 7.3 7.7 7.3 8 8.5 8.8 Ire la n d 12.2 9.7 5,3 4 4.4 4 4.8 4.7 4.6 Ita ly 6 3.3 3.7 2.5 2.6 2.5 2.3 2.3 2.5 Ja p a n 7.6 9.1 8.2 9.7 11.2 11.1 10.2 9 9.3 Lu xe m b u rg 6.6 5.1 5.7 5.7 6.7 7.5 8.2 8.5 7.6 H o lla n d 3.3 2.4 3.6 3.5 3.6 3.5 3.8 3.6 3.6 N e w Ze a la n d 10.41 9.2 7,9 7,4 6.3 6.6 6.6 6.5 6.2 N o rw a y 2.4 2.3 1.7 1.9 2.4 2.8 2,9 2.9 2.9 P o rtu g u e se 4.2 2.5 1.4 1.9 2 1.9 1.5 2.4 2.4 Sp a in 6.5 6.3 4.6 3.5 3.7 5.3 5.1 5.5 5.1 Sw e d e n 1.5 1.1 0.9 2.3 5.7 3.1 3.3 3.5 4.1 S w itze rla n d 8.8 7.1 7.3 8.2 8.5 8.3 8.7 7.8 7.2 Tu rk e y 10.8 6.9 5.4 4.6 3.2 2.8 2.5 2.3 2.2 En g la n d 12.4 12.7 12 11.9 13.2 12.8 12.4 8.8 8.2 U .S.A . 13.6 13.2 10.1 10.1 10.2 10.4 10.3 10.8 11.2 A v e re ra g e : O EC D 7 6 5.2 5.1 5.5 5.5 5.6 5.5 5.4 E u ro p e O EC D 5.9 5 4.3 4.1 4.6 4.5 4.7 4,6 4.4 EEC 6.6 5.6 4.7 4.1 4.5 4.6 4.7 4.7 4.4
Table 2.6:Specigl Exemption in Income Taxation Years Nominal Exemption ( T L / y e a r ) Real Exemption Real Exemption index (base year: 1981) 1981 54000 54000 100 1982 54000 41186 76.3 1983 54000 31355 58.1 1984 54000 21130 39.1 1985 54000 14580 27 1986 72000 14443 20 1987 72000 10401 19.3 1988 144000 11861 21.9 1989 216000 10897 20.1 1990 432000 13596 25.1 1991 648000 12287 22.7 1992 108000 12401 22.3 1993 1800000 11790 21.8
Table 2.7 The Exemptions in Corporate Taxation (billion TL)
Exemptions 1985 1986 1987 1988
Dividend Payments 52.8 30.2 141.8 235.7
Export of Industrial Products 137.5 199.4 659.4 1553.6
Export of Agricultural Products 14.8 34.4 25.4 29
Tourism 7.1 29.6 54.7 69.3 Investment 99.7 322.7 671.1 1185.9 Fund of Finance 12.6 55.3 316.6 121.6 Others 268.3 975.9 1404.5 1268.7 Total 592.8 1647.2 3273.5 4481.8 Source:TOBB(1992), p.l23
Table 2.8: Tax Loss and Effective Rates in Corporate Tax
(billion TL) 1985 1986 1987 1988
Pre-exemption Corporate Protit(l) 2545 4412 7175 10615
Total Exemption (2) 593 1647 3274 4482
Collected Corporate Tax (3) 600 1201 1568 2240
Tax Loss (4) 273 758 1506 2062
Exemption/Profit (%) (2)/(l) 23.3 37.3 45.6 42.2
Effective Tax Rate (%) (3)/(l) 23.5 27.2 21.8 21.1
Tax Loss (%) (4)/(3) 45.5 63.1 96 92
3 Taxes on Income
3.1 Introduction
In Turkey, taxes on income include income and corporate taxes. Income tax is levied on wage and salaries, the first sale of agricultural products, rental and interest earnings and the non-corporate earnings that are taxed according to the declared level. Corporate taxation is for the corporate profits. As we have observed in Part 2, taxes on income have the highest weight within the total tax revenue. Therefore, it is particularly important to analyze the distributional considerations of taxes on income. In this part, we will concentrate our analysis on two basic points;
1. The degree of progressivity of income tax system,
2. The redistributive effects of the taxes on income (both income and corporate tax)
3.2 The Degree o f Progressivity o f Income Taxation 3.2.1 How Progressive Should Income Tax Be?
Most people support tax progressivity due to the assumption that ability to pay increases more than proportionately with income*. But there has never been an easy receipt to determine an optimal level for progressivity. What makes it hard to define a receipt, is usually the disagreement about the assumptions on the behavioral response of households to taxation and the nature of inequality in the society. The optimal tax system depends on the assumptions of the analytical model which in turn depend on the normative judgments. The answers to the following questions are critical in these terms: What is the effect of different assumptions about the elasticity of labor supply response to taxation, the specification of the social welfare function, social cost of inequality in the distribution of income and resources?
The typical model in the modem literature is Mirlees' formulation where the government maximizes some social welfare function that is a function of the level of welfare of each household subject to raising some target amount of total tax revenue®. The tax structure effect the labor-leisure decisions of the households. Thus high marginal tax rates may reduce households' supply of labor and in turn total output and tax revenue.
The social welfare function answers questions about the normative judgments of the society such as fairness and equity. More egalitarian social welfare functions lead to more progressive optimal income tax schemes.
*Musgrave, R.A. and P.B. Musgrave (1973), pp. 198-204. ®Mirlees, J. (1971).
Important questions are how much of national income the society is willing sacrifice in order to achieve a more equal distribution of income and what the social value of an additional unit of income to individuals with different level of income is. According to one extreme answer to such questions, the optimal tax scheme may even be extremely regressive if the society does not care for distributional aspects at all.
The initial distribution of resources is also important. As the inequality within the initial distribution increases, the social gains from a redistributive tax system will increase.
3.2.2 How Does Progressivity Effect Tax Revenue?
The behavioral response function determines the degree of labor supply response to change in tax rates. With a more responsive behavioral function, the efficiency cost of redistributive tax systems increases. This is one of the most debatable aspect of the empirical studies in optimal tax literature. Pechman reports that historical trends in US. labor supply are not consistent with the finding that taxes have reduced work effort‘s. He further argues that studies in other countries are not reliable enough to support conclusions about the relationship between taxes and labor supply, and the strongest conclusion he draws from the available evidence is that the incentive effects of taxation have been relatively small. Thus, under the circumstances, so long as the tax rates are not pushed to very extreme levels like 100%, incentive considerations don't justify the neglecting of the distributional objective of tax policy.
This discussion brings us to the relationship between tax progressivity and tax revenue. At this point, there are two separate lines of reasoning. The first is based on the welfare costs of income taxation that arise from tax payers' work- leisure decisions. Thus the impact of progressive taxes on tax revenue is determined by the relative strength of the offsetting income and substitution effects between work and leisure. Assuming leisure to be a normal good, for a community of identical individuals, a progressive income tax will generate less revenue than a proportional income tax with the same average rate according to welfare theory. This is because, the income effect that positively effects the leisure decision is determined by the average tax rate, whereas the substitution effect that negatively effects the leisure choice is determined by the marginal tax rate. In a progressive tax scheme marginal rate always exceeds the average rate; thus the substitution effect offsets income effect and labor supply is lower with a progressive tax structure. However, the validity of this theory depends on labor response function. We will try to analyze the situation for Turkey in the following pages.
The result of the welfare theory is ambiguous for a community of different individuals. It depends upon individual marginal rates of substitution. Thus this *®Pechman, A. (1990), p.7.
is an empirical matter. If the income elasticity for leisure is high for high income individuals, then progressive tax structure generates more revenue.
The second line of reasoning is within the framework of public choice theory that concentrates on the decisions made by voters and governments. Brennan and Buchanan builds a model for a single individual community where the revenue maximizing government can "walk down" the tax payers' demand curve like first-degree monopoly price discrimination". Within the paradigm of Leviathan government, tax revenue maximization results in a regressive tax scheme where the government converts the consumer surplus into tax revenue. Here again, when the model is expanded to a community of different individuals, the effects of progressive and proportional income taxes on tax revenue depend on individual elasticities.
Another approach within the public choice framework is the median voter approach, which discusses how the structure of a tax system effects the voting decisions about public budgets. Buchanan argues that, with progressive taxes average tax paid by the median voter falls as the average tax paid by the high income individual rises and therefore the median voter will select a larger public budget (higher tax revenue requirement for the government) under a more progressive tax structure*-. Contrary to this "average cost share" approach, Brennan develops another approach based on marginal cost shares*^. Progressive taxes raise the marginal cost share of the median voter, then at the margin the median voter prefers a smaller public budget the more the level of progression is. Thus, if the average tax is held constant, the progressivity of the tax system should be negatively related to revenue.
Hunter and Scott build a theoretical model to test the relationship of progressivity and revenue generation based on the median voter theorem'·*. The results of their empirical test using data from the forty states, show that Gini coefficient (an index of system progressivity of the income taxes), average tax rate for the median income individual and the unemployment rate have a statistically significant effect on the level of tax revenue. Raising the average tax rate increases the tax revenue whereas unemployment level negatively effects revenue generation. However, the Gini index has a negative coefficient, thus increasing the degree of progressivity, holding the average tax rate constant, leads to lower levels of tax revenue, ceteris paribus.
"Brennan, G. and J. M. Buchanan (1980). ' “Buchanan, J.M. (1964).
'^Brennan, G. (1977).
In this section, we will report some of the results of the general model of Mirlees due to different assumptions about the social welfare function, initial distribution of endowments and behavioral response of individuals.
Sadka argued that as long as there is a finite upper bound to the income distribution and as long as the welfare of the most well off individual in society carries some positive weight in the social welfare function, the marginal tax rate at the top of the income scale should be zero‘d. This is intuitively explained by the idea that the highest earning household is better off under the zero marginal tax rate, works more and gives a higher amount of tax on the average and all other individuals are at least as well off. They may be strictly better off, if the increased tax revenue is spent to develop a progressive public finance structure. Although this result is striking in showing that playing with the tax rates isn't the only way for achieving an egalitarian fiscal structure, it has received many criticisms. Mirlees argues that zero is a bad approximation to the optimal tax rates at the top“^. Seade reports that decreasing the marginal rates to zero at the top, improves the matters only by raising the well-being of a very small group of people who are at the very top'"^.
Mirlees, using a simple utilitarian social welfare function, a lognormal distribution of ability and an identical Cobb-Douglas utility function of goods and leisure for each individual, found an approximately linear optimal tax structure where marginal tax rate is constant and there is an exemption level below which tax liability is negative. Due to the presence of exemption level, tax liability increases with income and there is some level of progressivity. In this model marginal tax rates were between 20-30% and usually lower than 40%. He also found that increasing the dispersion of skills increased the optimal tax rates but not to a great extent.
Atkinson,explored the effect of increasing the egalitarianism of the social welfare flmction. Even in the extreme case of the maximin social welfare function, the model generated optimal tax rates not much higher than 50%*“.
Stem suggested that more egalitarian social welfare functions and less substitutability imply much higher marginal tax rates*'·'. In Stem's case, the optimal marginal tax rate of a linear tax system is 54%. The Cobb-Douglas response function with an elasticity of substitution of one for leisure is not a reasonable estimate of labor supply responsiveness in real life according to him.
3.2.3 Optimal Income Tax Rates
*5Sadka, E. (1976). '^Mirlees, J. (1976). ‘■'Seade, J. (1977). *“Atkinson, A. (1973). ii»Steni, N. (1976).
Further discussion about the scheme arises due to the introduction of uncertainty to the model. If there is income uncertainty which is uncorrelated across individuals and for which private insurance markets don't exist, then taxation becomes some form of social insurance-“. Moreover, now the optimal marginal tax rate at the highest level is likely to be high, because under uncertainty high level of income is probably due to the random component of income and taxing an income highly due to random effects will have minimal disincentive effects.
The standard optimal taxation model is one-period. But in a long-run context, the social welfare function must contain information about the relative social valuation of income received by individuals who are alive at different periods in time. In such a long-run context, the efficiency cost of taxation increases, because substitution effect is now not only for leisure but also for future-present consumption decisions. As the efficiency cost increases due to such considerations, the optimal level of progressivity will be decreased. Also adopting a lifetime perspective is important for the measurement of the redistributive impact of a given tax system. An apparently redistributive tax system may be merely transferring income among time periods without materially transferring income between households. Attention must be paid to the transmission of wealth mechanism, including the role of gifts, inheritances and marriage patterns-'.
3.2.4 Measures o f Progression
In general a tax scheme is progressive if the average tax rate rises when moving up the income scale, proportional if the average tax rate is constant and regressive if the rate declines. But this general definition does not tell us much about the degree of progressivity; thus the changes in the slope of the average tax rate curve.
There are basically three methods of measuring the degree of progressivity--:
1. Average rate progression:
This measure refers to structural progress!vity-^. It measures the ratio of change in average rate to change in income. According to this concept the tax is progressive when the average rate of tax increases as a function of taxable income. For discrete income intervals, the formula for average rate progression coefficient is as follows:
-“Diamond, Hermes and Mirlees (1980). Eaton, J. and H. Rosen (1981), Varian, H. (1980).
-'Slemrod, J. (1983). ^“Musgrave... pp.261-263.
Average Rate Progression=(T,/Y, - T /Y J / (Y, - Y„), where T_= tax liability for level,
Y= income for level i.
The value of the coefficient is zero for a proportional tax and positive for progression.
2. Liability progression:
This measure refers to system progressivity-·*. It measm"es the ratio of percentage change in liability to percentage change in income; thus the elasticity of tax liability with respect to income. System progressivity reflects the incentives within the tax system-^. For discrete time intervals the formula for this measure is as follows:
Liability progression coefficient=( T, - T„)/ T^ / (Y, - YJ/Y^
The value of the coefficient is one for a proportional tax and greater than one for progression. Thus the percentage change in tax liability is more than percentage change in income if the system is progressive.
3. Residual income progression:
This measure refers to effective progressivity-^*. It measures the ratio of percentage change in after tax income to percentage change in before tax income; thus the elasticity of after tax income with respect to before tax income. For discrete income intervals, the formula is given by;
Residual income progression coefficient=((Y,-T,)-(Y„-T„))/(Y„-TJ/(Y, -Y„)/Y„ The value of the coefficient is one for a proportional tax and less than one for progression. Thus the percentage difference in after tax income is less than the percentage difference in before tax income for progression. Residual income progression coefficient is an equity measure of the distribution of tax burden.
These different measures give different aspects of the level of progression. For example, if all average tax rates are increased by an equal percent, liability progression stays constant and average rate progression and residual income progression fall. If all average tax rates are raised by an equal number of percentage points, then average tax progression remains constant and liability and residual income progression fall. The first type of rate increase is preferable for low and the second for high incomes-’. Thus the definition of neutrality isn't independent from different measures of tax distribution.
3.2.5 Developments in the Turkish Income Tax System
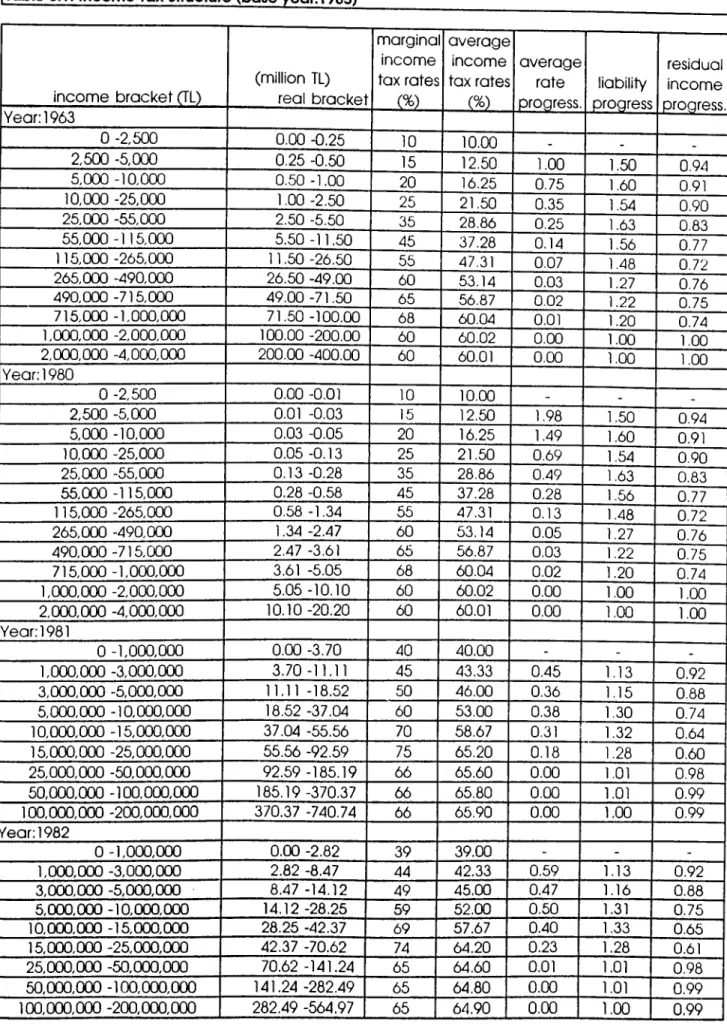
In Turkey, the income tax system that was adopted in 1963 continued until 1981 without any change. In this first system, there were 10 income tax
“■’Hunter and Scott (1987), p.l97. ’^ibid...
brackets and the marginal tax rates raged between 10% and 68% where the marginal rate for the top bracket was 60%.
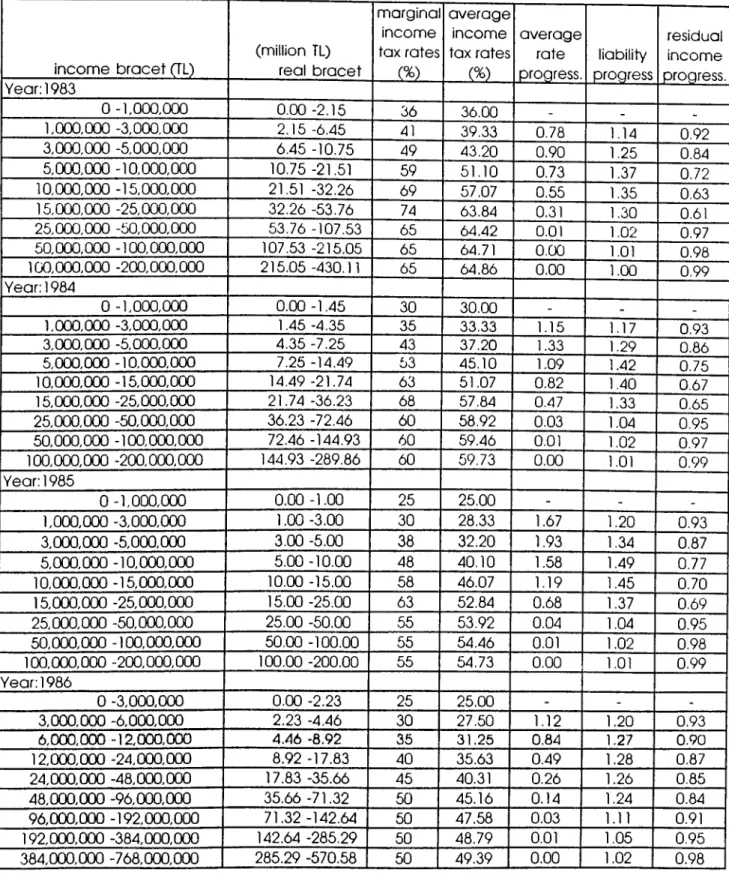
After 1980, the, tax system has changed every year. Table 3.1 shows the income tax system from 1963 to 1993-**. In 1981 the lowest marginal tax rate was increased upto 40% and the highest rate was 75% whereas the top income bracket was taxed at 66% at the margin. Moreover the number of brackets was reduced to 7. Indeed the system in 1981 has grouped the first 10 brackets of the previous system within a single tax bracket. Because of the erosin due to inflation the lower tax brackets had already become irrelevant by 1980; the tax reform in 1981 only prepared a law to fit to this fact. This is a negative development in terms of tax equity. From 1981 to 1985 the tax rates for the first bracket have been lowered each year and finally dropped down to 25%. But the marginal tax rate for the highest bracket also decreased to 63%.
The changes in the marginal tax rates after 1981 have caused losses in tax revenue rather than gains. The big initial change in 1981 has caused the largest loss of 1.45% of GDP. In 1982 the reduction in rates initially caused a small increase in tax revenues by 0.16% of GDP. But this didn't last long and between 1983 and 1985, the loss of revenue ranged from 0.99% to 0.40% of GDP-*'. The decrease in tax revenue is a combined effect of the fall in the average rates for all income brackets. The degree of progression increases in this period and here we partially analyze the trade off between degree of progression and tax revenue. But this is only a partial result about the decrease in tax revenue, because the decrease in the effectiveness of the tax collection mechanism in this period is also one of the reasons that contribute to the decrease in tax revenue. In the following pages we will also analyze the response of the highest bracket to decreasing average tax rates to see how the welfare theory applies to our case.
At this point it is important to observe effective tax rates that will show the ratio of the collected tax to the tax base for each income group. This indicates the effectiveness of the mechanism to collect the realized revenue. These figures that were being published formerly in the Bulletin of Tax Revenue by the Ministry of Finance and Customs are not being published since 1983. But a study made by the World Bank in 1987 for Turkey uses such figures for 1980 and 1986. We will use this report to analyze the effective tax rates for different income groups^“. Table 3.2 shows the effective rates for each income group between 1980 and 1986.
The report uses the income levels declared by the tax payers as the tax base. But since there always is a probability of false declaration, there is some level of over estimation for the effective rates.
“*Note that additional income tax brackets are added above the top income bracket to point at the convergence of average and marginal rates after a certain level of income.
"^World Bank (1987), p.36. ^^ibid...
If we assume that the declared base is the true base, we observe that the effective rates are in general lower than the legal rates and this is an important failure in Turkish tax structure in terms of the inability of collecting the tax on the declared level of income. When we approach the problem from the view point of income groups, we observe that the effective rates for lower income groups are very close to the legal rates with small differences of at most 2-3 percentage points. But for the higher income groups the difference increases upto 20 percentage points, especially in 1983. In 1981 the legal rate was 66% at the top whereas the effective rate was only 47%. In 1986 the difference between legal and effective rates was 10%. This proves that in terms of effective rates the degree of progression of the tax structure is much lower than supposed to be. The tax payers with low income are usually wage earners and the tax on their income is taken directly before their wage is paid. But for higher income tax payers the government cannot collect the legal amount of tax on the declared level of income that easily.
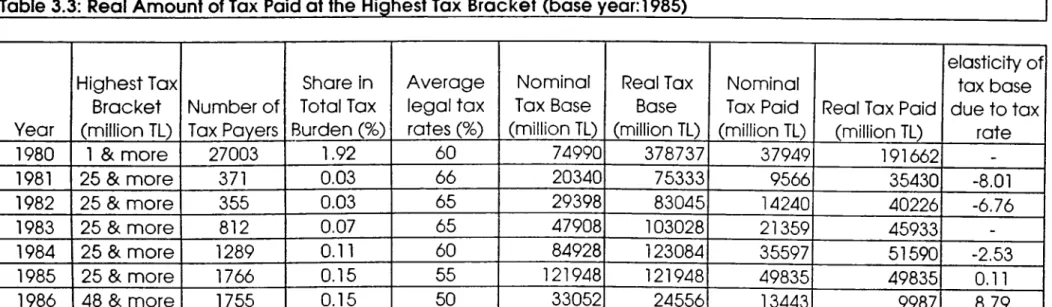
The change in the tax amount paid at the highest income bracket as the average tax rate decreases at the top is also an important issue. The data at hand allows for such an analysis of the labor responsiveness at the top bracket only for the period between 1980 and 1986. Table 3.3 shows the real mount of tax paid at the top bracket and the elasticity of tax base to average tax rate. The real amount of tax paid at the top decreases 440% in 1981 due to the increase in the tax rate and the elasticity was quite high - 8 in absolute terms. Thus the highest income individuals decreased either labor supply or declaration. Of course the reduction in tax base is not simply a result of increased tax rates. The ratio of percentage increase in tax liability to percentage decrease in tax rate is 6.7 in 1982. This shows a high level of responsiveness and also the real amount of tax collected at the top bracket increases by 13% although the average rate is lower. In 1984 the elasticity of tax base to tax rate decreases down to 2.5 where there is a reduction of 5% in average rate. The real amount of tax revenue still increases by 12% due the increase in tax base and in spite of the decrease in tax rate. Between 1981 and 1984 the labor response at the top satisfies the theorem about the optimal tax scheme saying that tax paid at the top level increases due to a reduction in the average tax rate. However the responsiveness of the highest income individual to tax rates decreases as we further decrease the average tax rate in 1985 by another 5%. Real tax base decreases in 1985 even though the rate decreases. This fiulher decreases the tax collected at the top due to the combined effect of lower tax rate and tax base. The situation is similar in 1986. The ratio of percentage decrease in tax base to the percentage decrease in tax base is 0.11 and 8.79 in 1985 and 1986 respectively. The tax revenue collected at the top decreases by 3% and 79% respectively in these years. It is also important to note that the degree of progression decreases for the higher income levels between 1981, 1985 and 1986. Thus, the tax scheme in 1985 makes the richer better off but increases
the level of tax collected from the rich as well. But the scheme in 1986 neither brings out an increase in degree of progression nor increases the tax revenue at the top. Thus, it is neither optimal nor progressive relative to the other years. This basically because the number of tax brackets decreases to 6 and the top marginal rate decreased to 50% in 1986, also the tax brackets were adjusted such that the tax base at the top bracket decreased.
Beginning with 1986 the number of tax brackets and the marginal tax rates for the brackets didn't change until 1994. The marginal tax rates increased at 5% at each bracket starting from 25% and reaching to 50% at the top bracket. The tax brackets doubled at each level. Between 1986 and 1993, only the income brackets were adjusted to catch up with the inflation rate, at least to some extent.
By the latest adjustments in 1994, the number of tax brackets again increased to 7. The width of the lowest bracket, which was taxed at 25% at the margin, increased. Thus, the 32 million TL limit for the lowest bracket increased by 134% to 75 million TL. The marginal tax rate for the top bracket also increased to 55%.
If we compare the income tax rates at the bottom and top brackets in OECD and EEC countries with Turkey, we observe a general tendency in those countries to lower the tax rate for the first bracket^'. But in Turkey the rate increased by 2.5% for the first bracket from 1963 to 1994.
On the other hand, it is a general tendency to decrease the marginal tax rates for the top bracket in OECD and EEC countries. But this doesn't cause a reduction in tax revenue in those countries whereas in Turkey the low rates at the top bracket decrease not only the level of tax equity but also the tax revenue of government^*. Our analysis also for 1985 and 1986 supports this result.
Another important effect that increases the tax burden on the lower income brackets is the bracket creep due to inflation. The tax brackets are relatively narrower at lower income levels and they get broader as income increases. Tax payers with lower income step upto higher brackets faster than those with higher income, especially because the width of the first income bracket does not increase as fast as inflation^^. Moreover, since the tax rates are constant above a certain level of income, the very high income levels don't carry any inflation tax burden at all.
3.2.6 The Change in the Degree o f Progression
In this part we will evaluate the degree of progression in Turkish income tax system from 1963 to the present. This discussion is not an answer to the
3’?ener, O. (1990), pp.66-68.
32ibid...
optimal tax scheme problem. In order to be able to answer such a problem, we first of all need data about the labor response functions which are quite hard to obtain in a country where there are many factors changing all together and effecting the level of labor supply. Also here we do not answer normative questions like, "What are the preferences of Turkish citizens about inequality in distribution of in come?" Rather, we will stand at another "normative" side to critisize how the degree of progression of income tax system changed and what are the opportunities for a more progressive tax system to increase equality in after tax distribution of income.
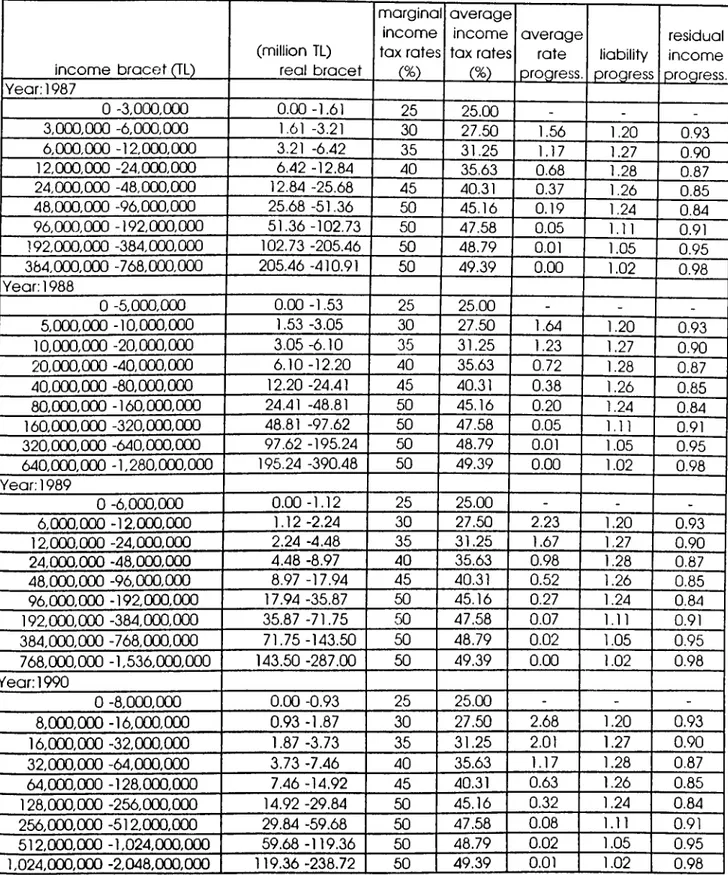
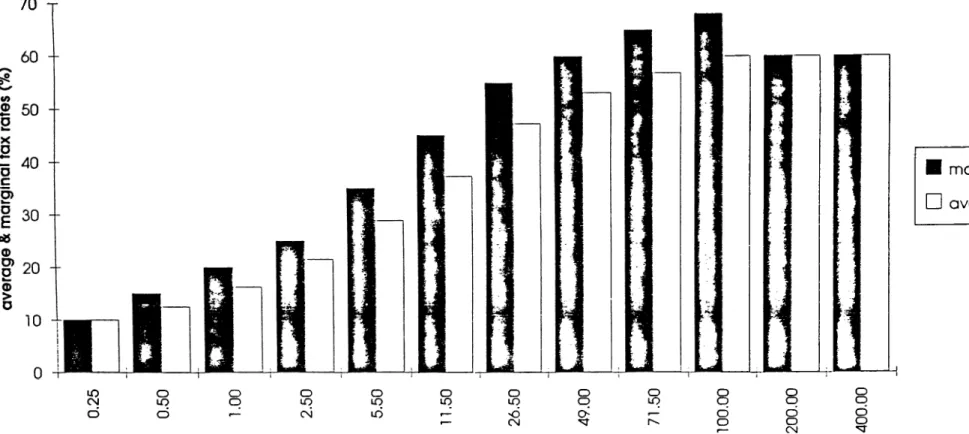
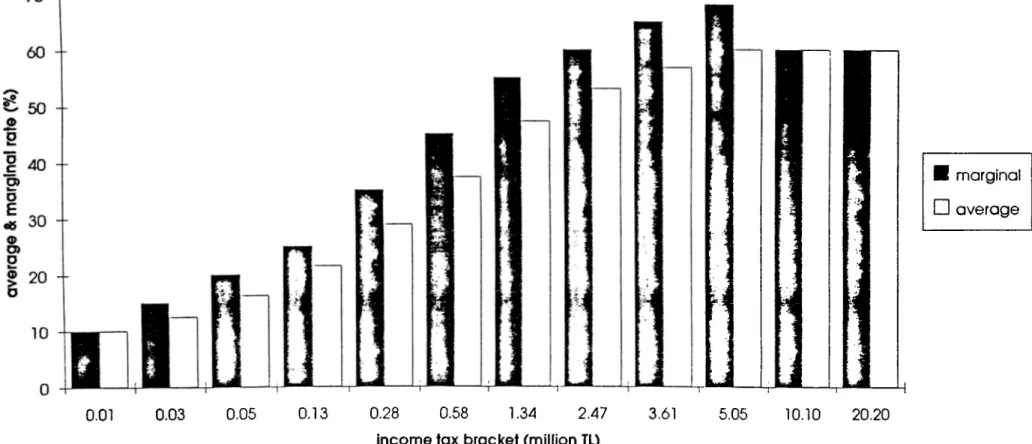
To apply the measures of the degree of progression on Turkish income tax structure through years, we have to calculate the real income brackets in order to free the analysis from the effects of fiscal illusion due to inflation^·*. Column 4 and 5 in Table 3.1 shows the real income brackets for years 1963 and 1980- 1993. Figures 3.1-3.15 illustrate the average and marginal tax rates with respect to real income tax brackets.
At a first glance, the average tax rates increase as we move up the income scale in all years (See Column 7 in Table 3.1). But this is just a very general evaluation of progression. The fall in the degree of progression is striking between 1963 and 1980 if we observe the income tax scale which is much lower in 1980 for each level of average tax rate (See Figiae 3.1 and 3.2). In 1981 the steepness of the ciuve decreases to a great e.xtent (See Figure 3.3). For a detailed analysis we need average rate, liability and residual income progression coefficients, which can be seen in columns 8 to 10 respectively in Table 3.1.
Average rate progression is effected from both the changes in real tax brackets, thus the inflation and the marginal tax scheme. Therefore it is a better sign to see how the degree of progression changes between years where marginal tax rates are constant and only the adjustments in real brackets are effective. We can also use this coefficient to see how the degree of progression changed through income brackets within the same year. In all years, generally average rate progression decreases as we move up the income scale. The coefficient reaches to zero where the average rate and the marginal rates converge. In real terms the level where the tax system became proportional was 100 million TL in 1963 and this decreased to 5 million in 1980. This level was 92 million in 1981 which was still lower than 1963. During 1981 and 1984 these figures are 141 and 144 respectively. In 1982 the reason for increased progression was the increased difference between average tax rates which were 39% and 65% for bottom and top brackets. Later the degree of progression decreased in 1983 due to the erosion in the fixed tax brackets through years. In 1984 there was a recovery in the degree of progression due to the increased
convert nominal income to real income we used the CPI in the IMF International Financial Statistics Year Book, 1993 where 1985 is the base year. Still, we have to point at the inadequacy of the CPI to account for different inflation rates for different income groups.
difference between bottom and top marginal tax rates which were 30% and 60% respectively. The shift to a proportional scheme starts above 100 million TL in 1985 which is a shift back to 1963. The adjustment in brackets in 1986 increased this figure upto 285 million TL. This figure declined continually until 1989 where the level was 143 million TL in real terms. This shows that the tax system couldn't catch up with increasing level of inflation. In 1990 there was another recovery, where the shift to proportional scheme started at a level above 240 million TL. Then until 1993, this figure again decreased continually down to 200 million TL. The changes between 1986 and 1993 are important because in this period marginal and average tax rates were constant and the differences in the degree of progression are only due to inflation.
When we observe the development of liability progression coefficient, we see that the degree of progression increases for the first few income brackets and then it decreases sharply as we move up the income scale. Thus, the high income individuals are taxed less progressively than individuals below middle income level. This is not a positive sign for progressivity.
Liability progression coefficient depends on the average tax rates and the nominal income level. So this measure is free of the effects of inflation. Therefore it is a measure of progression of tax liability due to changes in nominal income. According to this measure the degree of progression increased between 1981 and 1985 due to the change in tax rates in this period. Liability progression stayed constant after 1986 where the average tax rate scheme and the percentage increase of income tax brackets did not change through years.
Residual income progression is an important measure to point at the effect of tax system on the after tax distribution of income. The residual income progression coefficient also follows a similar path to liability progression. Thus the redistributive effects of the tax system first increase as we move up the brackets, then the difference between before and after tax income gets smaller after a certain level of income, thus the tax system becomes proportional.
Changes in brackets and rates after 1985 did not have any effect on residual income progression, thus the changes did not bring more equality in the redistributive sense. This result is also valid for liability progression.
It is also important to note that, between 1986 and 1993 the changes in the tax scales took place without any change in average tax rates. Since the brackets were not adopted completely with respect to inflation, real income levels corresponding to these constant rates gradually decreased each year. Thus the tax burden increased for each level of real income because of the lack of full adjustment to inflation. As we have already pointed at in Part 2, low income earners are effected more by this result.
It will be meaningful to compare the final point, where the residual income progression coefficient begins to increase for ever (thus, the point where residual income progression begins to decline). This corresponds to the point