THE EFFECTS OF COLOR ON APPROACH/AVOIDANCE
BEHAVIOR
!
!
A Master’s Thesis
!
by
İPEK ÖZMEN
!
!
!
!
!
!
Department of
Interior Architecture and Environmental Design
İhsan Doğramacı Bilkent University
Ankara
September 2014
To my wonderful parents; Ünal Özmen and Oya Özmen
!
& !!
my precious grandmother Emine AlpergunTHE EFFECTS OF COLOR ON APPROACH/AVOIDANCE BEHAVIOR
!
!
Graduate School of Economics and Social Sciences of
İhsan Doğramacı Bilkent University
!
by
!
İPEK ÖZMEN
!
In Partial Fulfillment of the Requirements for the Degree of MASTER OF FINE ARTS
!
in
!
THE DEPARTMENT OF INTERIOR ARCHITECTURE AND ENVIRONMENTAL DESIGN
İHSAN DOĞRAMACI BİLKENT UNİVERSITY ANKARA
!
!
September 2014!
!
!
I certify that I have read this thesis and have found it is fully adequate, in scope and in quality, as a thesis for the degree of Master of Fine Arts in Interior Architecture and Environmental Design.
!
!
---
Assoc. Prof. Dr. Nilgün Olguntürk Supervisor
!
I certify that I have read this thesis and have found it is fully adequate, in scope and in quality, as a thesis for the degree of Master of Fine Arts in Interior Architecture and Environmental Design.
!
!
--- Prof. Dr. Halime Demirkan Examining Committee Member
!
I certify that I have read this thesis and have found it is fully adequate, in scope and in quality, as a thesis for the degree of Master of Fine Arts in Interior Architecture and Environmental Design.
!
!
---
Assist. Prof. Dr. Güler Ufuk Demirbaş Examining Committee Member
!
Approval of the Graduate School of Economics and Social Sciences
!
!
--- Prof. Dr. Erdal Erel Director
ABSTRACT
!
THE INFLUENCE OF COLOR ON APPROACH AND AVOIDANCE BEHAVIOR
!
Özmen, İpek
MFA, Department of Interior Architecture and Environmental Design Supervisor: Assoc. Prof. Dr. Nilgün Olguntürk
!
September 2014
The aim of this study is to analyze the influence of color on approach avoidance behavior. For a better understanding of approach avoidance behavior both the hue of color and the location of color are studied. The experiment is conducted with six different sample groups and three different color settings which are gray, red and green. Under the three main color settings there were two sub settings as when the color is on the right and when the color is on the left. All the atmospheric properties other than color were kept same. University laboratory was turned into an environment where four identical stands that worked as displays for the items placed on them, a mirror and a seating unit was placed. The items exhibited were all women sports outwear of similar design and color. The
participants were 108 students from Bilkent University. Each participant was taken in individually and asked to experience the space freely. Each participant was
evaluated in terms of the total amount of time spent in the environment, number of items touched, time spent for investigating items, time spent for browsing items, number of items tried and their orientation patterns in the environment. All the constructs listed above were derived from the Mehrabian-Russell Stimulus
Response Model. It was induced that the hue of the color does not have a significant influence on approach/avoidance behavior. However, the location of color in the environment has a strong influence on the orientation patterns of individuals and therefore associative with approach and avoidance behavior. It was observed that, people tend to go towards the differently colored part of the room.
!
Keywords: Approach/Avoidance Behavior, Color, Mehrabian-Russell Environmental Psychology Model
!
!
ÖZET
!
RENGİN YAKLAŞMA VE KAÇINMA DAVRANIŞLARI ÜZERİNDEKİ ETKİSİ
!
Özmen, İpek
İç Mimarlık ve Çevre Tasarımı Yüksek Lisans Programı Danışman: Doç. Dr. Nilgün Olguntürk
!
Eylül 2014!
Bu çalışmanın amacı, rengin insanların yaklaşma ve kaçınma davranışları üzerindeki etkisini incelemektir. Yaklaşma ve kaçınma davranışlarının daha iyi anlaşılabilmesi amacıyla rengin hem nüans öelliği hem de çevredeki konumu çalışılmıştır. Deney, altı farklı denek grubu ile üç farklı renk düzenlemesinde yağılmıştır. Bu üç farklı renk, gri, kırmızı ve yeşil olarak belirlenmiştir. Her rengin altında iki farklı konum düzenlemesi olup renk önce odanın sağ sonra sol tarafına yerleştirilmiştir. Rengin nüansı ve konumu haricindeki tüm atmosferik özellikler sabit tutulmuştur. Üniversite’nin çevre laboratuarı içeride dört adet özdeş masa, bir adet ayna ve bir adat oturma ünitesi bulunacak şekilde yeniden düzenlenmiştir. Bu dört adet özdeş masa içeride sergilenecek olan öğelerin teşhiri için yerleştirilmiştir. İçeride sergilnen öğelerin tamamı benzer renk ve tasarımları olan spor kadın dış giyim ürünleridir. Deneyde yer alan katılımcıların tamamı Bilkent Üniversitesi öğrencileridir ve toplamda 108 kişi deneye katılmıştır. Tüm katılımcılar içeriye teker teker alınmış ve odayı istedikleri şekilde deneyimlemeleri rica edilmiştir.
Katılımcıların davranışları içeride geçirdikleri toplam süre, dokundukları öğe sayısı, öğeleri incelemek için geçirdikleri süre, denedikleri öğe sayısı, öğeler arasında geçirdikleri süre ve içerideki yönelim biçimleri çerçevesinde değerlendirilmiştir. Bahsedilen davranışların tümü Mehrabian-Russell modelinden yola çıkarak
belirlenmiştir. Yapılan deneyin sonucunda, rengin nüansının yukarıdaki davranışların hiçbiri üzerinde dikkate değer bir etkisi olmadığı gözlenmiştir. Buna rağmen, rengin çevredeki konumunun yönelim biçimleri üzerinde etkisi olduğu ve dolayısıyla yaklaşım ve kaçınma davranışlarıyla da alakalı olduğu gözlenmiştir. İnsanların, bir çevrede farklı şekilde renklendirlmiş bölümlere yöneldiği gözlenmiştir.
!
Anahtar Kelimeler: Yaklaşım/Kaçınma Davranışı, Renk, Mehrabian Russell Çevresel Psikoloji Modeli
ACKNOWLEDGEMENTS
!
!
Firstly, i would like state that i am very thankful to my supervisor Assoc. Prof. Dr. Nilgün Olguntürk for her invaluable support and endless patience. Her
knowledge and her experience was helpful in this process beyond expression. It has been a pleasure and great practice for me and i feel very lucky to be able to work with her.
!
Secondly, I would like to thank my jury members Prof. Dr. Halime Demirkan and Assist. Prof. Dr. Güler Ufuk Demirbaş for their participation and their constructive feedbacks for this work to be progressed.
!
I would also like to thank Gözde Koral, for her great support through my study and her contribution to my thesis by helping me out with the anything possible when I was in need. Without her support, it would be much harder to go through this process.
!
I would also like to thank all my friends and my classmates from my master education for their invaluable support and great patience.
!
Lastly, I am grateful to my family beyond expression for their invaluable support, their great tolerance and their endless patience through my master education and particularly my thesis process. This thesis wouldn’t be where it is without their contribution.
TABLE OF CONTENTS
!
!
!
ABSTRACT ………..iii ÖZET ………..iv ACKNOWLEDGEMENTS ………vTABLE OF CONTENTS ………..vi
LIST OF TABLES ……….ix
LIST OF FIGURES ……….xv
CHAPTER 1: INTRODUCTION ……….1
1.1. Aim of the Study ………4
1.2. Structure of the Thesis ……….5
CHAPTER 2: BEHAVIORAL ANALYSIS OF THE CONSUMER……….8
2.1. Mehrabian-Russell Stimulus Response Model ………..15
2.1.1. Working Principle of the M-R Model ……….16
2.1.1.1. Stimulus Taxonomy ………..17
2.1.1.2. Response Taxonomy ………..19
2.1.2. Pleasure, Arousal, Dominance (PAD) Scale …………..20
2.1.3. Individual Features Influencing the Functioning of M-R Model ………24
CHAPTER 3: STORE ATMOSPHERICS ………..33
3.1. Definitions and Approaches ………..33
3.2. Influence of Color on Consumer Behavior and Requirements for Retail Settings ………43
CHAPTER 4: THE EXPERIMENT ………..53
4.1. Aim of the Study ………..53
4.2. Hypothesis ………..53
4.3. Method of the Study ………..55
4.3.1. Sample Group ……….55
4.3.2. Experiment Room ………56
4.3.3. Procedure ……….65
4.3.3.1. Lighting Scheme and Color Alterations ………65
4.3.3.2. Planning of the Experiment ………68
4.3.3.3. Phases of the Experiment ………..70
4.4. Findings ………71
4.4.1. Effects of Color on Approach/Avoidance Behavior ……72
4.4.1.1. Total Amount of Time Spent ………72
4.4.1.2. Number of Items Touched ………..79
4.4.1.3. Time Spent for Investigating Items ………87
4.4.1.4. Time Spent for Browsing Items ………..95
4.4.1.5. Number of Task Performances Undertaken ……….102
!
CHAPTER 5: DISCUSSION ………..121
CHAPTER 6: CONCLUSION ……….129
6.1. Limitations of the Study ………..132
6.2. Recommendations for Future Research ………..133
REFERENCES ……….135 APPENDICES ………..143 APPENDIX A ……….144 APPENDIX B ………145 APPENDIX C ………146 APPENDIX D ………147
!
!
!
!
!
!
!
!
!
!
LIST OF TABLES
!
!
!
TABLE 1. The four basic responses of a consumer in a store in the case of
approach and avoidance ………..20
!
TABLE 2. Categorization of store atmospherics ………..40
!
TABLE 3. Color psychology and color therapy ……….48
!
TABLE 4. Chart showing the connotations of warm and cool colors ……….50
!
TABLE 5. Luminance levels of the wall and stand surfaces when the color
alteration is on the right side ………..67
!
TABLE 6. Luminance levels of the wall and stand surfaces when the color
alteration is on the left side ……….67
!
TABLE 7. T-test results showing the comparison of right and left hand side
locations of the gray setting in terms of total time spent …………73
!
TABLE 8. T-test results showing the comparison of right and left hand side
locations of the red setting in terms of total time spent …….……74
!
TABLE 9. T-test results showing the comparison of right and left hand side
locations of the green setting in terms of total time spent ……….75
!
TABLE 10. T test results showing the comparison of gray setting and red
setting in terms of total amount of time spent ………76
!
TABLE 11. T test results showing the comparison of gray setting and green
setting in terms of total amount of time spent ………77
!
TABLE 12. T test results showing the comparison of red setting and green
setting in terms of total amount of time spent ………78
!
TABLE 13. Cross tabulation showing the comparison of red setting and
green setting in terms of total amount of time spent ……….79
TABLE 14. Chi-square test of independence results showing the comparison
of red setting and green setting in terms of total amount of time spent ……….…….79
!
TABLE 15. T test results showing the comparison of right and left hand side
locations of the gray setting in terms of number of items
touched ……….80
!
TABLE 16. Cross tabulation showing the comparison of right and left hand
side locations of gray setting in terms of number of items
touched ……….81
!
TABLE 17. Chi-square test of independence results showing the
comparison of right and left hand side locations of gray setting in terms of number of items touched ………82
!
TABLE 18. T test results showing the comparison of right and left hand side
locations of the red setting in terms of number of items
touched ………..……..83
!
TABLE 19. T test results showing the comparison of right and left hand side
locations of the green setting in terms of number of items
touched ……….84
!
TABLE 20. Table 20. T test results showing the comparison of gray setting
with the red setting in terms of number of items touched ……….85
!
TABLE 21. T test results showing the comparison of gray setting with the
green setting in terms of number of items touched ………..86
!
TABLE 22. T test results showing the comparison of red setting with the
green setting in terms of number of items touched ………..87
!
TABLE 23. T test results showing the comparison of right and left hand side
locations of the gray setting in terms of time spent for investigating items ………..88
!
TABLE 24. Cross tabulation showing the comparison of right and left hand
side locations of the gray setting in terms of time spent for
investigating items ………..89
!
TABLE 25. Chi Square test of independence results showing the
comparison of right and left hand side locations of the gray setting in terms of time spent for investigating items ……….90
TABLE 26. T test results showing the comparison of right and left hand
side locations of the red setting in terms of time spent for investigating items ………..91
!
TABLE 27. T test results showing the comparison of right and left hand side
locations of the green setting in terms of time spent for
investigating items ………..92
!
TABLE 28. T test results showing the comparison of gray setting and red
setting in terms of time spent for investigating items ………93
!
TABLE 29. T test results showing the comparison of gray setting and red
setting in terms of time spent for investigating items ………94
!
TABLE 30. T test results showing the comparison of red setting and green
setting in terms of time spent for investigating items ………95
!
TABLE 31. T test results showing the comparison of right and left hand side
locations of the gray setting in terms of time spent for browsing
items ………..96
!
TABLE 32. T test results showing the comparison of right and left hand side
locations of the red setting in terms of time spent for browsing
items ………..97
!
TABLE 33. T test results showing the comparison of right and left hand side
locations of the green setting in terms of time spent for browsing
items ………..98
!
TABLE 34. T test results showing the comparison of gray and red settings in
terms of time spent for browsing items ………..100
!
TABLE 35. T test results showing the comparison of gray and green settings
in terms of time spent for browsing items ………..101
!
TABLE 36. T test results showing the comparison of red and green settings
in terms of time spent for browsing items ………..102
!
TABLE 37. Table 37. T test results showing the comparison of right and left
hand side locations of the gray setting in terms of task
performance ………..…104
!
!
TABLE 38. T test results showing the comparison of right and left hand
side locations of the red setting in terms of task
performance ………..105
!
TABLE 39. T test results showing the comparison of right and left hand side
locations of the green setting in terms of task performance …..106
!
TABLE 40. T test results showing the comparison of gray and red color
settings in terms of task performance ………107
!
TABLE 41. T test results showing the comparison of gray and green color
settings in terms of task performance ………108
!
TABLE 42. T test results showing the comparison of red and green color
settings in terms of task performance ………109
!
TABLE 43. T test results showing the comparison of right and left hand side
locations of the gray setting in terms of direction patterns ……..110
!
TABLE 44. Cross tabulation showing the comparison of right and left hand
side locations of the gray setting in terms of direction
patterns ………111
!
TABLE 45. Chi-square test results showing the comparison of right and left
hand side locations of the gray setting in terms of direction
patterns ………112
!
TABLE 46. T test results showing the comparison of right and left hand side
locations of the red setting in terms of direction patterns ………113
!
TABLE 47. Cross tabulation showing the comparison of right and left hand
side locations of the red setting in terms of direction
patterns ………114
!
TABLE 48. Chi-square test results showing the comparison of right and left
hand side locations of the red setting in terms of direction
patterns ………114
!
TABLE 49. T test results showing the comparison of right and left hand side
locations of the green setting in terms of direction patterns …..115
!
TABLE 50. Cross tabulation showing the comparison of right and left hand
side locations of the green setting in terms of direction
patterns ………116
TABLE 51. Chi-square test results showing the comparison of right and left
hand side locations of the green setting in terms of direction
patterns ………116
!
TABLE 52. T test results showing the comparison of gray setting and red
setting for both locations in terms of direction patterns ………..118
!
TABLE 53. T test results showing the comparison of gray setting and green
setting for both locations in terms of direction patterns ………..119
!
TABLE 54. T test results showing the comparison of red setting and green
setting for both locations in terms of direction patterns ………..120
!
!
!
!
!
!
!
!
!
!
!
!
!
!
!
!
!
!
!
!
!
!
LIST OF FIGURES
!
!
!
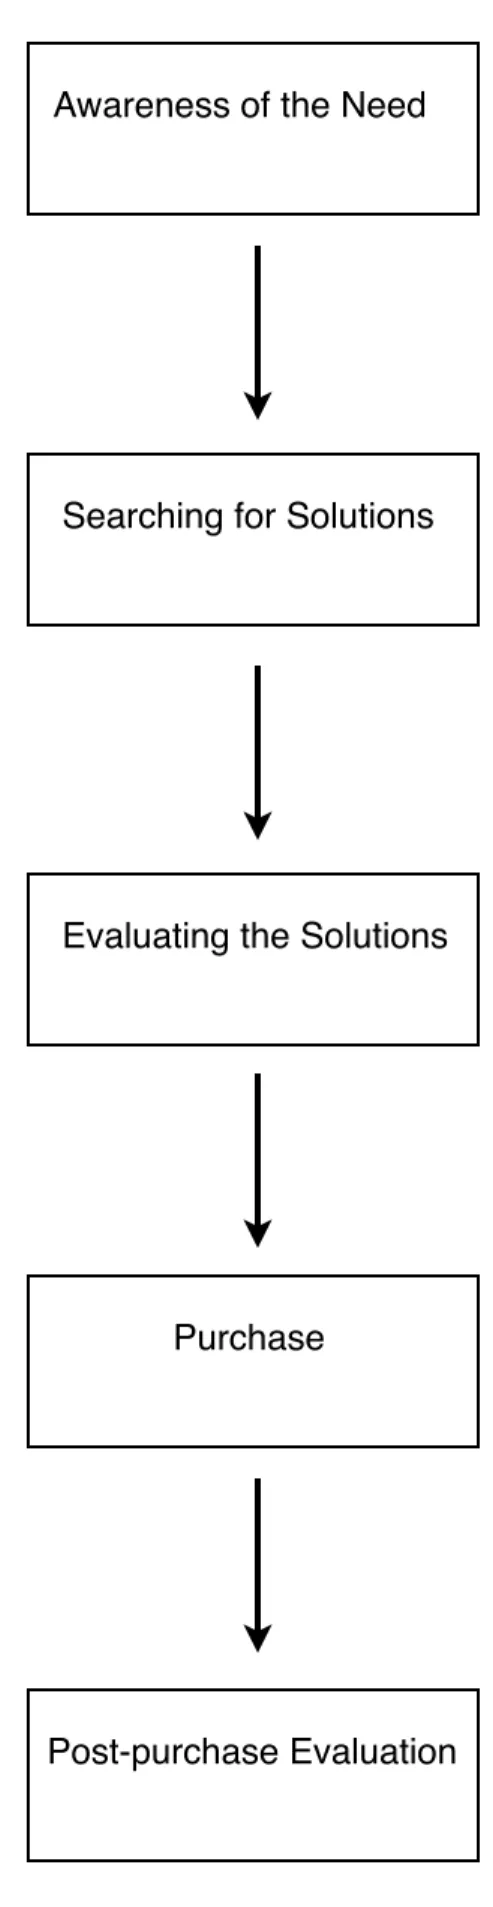
FIGURE 1. The model proposed by Engel and Blacwell on decision making
process of the planned consumer ……….………11
!
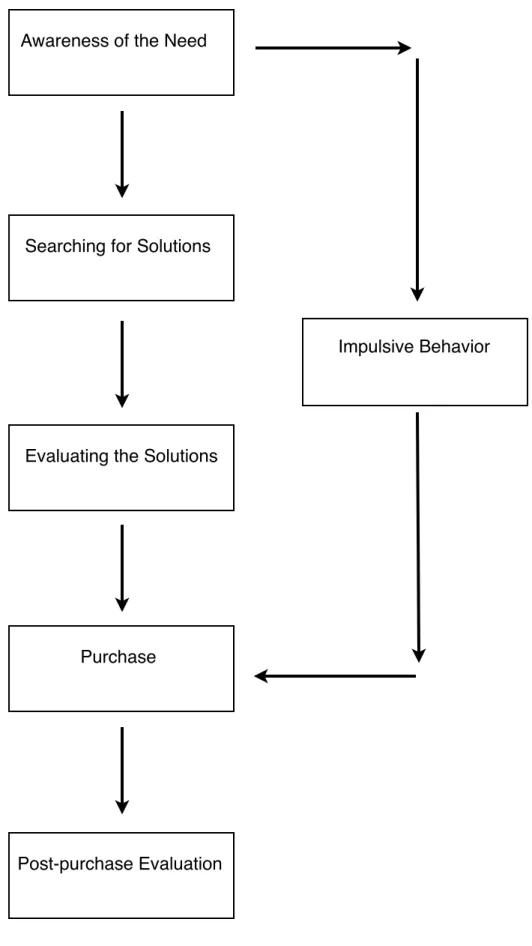
FIGURE 2. The adjusted model proposed by Coley on decision making
process of the impulsive consumer ………..13
!
FIGURE 3. Chart showing the working principle of M-R model ………..17
!
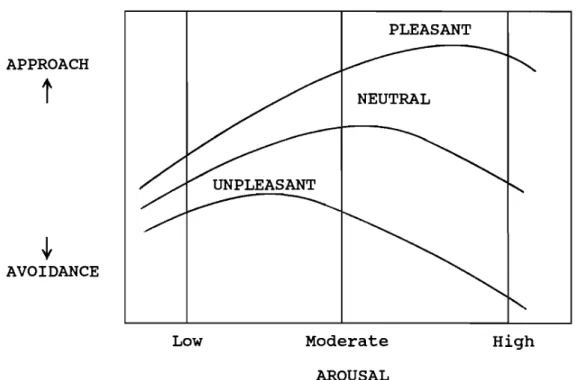
FIGURE 4. Graph showing the relationship between pleasure, arousal and
approach/avoidance behavior ……….………..23
!
FIGURE 5. Adjusted model that shows the working principle of S-O-R
paradigm in this study ……….………30
!
FIGURE 6. The final form of the model as it will be used particularly for this
study ……….……….31
!
FIGURE 7. The relationship between user-environment in service !!
! organizations ………..………..37!
!
FIGURE 8. Categorization of store atmospherics ………..…….………..41!
!
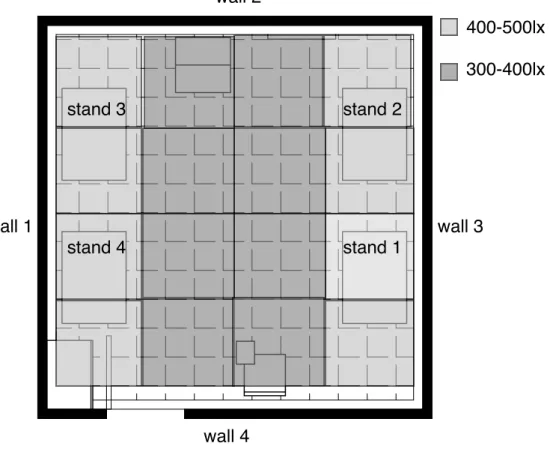
FIGURE 9. Plan of the room showing the placing of the units ………57!
!
FIGURE 10. Wall washing installation dimensions ………..…57
!
FIGURE 11. NCS illustration of red setting …………..……….…..…..59
!
FIGURE 12. NCS illustration of green setting .………..…60
!
FIGURE 13. NCS illustration of gray setting ……….60
!
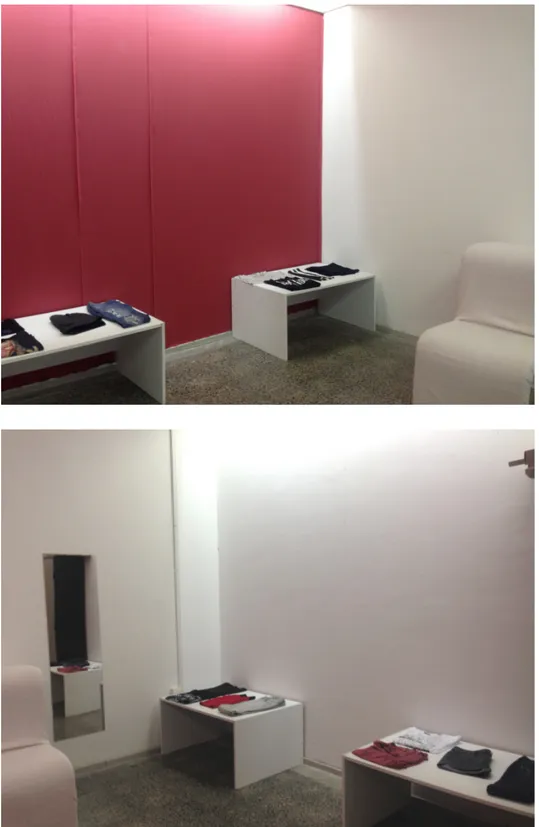
FIGURE 14a. The visuals of the room showing the gray color setting ..……62
!
FIGURE 14b. The visuals of the room showing the wall across the gray color
setting ………..……….…….62
!
FIGURE 15a. The visuals of the room showing the green color setting ……63
!
FIGURE 15b. The visuals of the room showing the wall across the green
color setting ……….………….………..…………..63
!
FIGURE 16a. The visuals of the room showing the red color setting ..……..64
!
FIGURE 16b. The visuals of the room showing the wall across the red color
setting ………..……….……….64
!
FIGURE 17 The lighting scheme of the room from eye level under wall
washers ………66
!
!
!
!
!
!
!
!
!
!
!
!
!
!
!
!
!
!
!
CHAPTER 1
!
!
INTRODUCTION
!
!
!
Shopping, beyond question, is one of the earliest activities of human kind. It
might have taken many different shapes through the history of civilization but
substantially the concept stays the same. In the primordial times, before the
invention of money, what is meant by shopping is barter where people used
to turn in an equal worth of something else in exchange of a need. Later on,
everyone started to turn in a common merit in exchange of what is required,
which goes by the name of money (Humphrey, 1985; O’Sullivan and ,
Sheffrin, 2003).
!
As primitive as the history of shopping, manufacturers, suppliers, designers,
pretty much everyone in the industry are in a great race of attracting the
customer. With the urge of the mass production, this race has grown major
and has taken different shapes. Creativity and brand insight has become to
be an important matter of concern in this race, as people’s brand choices
patronage and brand loyalty (Lichtenstein, Ridgway and Netemeyer, 1993;
Baker, Grewal and Parasuraman, 1994; Baker, Grewal, Parasuraman and
Voss, 2002).
!
Product design, by all means, is probably the most important reason for
choosing a brand among the others. However, what is more visible to
everyone before the product itself is how that product is exhibited. In the
current system, the main exhibition area for the product is the store
environment. However, especially the background, shelf or stand is the
immediate and more specific surrounding for the product. Once the customer
is drawn to that specific environment, (s)he receives information about the
product(s) placed in the environment and focus is shifted from the
environment to the product itself. However, before that immediate
surrounding of the product, the consumer should first be drawn to the store,
which is the main environment.
!
Other than the product design itself, there are many different ways to draw
the attention to the store. Advertisements, glass case design, music, odor,
layout, color, lighting design, staff consumer relationships and many other
factors are all influential on giving a reason to the consumer to choose a
particular brand among others (Berman and Evans, 1979; Turley and
Milliman, 2000). The above listed elements of a store are known to be
influential on consumer behavior. What is meant by consumer behavior is;
the process and activities people engage in when searching for, selecting,
to satisfy their needs and desires” (Belch and Belch, 2007). Based on all the
information above, this study has chosen to investigate the influence of color
design on consumer behavior. It is hypothesized that by the help of color
design, it is possible to draw the attention of the consumer to an intended
part of the store. Surely, this hypothesis is valid either for the whole store or a
specific part of the store where a particular product is exhibited.
!
The main restriction of this study is not being able to work in a real store
setting but in a laboratory where a prototypic store environment might be
simulated and where people could walk through and investigate the
merchandise like they do in a real store setting. As a solution for this, it is
avoided to make people perceive the setting as it is a real store but more
they are only asked to investigate the merchandise inside as the feeling of
shopping is almost impossible to simulate. Another restriction is that, as the
whole theory of the study depend on consumer behavior, the attendants of
experiment should be observed by the researcher which might cause the
attendants to feel nervous and change their natural behavior. Therefore, it is
avoided to contact the attendants as much as possible unless they ask a
question and all the information is given before they entered the setting so
that the observer is no different than an ordinary staff in a real store.
!
!
!
!
1.1 Aim of the Study
!
This study is broadly about understanding consumer behavior in relation to
store design. Consumer behavior is generally reviewed as the target
consumer’s mediating behavior displayed in between entering the shop and
buying a merchandise (Billings, 1990). What is meant by mediating behavior
in this study is whether consumers can be attracted to a specific part of the
store, induced to spend more time in the store and to investigate more items
closely in the store. A particular real life store setting is not used, however the
study mostly focuses on women outwear items which displayed in the
university laboratory .
!
Among many store design and ambient elements that might be influential on
consumer behavior like; store layout, odor, music, temperature etc.; color
scheme is chosen to be investigated over consumer behavior. In other words
whether consumers can be manipulated to approach a specific part of the
store, to spend more time in the store, to investigate the store in general and
some items particularly by the help of color scheme of the store.
!
This study uses Mehrabian - Russell (MR) (1974) stimulus response model
as an arbiter for the particular consumer behavior to be investigated in the
research. The mediating behavior mentioned above are all derived from the
Mehrabian - Russell (1974) theory and are used as the central constructs of
behavior, environmental psychology and building science under the same
roof. Per contra, by not working on a specific store setting, this study aims to
make everything procured in this research to be a useful information and
beacon for further studies and marketing strategies of many stores in several
industries.
!
!
1.2. Structure of the Thesis
!
Research made on the topic practices upon many different disciplines such
as environmental psychology, consumer behavior, marketing strategy and
building science. For this reason, information gathered to build up the central
constructs of this study are a combination of the disciplines listed above. In
order to be able to analyze each topic particularly each discipline and the
interdisciplinary relationships are examined separately in seven different
chapters.
!
The first chapter is the introduction part. In this part, what is meant by
mediating consumer behavior, Mehrabian - Russell (1974) model and store
atmospherics are briefly explained. In addition to these, the aim and the
scope of the study and also the structure of the thesis are also covered.
!
Second chapter is the behavioral analysis of the consumer over the
Mehrabian-Russell stimulus response model. In this part, mostly the working
chapter include the dimensional structure of the model which is the Pleasure
- Arousal - Dominance (PAD) scale, application of the model which is
Stimulus - Organism - Response (SOR) theory and the individual differences
that might be influential on the working principle of the model areexplained.
PAD scale is a model that is developed to measure the emotional states
where pleasure, arousal and dominance are the main dimensions. SOR
theory is the main working principle of the MR model where the PAD scale
refers to process that determines the final response of the organism. In this
chapter the relationship between the structure and application of the model
and how this relationship can be applicable to this research will also be
analyzed (Mehrabian and Russell, 1974).
!
Third chapter is the definition of store atmospherics. Store atmospherics
include all the tangible and intangible elements in the store that manipulate
the behavior of the customers. As it is mentioned before there are many
elements of store atmospherics including major subdivisions such as store
ambient factor, store design factor and store social factor. These three main
subdivisions include several other subdivisions. Store ambient factor, for
instance includes many elements such as odor, temperature, music, lighting
and texture. Similar to this, store design and store social factors also have
several different elements. In this chapter, lighting as a store ambient factor
and color as a store design factor areanalyzed along with their relationship
and how they work in the store setting.
In chapter four, the experiment is explained including the aim of the study,
research question and the hypothesis of the research. In this chapter the
methodology is also covered explaining the experiment setting, data
gathering and sampling methods and the procedure of the experiment. After
the experimentation procedure is explained, the results induced from the
study areanalyzed. Statistical analysis and statistical results areincluded in
this part as well.
!
In chapter five the findings represented in the previous chapter arediscussed.
More qualitative, solid and valid results derived from the quantitative and
abstract statistical data arepresented in this chapter.
!
In chapter six the conclusion derived from combining the information
gathered from the literature and results gathered from the experiment
areexplained. In this chapter the limitations of the study along with the
suggestions for improving the study and the study’s contribution to the
current literature will also be discussed.
!
!
!
!
!
!
!
!
!
!
CHAPTER 2
!
!
BEHAVIORAL ANALYSIS OF THE CONSUMER
!
!
!
People buy. Almost everyone gets involved in a buying activity several times,
all through their lives. When it is named shopping, as used in daily life, most
of us perceive it as an arbitrary activity. However, when it is named buying,
the necessitative aspect of it comes to light. It is not completely wrong that
buying is an arbitrary activity yet it would be deficient to say that it is only an
arbitrary one. It is highly necessitative. For this reason, the hypercorrect point
of view would be defining shopping as a need that has an arbitrary aspect.
!
At this point, it would be accurate to analyze the shopping activity from the
two different aspects mentioned above; the necessitative one and the
arbitrary one. No matter which one, shopping activity that takes place in a
retail setting, is induced by the awareness of an unsatisfied need (Bohl,
2012). This need should not always be thought of as some item. This need
might range from running out of milk to simple urge to shop. Engel and
scenes of consumption decision (see Figure 1). Resolving their model, they
have proposed that there are five stages of information processing before
someone decides to purchase something. The first stage, known as the
problem recognition, is where the awareness of a so called need or problem
commences. The next and the second stage, named as searching, is where
the subject starts looking for several alternative solutions for the problem/
need recognized in the first stage. In the third stage, named as evaluation, is
where the subject starts evaluating the several alternative solutions to come
up with the best possible solution for the problem. It’s not until the fourth
stage the subject decides on which alternative will set the best solution for
the problem and purchase anything. Therefore, this stage is called the
purchase stage. In this fourth stage, subject makes up his/her mind and
purchases the item that fits best as a solution to the problem/need. The
purchase process might seem to be complete at this point yet it is not. The
subject, or in other words the consumer after this point, goes into a
post-purchase period where the given decision is re-evaluated depending on the
yields of the product in the utilization phase (Engel and Blackwell, 1982). This
model can be thought of as the shopping chain of a utilitarian shopper, which
in other words is referred to as planned shopping behavior chain where
cognition wins over emotions. In other words, if self control can predominate
over impulsivity then the subject might be able to think consciously and in a
restrained manner to review the options and making a decision among them
to go for the most suitable one (Coley, 2002). However, most of the time self
control might not be able to predominate over impulsivity. Ninety percent of
so that the purchase occasionally happens on impulse (Welles, 1986). As
Coley also proposes, when impulsivity (emotion) is stronger than the self
control (cognition), the two stages (stage 2 and 3) are bypassed by the
emotional process that happens right after the problem recognition stage
(stage 1) (see Figure 2). Therefore, it would be possible to replace stage 2
and 3 with a single stage of emotional response in an adjusted model. In
other words, analogically, it would be possible to replace the cognitive
process of the subject with his/her emotional process (Coley, 2002).
!
!
!
!
!
!
!
!
!
!
!
!
!
!
!
!
!
!
!
!
!
!
!
!
!
!
!
!
!
!
!
!
!
!
!
!
!
!
!
!
!
Figure 1. The model proposed by Engel and Blacwell (1982) on decision making process of the planned consumer
Awareness of the Need
Searching for Solutions
Evaluating the Solutions
Purchase
Until this point it is possible to see that, there are two main ways of
purchasing an item. The first one is the planned purchase which is a
cognitive process that does not include any emotionally given decision or any
uncontrolled desire/urge to buy something. The subject of the purchase is
usually a product oriented utilitarian shopper who is not easily susceptible by
external stimuli (Dawson, Bloch and Ridgway, 1990; Babin, Darden and
Griffin, 1995). A planned purchase, for instance, might start with realizing
that there is no bread left at home so that the subject goes to the grocery
store and directly travels to the bread aisle. At the aisle he/she will face with
several types of bread with several different properties such as taste, color,
smell, calorie value and price. After encountering alternative solutions, the
subject would probably decide on a single type of bread considering the
different properties and find the most suitable one. Then the subject would
travel back to the cash point, purchase the bread and cap off the shopping.
!
On the other hand, if the subject have stopped by any other item or shelf on
the way to the bread aisle or back and if that item is purchased among with
the bread afterwards, this would be an unplanned purchase that stroke the
subject instantaneously in the store. In other words this purchase can be
categorized as impulse purchase. The subject of this type of purchase is
usually a hedonic person who is more easily susceptible by external stimuli
that urges him/her to buy (Babin et al., 1995).
!
!
!
!
!
!
!
!
!
!
!
!
!
!
!
!
!
!
!
!
!
!
!
!
!
!
!
!
Figure 2. The adjusted model proposed by Coley (2002) on decision making process of the impulsive consumer
Awareness of the Need
Searching for Solutions
Evaluating the Solutions
Purchase
Post-purchase Evaluation
There might be several ways of impulse buying. This scenario might be valid
for someone who goes to shopping with a specific item in mind yet
purchases something unplanned as well as it is valid for someone who goes
to shopping with nothing in mind but purchases something not planned
before. Both cases would be counted as impulse buying. Stern (1962) has
proposed a classification for this different ways of impulse buying. He asserts
four main classes; pure impulse buying, reminder impulse buying, suggestion
impulse buying and planned impulse buying. Pure impulse buying is the real
impulse buying which is done only for a change or a break away that causes
from an emotional urge to buy and which breaks the normal buying pattern of
the subject. Reminder impulse buying is recalling of a need when facing the
item randomly while shopping for something else. For example, while
shopping for milk, buying cereals because milk reminded you of cereals
which is lacking at home for a while or just encountering the cereals stand
and recalling that there aren’t any cereals left at home. Suggested impulse
buying occurs when the subject encounters a product that is totally unfamiliar
with and that he/she doesn’t have any knowledge in advance so that the urge
to buy comes out of the novelty. The impulse purchaser encounters the
product and evaluates it while completing the sale at the point of purchase.
Finally, the planned impulse purchase occurs when the subject is determined
for a purchase when entering the store yet the decision is given upon the
special offers, sales and similar offers. No matter for which of the above
reasons, impulse purchase in general is an emotional response to the
in-store stimuli, that motivates the purchaser to buy something that is not
Until this point, it is certain that the purchaser enters the store either with the
idea of a purchase in mind or totally randomly without even planning to
purchase something. After this first step, purchaser encounters an in-store
stimuli and he/she gives a response to what has been encountered. If the
emotions (impulsivity) win over cognition (self control), the stimuli takes a
positive feedback and the item is most likely to be purchased if anything does
not interrupt with the emotional process (Tai and Fung, 2011). Herein,
everything besides the emotional process that happens in the consumer, is
clear. Therefore, the emotional process of the consumer should be resolved
henceforth.
!
!
2.1. Mehrabian - Russell Stimulus Response Model
!
The two environmental psychologists Albert Mehrabian and James Russell
(1974) have came up with a stimulus response model. What Mehrabian -
Russell (M-R) model proposed is; focusing on the emotional impact that is
created on an individual (the consumer) by the physical stimuli and the
tangible behavioral response caused by this impact might explain how the
environmental cues (store environment) influences the response (buying
probability of the consumer) of the individual (Mehrabian and Russell, 1974).
However, different than other environmental psychology models, this one has
been reviewed by both Albert Mehrabian (1980) and Russell and Pratt (1980)
separately afterwards, depending on the application of the model to store
model has been applied and approved several times in store environments.
Many studies that work on store atmospherics use M-R model to explain the
possible emotional responses of the consumer. As Kotler’s (1973) definition
also states store atmospherics should create environments that triggers
specific emotional impact in the consumer and this specific emotional impact
is majorly described by Mehrabian and Russell (1974) model.
!
!
2.1.1. Working Principle of the M-R Model
!
The main working principle of the model depends on a process that consists
of three elements. These three elements are; stimulus, organism and
response (S-O-R paradigm) (see Figure 3). Rather than elements these
three can be referred to as steps of the process as they work respectively. In
order to be fully knowledgeable about the S-O-R paradigm, the stimulus
taxonomy, the set of intervening mediating variables and the taxonomy of
possible responses should be analyzed extendedly (Mehrabian and Russell,
1974). In this chapter, the S-O-R paradigm areexplained in general yet the
organism dimension of the paradigm areexplained more exhaustively in the
following sections. In this section, the stimulus and response taxonomy
areanalyzed particularly.
!
!
!
!
!
!
Figure 3. Chart showing the working principle of M-R model (S-O-R paradigm) (Tai and Fung, 2011)
!
!
2.1.1.1. Stimulus Taxonomy
!
Firstly, we have the stimulus or the environmental stimuli (S), that triggers the
emotional response in the organism (O). Environmental stimuli exposure in a
store can be in several ways such as the displays, layout, atmosphere, sales
personnel, other customers, special offers, advertisement and many other
elements. Therefore, to reduce it to a simpler level Mehrabian and Russell
propose a general measure of store atmospherics which is the information
rate or the “load” of the environment that causes a certain level of emotional
response in the organism (consumer) (Mehrabian and Russell, 1974;
Mehrabian, 1976). Mehrabian (1976) defines load in two main dimensions;
novelty and complexity of the environment. Novelty is the level of familiarity
between the environment and the consumer and how predictable that
environment is to the consumer and complexity is the number of elements,
features and changes in the environment (Mehrabian, 1976). Combining
these two dimensions, a high load environment is novel, surprising, crowded Environmental Stimuli Emotional States Approach/ Avoidance
and should trigger stimulation in a person (Donovan and Rossiter, 1982).
Billings (1990: 6) state that;
The most common procedure is to describe an environment in terms
of various objects in it and the relations among these objects. For
example, a park may be described as a lake with trees, flowers, and
picnic tables around it. However, this list of descriptors could continue
forever; therefore, one list does not form a complete description of the
setting. In addition, the items are too vaguely defined.
!
For this reason, using the information theory proposed by Mehrabian and
Russell is acknowledged to be a more proper way to describe the level of
stimuli in the environment. As described by Mehrabian (1976) the
information rate in an environment is the amount of information perceived by
the subjects in the environment per unit time. This rate is shortly entitled as
“load” as it is mentioned above. Therefore, the higher the information rate in
an environment is, the higher the load of the environment is. In sum, as the
level of complexity and novelty increase the load of environment also
increase.
!
As assumed by Mehrabian and Russell (1974), environmental load is directly
related to arousal which is an emotional response. Therefore, arousal and
load are directly proportional which means that as load increases the arousal
level would also increase. In this case, a novel and complex environment
should make a person feel stimulated, jittery, excited, frenzied and aroused .
feel calm, relaxed and plodder (Donovan, Rossiter, Marcoolyn and Nesdale, 1994).
!
!
2.1.1.2. Response Taxonomy!
Mehrabian and Russell (1974) propose that an individuals’ response against
an environment can be categorized into two main behavior; approach
behavior and avoidance behavior. Therefore, no matter what the stimulus is
or what happens emotionally in the organism the response will either be
approaching the environment or avoiding it.
!
There are four main indicators of approach/avoidance behavior. These four
indicators are; the individual might tend to spend more time in the store
(approach) or leave the store (avoid), an individual might tend to browse
through the items in the store (approach) or might remain vapid (avoid), an
individual might tend to interact with other customers or sales personnel
(approach) or might tend to stay isolated (avoid), an individual might tend to
undertake task performances (approach) or spare undertaking task
performances (avoid) (Mehrabian and Russell, 1974). Later on, Donovan and
Rossiter (1982), adjusted this model and applied it to store environment.
They proposed that, if an individual approaches a store, he/she will stay
longer in the store, explore the merchandise closely, communicate with other
customers and the sales personnel and tend to try the merchandise (see
Table 1. The four basic responses of a consumer in a store in the case of approach/avoidance (Donovan and Rossitter, 1982)
!
!
Depending on the model explained above, this study also takes these four
basic responses (physical, exploratory, communicative, performative) as
indicators of approach/avoidance behavior to measure the influence of the
three different color schemes (the stimuli). However, as all participants of the
study are allowed to enter the room one by one and as there aren’t any sales
personnel in the room the communicative response is excluded and is not
studied in this research.
!
!
2.1.2. Pleasure, Arousal, Dominance (P-A-D) Scale
!
After covering the stimulus and response taxonomies separately, the link
between them should be analyzed as well. As it is mentioned before, the
intervening variables, in other words the emotional process that happens in
the consumer in between the external stimuli and the response given to that
stimuli, areanalyzed in this chapter.
!
Response Approach Avoidance
Physical stay in the store leave the store
Exploratory investigate items stay inanimate
Communicative interact with others stay isolated
Mehrabian and Russell (1974) propose that whatever the response is
(approach/avoidance), it is a result of three basic dimensions or states of
emotion. These three states are; pleasure, arousal and dominance (P-A-D).
In order to explain these three states in paired terms it is possible to say that
what the consumer feels after encountering the external stimuli is
pleasure-displeasure, arousal-nonarousal and dominance-submissiveness. If the
positive parts of each pair is valid then the response is probably approach, if
the negative parts of each pair is valid then the response is probably
avoidance (Mehrabian and Russell, 1974).
!
Each dimension of P-A-D scale indicate a series of emotions that is triggered
in the consumer. Pleasure indicates feeling happy, pleased, satisfied,
contended, hopeful and relaxed. Arousal refers to feeling excited, frenzied,
jittered, aroused and stimulated. Dominance refers to what degree the
subject is in control of the environment, in other words to what extent the
individual feels free to act against the stimuli (Donovan and Rossiter, 1982;
Billings, 1990; Donovan et. al., 1994; Tai and Fung, 2011; Bohl, 2012).
Mehrabian and Russell (1974) name this P-A-D scale as “inter-modality”
which shows that emotional reactions indicate a common denominator of all
human responses against all types of environmental setting. In other words it
is possible to say that, the balance between pleasure, arousal and
dominance defines an individuals response to any given environmental
setting. Even earlier than M-R model’s assumptions, semantic differential
studies have proposed that judgement of any complex stimuli can be
activity and potency (Osgood, Suci and Tannenbaum, 1957). Herein,
evaluation corresponds to pleasure, activity corresponds to arousal and
potency corresponds to dominance (Billings, 1990). So, for a long period of
time it is known that all judgmental human responses against any given
environmental stimuli can be dissociated into three basic dimensions;
pleasure, arousal and dominance.
!
Even if Mehrabian and Russell (1974) proposed that all three dimensions are
assumed to work orthogonally, Donovan and Rossiter (1982) proposed that
arousal and pleasure appear to interact in the determination of approach/
avoidance behavior. In neutral conditions, when the environment is evaluated
to be neither pleasing nor displeasing by the subject, medium level of arousal
tend to result in approach behavior (Donovan and Rossiter, 1982). However,
in the same situation, when the arousal level is either too high or too low,
subjects tend to avoid the environment (Donovan and Rossiter, 1982).
Another condition, where pleasure and arousal seem to interact is when the
environment is evaluated to be pleasing or displeasing by the subject. In a
pleasing environment, if the level of arousal increase then the probability of
approach behavior also increases. On the contrary, in a displeasing
environment, as the level of arousal increase, the probability of avoidance
behavior also increase (Donovan and Rossiter, 1982; Billings, 1990) (see
Figure 4). This interaction between pleasure, arousal and approach/
avoidance behavior is named as the “inverted U relationship” (Mehrabian and
!
Figure 4. Graph showing the relationship between pleasure, arousal and approach/avoidance behavior (Billings, 1990: 13)
!
!
In the later studies of Russell and Pratt (1980), it is proposed that the
dominance dimension should be deleted from the P-A-D scale. Russell
states that dominance is mostly related to the individual features of the
subject and it is not possible to apply dominance to situations that call for
emotional responses. They also assume that using pleasure and arousal
dimensions would be sufficient for demonstrating the possible emotional
responses of the consumers against all types of environmental settings
(Dawson, Bloch and Ridgway, 1990). However, as it is mentioned before,
dominance is the measure of how free an individual feels to act against an
external stimuli. In other words, how free that individual feels to exhibit
approach/avoidance behavior. In that sense, dominance becomes a
-13
Figure 3
COMBINED EFFECTS OF PLEASURE AND AROUSAL ON APPROACH-AVOIDANCE BEHAVIOR APPROACH
t
t
AVOIDANCE NEUTRAL PLEASANTLow Moderate High
significant way of representing the response that resulted from the balance
between pleasure and arousal. Therefore, dominance might not be a part of
the P-A-D scale yet can be perceived as a moderator between pleasure,
arousal and approach/avoidance behavior. For this reason, dominance will
not be ignored in this study and the model areused in its original
tridimensional form.
!
!
2.1.3. Individual Features Influencing the Functioning of M-R Model
!
Given the same external stimuli, each and every individual might have a
different reaction against that stimuli. Even if the outcome would be
categorized as either approach/avoidance in any case, the processing of the
information in between the income (stimulus) and the outcome (response)
might differ from person to person. In this section, the reasons for this variety
of information processing arediscussed.
!
Bohl (2012) states that the general features that might influence the attitude
towards the environmental setting includes age, gender, community, financial
status, marital status, psychological factors, lifestyle,value judgements and
personality. However, like it is mentioned in the information rate theory of
Mehrabian and Russell, categorizing people according to any factor that
might differ from person to person is both impossible and would not give
accurate results. Also it would be impossible to track people’s behavior
can be categorized depending on their features that appear to be more
pertinent with their shopping habits. In this sense consumers can be
categorized in three different ways; screeners and non-screeners, hedonic
purchasers and utilitarian purchasers and maximizers and satisfiers. In
addition to these, gender also plays an important role in the working principle
of M-R model.
!
Mehrabian and Russell (1974), proposed to categorize consumers into two
as screeners and non-screeners. They stated that people, who tend to filter
the unnecessary information in the setting can be named as screeners. On
the contrary, people who tend to perceive all the stimulus as equally
important and receive all the information can be named as non-screeners.
How these two types of consumers differ from each other is that, given a
novel and complex environment (with a high information rate or high load) a
screener would be less aroused from the external stimuli yet a non-screener
would get highly aroused by the environment. In other words, even if the
environment is a pleasant one, a screener might approach it finding the
environment mildly arousing yet a non-screener might avoid the environment
finding it too arousing depending on the inverted U relationship explained
above. Therefore being a screener or a non-screener influences the working
principle of the M-R model (Mehrabian and Russell, 1974).
!
Another individual feature that might affect the working principle of M-R
model is if the individual is a hedonic or a utilitarian consumer (Dawson,
before, a utilitarian consumer is a product-oriented consumer who might not
be influenced easily by ads, store environment or the attitude of the sales
personnel. On the other hand a hedonic shopper is an impulsive consumer
that might go shopping without a specific item or brand in mind and can
easily be influenced by the ads, store environment, point of purchase
displays, sales personnels’ attitude and so on. Therefore, the
Mehrabian-Russell model might work in a different sense on the two different types of
consumers. For a utilitarian consumer, the level of pleasure, arousal and
dominance presented by the store environment might not be an important
concern and might not change the usual buying pattern exhibited. If the store
environment does not cause an impulsivity in the consumer than the
consumer would neither approach the store nor avoid it. On the contrary, for
a hedonic consumer, the pleasure, arousal and dominance dimensions of a
store environment might be a matter of interest and might cause the subject
to either avoid or approach the store. If the outcome is approach then the
shopping process would most probably end in an impulse purchase.
!
Another way of categorizing consumers is distinguishing them as maximizers
and satisficers (Schwartz, Ward, Monterosso, Lyubomirsky, White and
Lehman, 2002). Maximizers are the type of consumers that go through all the
possible choices and choose the best possible option among them. However,
satisficers are more likely to settle for a good enough option even if it is not
the ideal one. Therefore, it can be hypothesized that maximizers might be
less influenced by the external stimuli such as store atmospherics or the
Or if they are influenced by the external stimuli they might be disturbed more
by something they find unpleasant or too arousing than satisficers might be.
!
Gender also plays an important role in influencing the working principle of
M-R model. The effect of pleasure, arousal and dominance have different
outcomes on men and women. For example d’Astous (2000) has found out
that women are more disturbed by inappropriate temperature, store size and
crowding than men are. Another study by Raajpoot, Sharma and Chebat
(2008) have proposed that sales personnel’s attitude does not play an
important role in the overall evaluation of the store for women. On the
contrary men do care about sales personnel’s attitude when evaluating the
store. Gender differences apply to color scheme preferences in the stores as
well. Men stated shades of blue as their favorite color twice more likely than
women, yet, women state pink and purple to be their favorite color twice
more likely than men in stores (Ellis and Ficek, 2001). As the two genders
have different preferences, store design might apply differently to each
gender. Men might find a store that is colored in shades of blue pleasant yet
women might find it unpleasant and so that the two might perform different
approach/avoidance behavior against the same store design.
!
As might be expected, the individual differences discussed above, except
gender, is impossible to detect and hard to control. However, given a definite
proportion of a community, that group would include screeners as well as
non-screeners and maximizers as well as satisfiers. Therefore, it is possible
be expected to reflect the actual properties of the population in general. In
this sense, for this study, it is possible to say that the individual
characteristics of the attendants is not particularly profiled or picked yet are
assumed to reflect the rest of the community. Also, as these individual
differences is common for all the attendants it is expected that they don’t
significantly affect the results of the study or decrease the reliability of the
results.
!
!
2.1.4. Summary of M-R Model
!
In order to draw a more concrete and visual profile of how M-R model works,
it would be appropriate to summarize everything that has been covered in the
previous chapters, in a more compact manner.
!
First of all, the target consumer profile is explained which is the impulse
purchaser. The reason for aiming this type of purchasers is that, impulse
purchasers are not product oriented, they are hedonic and can easily be
influenced by advertisements, point of purchase displays, showcases,
attitude of the sales personnel or other customers. However, most
importantly as they view the product itself and the immediate surrounding of
it as a whole, they evaluate the product within the store environment so they
may also be easily influenced by color design.
Secondly, the working principle of M-R model is covered. M-R model is an
environmental psychology model that is developed by Albert Mehrabian and
James Russell in 1974. M-R model has a tridimensional paradigm based on
a stimulus, an organism and a response (S-O-R paradigm). The stimulus that
areused in this study arethe store color scheme of the environment. The
organism that will absorb this information arethe impulse participants of the
experiment. After the participant receives the information, it is assumed that
another tridimensional sub-process will start. Keeping in mind that the
paradigm is still in the second stage which is the organism stage, the
participant will go through different emotional responses that is a combination
or pleasure, arousal and dominance. Pleasure is the evaluation of the
environment as either pleasant or unpleasant. Arousal defines how
stimulated the participant gets as a result of the load of the either pleasant or
unpleasant environment. If the environment is pleasant then high levels of
environmental load will have a positive outcome. However, if the environment
is not categorized to be pleasant then high levels of environmental load will
result in negative outcome. Dominance, meanwhile will indicate how free the
participant feels to act against information received from the environment.
Proceeding to the last stage, the response stage, if the environment has a
positive influence on the participants the result is assumed to be approaching
the store. On the contrary, if the environment has influenced the consumer
negatively than the probable response areavoiding the environment. So the
adjusted M-R model used in this study areas shown in Figure 5;
!
Figure 5. Adjusted model that shows the working principle of S-O-R paradigm in this study (Mehrabian and Russell, 1974)
!
!
There arefour main indicators of whether the participants approached or
avoided the environment. These four indicators will be; the amount of time
spent in the environment, the number of items touched in the environment,
the amount of time spent for browsing items and the number of task
performances undertaken. An increase in the four listed behavior is assumed
to indicate that the participant has approached the environment and vice
versa. In addition to this, in order to be able to observe whether the
participant is particularly approaching the color surrounding the display or
not, the direction patterns of the consumers are also recorded. The tendency
to go towards the colored side can also be perceived as an indicator of
dominance showing that the consumer feels in control of the environment
and would be able to move freely in it. Therefore, the final form of the model
as it areused in this study is as it is shown in Figure 6;
!
Color Scheme and Lighting Pleasure! Arousal! Dominance Approach/ Avoidance!
Figure 6. The final form of the model as it areused particularly for this study
!
!
To summarize, it is assumed that the four main responses towards an
environment; physical, exploratory, communicative and performative, indicate
whether the individual approaches or avoids the environment. In this study,
communicative responses are eliminated as only one participant is present in
the room at a time. The other three responses are observed. The time spent
in the environment is accepted as the physical response of the individual. If
the individual tends to stay more in the environment, (s)he also tends to
approach the environment and vice versa. Number of items touched, time
spent for browsing and investigating items are accepted as the exploratory
responses of the individuals. If the individual tend to touch more items and
Color Scheme and Lighting Pleasure! Arousal! Dominance Approach/ Avoidance
Stimulus Organism Response
time spent in the environment number of items touched browsing time task performance direction ! patterns
spend more time browsing and investigating items then the individual also
tends to approach the environment and vice versa. Number of task
performances undertaken is accepted as the performative response. Trying
on the items are referred to as undertaking task performances and therefore
if the individual tends to try on more items then (s)he also tends to approach
the environment and vice versa. Lastly, to be able to observe whether the
individuals physically approach/avoid the colour setting, the location of colour
also changes in addition to its hue. If the individual diverges to the color then
(s)he also tends to approach the environment. If the individual converges to
the color then (s)he also tends to avoid the color.
!
!
!
!
!
!
!
!
!
!
!
!
!
!
CHAPTER 3
!
!
STORE ATMOSPHERICS
!
!
!
3.1. Definitions and Approaches
!
Store atmospherics is firstly studied by Philip Kotler in 1973. He defined
store atmospherics as “ buying environments (designed) to produce specific
emotional effects in the buyer that enhances his purchase probability” (Kotler,
1973: 50). In other words, depending on the information provided by the M-R
model (Mehrabian and Russell, 1974), store atmospherics should be used to
make the consumer approach the store initially and then the product
collaterally. The end purpose aimed for the consumer is principally to make
the consumer leave the store with a purchase, a purchase either in mind or
an unintended purchase that is not planned beforehand. According to Kotler,
even if the purchase is made over the merchandise, the evaluation does not
remain limited to the merchandise itself. Consumers evaluate the product as
a whole with its immediate surrounding, in other words with the store