Arch Neuropsychiatr 2015; 52: 194-7 • DOI: 10.5152/npa.2015.7180
Electroencephalography Spectral Power Density in First-Episode Mania: A
Comparative Study with Subsequent Remission Period
Sertaç GÜVEN
1, Sermin KESEBİR
2, R. Murat DEMİRER
3, Mustafa BİLİCİ
4Correspondence Address: Dr. Sermin Kesebir, Department of Industry and System Engineering, Engineering and Natural Science Faculty, İstanbul, Turkey Phone: +90 532 592 20 80 E-mail: [email protected]
Received: 20.03.2013 Kabul Accepted: 11.12.2013
1Clinic of Psychiatry, Sandıklı State Hospital, Kütahya, Turkey
2Department of Psychiatry, Humanities and Social Sciences Faculty, İstanbul, Turkey
3Department of Industry and System Engineering, Engineering and Natural Science Faculty, İstanbul, Turkey
4Department of Psychology, Faculty of Economics Administrative and Social Sciences, Gelişim University, İstanbul, Turkey
Introduction: Our aim in this study was to investigate spectral power density (PSD) in first-episode mania and subsequent remission period and to evaluate their difference.
Methods: Sixty-nine consecutive cases referring to our hospital within the previous 1 year, who were evaluated as bipolar disorder manic episode according to The Diagnostic and Statistical Manual of Mental Disorders-IV (DSM-IV) at the first episode and had the informed consent form signed by first degree relatives, were included in this study. Exclusion criteria cluded having previous depressive episode, using drugs which could in-fluence electroencephalographic activity before electroencephalography (EEG), and having previous neurological disease, particularly epilepsy, head trauma, and/or loss of consciousness. EEG records were obtained using a digital device in 16 channels; 23 surface electrodes were placed according to the International 10–20 system. Spectral power density (dbµV/Hz) of EEG signal provided information on the power carried out by EEG waves in defined frequancy range per unit frequency in the present study.
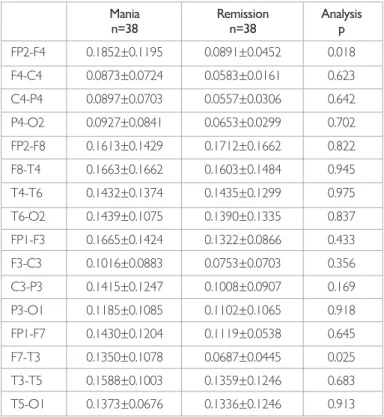
Results: A peak power value detected on the right with FP2P4 and on the left with F7T3 electrodes were found to be higher in the manic episode than in the remission period (p=0.018 and 0.025). In the remission peri-od, in cases with psychotic symptoms during the manic periperi-od, F4C4 peak power value was found to be lower than that in cases with no psychotic findings during the manic period (p=0.027). There was no relation was found between YMRS scores and peak power scores.
Conclusion: Electrophysiological corollary of mood episode is present from the onset of the disease, and it differs between the manic and re-mission periods of bipolar disorder. In the rere-mission period, peak power values of PSD distinguish cases with psychotic findings from cases without psychotic findings when they were manic.
Keywords: First episode, mania, QEEG, spectral power density, frontal cortex, temporal cortex
ABSTRACT
194
Research Article
©Copyright 2015 by Turkish Association of Neuropsychiatry - Available online at www.noropskiyatriarsivi.com
INTRODUCTION
In bipolar disorder (BD), cognitive impairment in various areas, particularly attention, verbal learning, and executive function, is ob-served during active disease and remission periods (1,2,3). Savitz et al. (4) have suggested that cognitive function in BD is the conse-quence of chronic impairment in the neural network. It has been demonstrated that frontolimbic connections are influenced in BD (5). However, for an integrated mood and cognitive function, corticocortical connections should also be intact. In addition, synchronization among neurons is also required.
This is made possible by electric signals (6,7). Electroencephalography (EEG) is one of the current most optimum means of investigating dynamic brain functions owing to its high temporal resolution. Quantitative electroencephalography analysis converts a certain EEG charac-teristics into a numerical value. A signal analysis method used commonly in quantitative EEG analysis is EEG power spectrum density (PSD) signal analysis, which yields information on the power carried by EEG waves per unit frequency at a defined frequency range (8). In BD, El-Badri et al. (9) found in 2001 with 29 euthymic cases that 29 EEG PSD was higher than healthy controls in all bands. However, the greatest difference was found in left occipital beta band. The aim of this study is to investigate EEG PSD in first-episode mania and the subsequent remission periods, to determine whether they are different, and to investigate whether peak values of PSD and clinical characteristics are related.
METHODS
SampleIn the present study, 69 consecutive first-episode mania cases aging 18–65 whose informed consent was signed by first degree relatives and were referred to our outpatient clinic or emergency service within the previous year and diagnosed with BD manic episode,
ac-Arch Neuropsychiatr 2015; 52: 194-7 Güven et al. EEG in First-Episode Mania and Subsequent Remission
cording to The Diagnostic and Statistical Manual of Mental Disorders-IV (DSM-IV) were evaluated. No previous depressive period; no history of previous neurological disease, particularly epilepsy, head trauma, and/or loss of consciousness; and not using any drug (antiepileptics, anxiolytics, antide-pressants, and/or antipsychotics) that could affect EEG activity before EEG recording were the inclusion criteria. Some cases were excluded as they had to be administered a pharmacological agent that may affect EEG before the recording of EEG (n=5), some because their diagnosis was changed to schi-zoaffective disorder or psychotic disorder (n=3), and some because they did not come for control EEG recording in the remission period (n=11). Finally, data of overall 50 patients were considered for evaluation.
Among first BD manic episode cases, epileptic EEG was found in two cas-es (4%) and nonepileptic abnormal EEG in 10 cascas-es (20.8%). Peak valucas-es of PSD were compared after excluding cases with epileptic or nonepilep-tic abnormal EEG findings (n=38).
Tools
DSM-IV structured clinical interview (SCID-I): It was developed
by First et al. (10) in 1997 to investigate first axis disorders according to DSM-IV, and its reliability and validity study in Turkish was performed by Özkürkçügil et al. (11).
Mood disorders diagnosis and follow up form (SKIP-TURK):
It was used to investigate sociodemographic and clinical characteristics of the cases (12).
Young mania rating scale (YMRS): It was used to determine the
severity of manic symptoms before treatment and to confirm remission. This scale that was filled out by the interviewer was developed by Young et al. (13), and its validity and reliability study in Turkish was performed by Karadağ et al. (14).
Implementation
Necessary approval for the study was obtained from Erenköy Psychiat-ric and Neurological Diseases Training and Investigation Hospital training planning and coordination committee. YMRS was used for the first evalu-ation and SCID-I and SKIP-TURK in the remission period.
Manic period EEG was recorded before the onset of antimanic treatment, depending on the severity of the mania. In cases requiring sedation before recording of EEG, haloperidol and ketiapin were administered because, in 2812 cases, Centorrino et al. (15) showed that haloperidol and quetiapine was antipsychotics influencing the EEG activity the least. After the record-ing of manic period EEG, pharmacological treatment was started in each case according to the preference of the patients’ physicians. In the present study, no intervention was made to the treatment of mania and investi-gators were blinded to the type of mania treatment. After the remission period was corroborated by YMRS at least for 2 weeks (YMRS<5 weeks), remission period EEG was recorded.
All EEG recordings were obtained in the EEG laboratory of Erenköy Psychiatric and Neurological disorders Hospital by the same technician using a 33-channel ESAOATE, Mizar, 2004/Italy digital EEG device in 16 channels. Twenty-three surface electrodes were placed according to the International 10–20 system (8). EEG recordings were obtained at a 70-Hz sampling speed in the resting position, and an artifact control was created before the evaluations.
The following points were determined: (i) whether EEG was epileptic; (ii) if not epileptic, whether it included other abnormal patterns
(dysrhyth-mia, slow wave, amplitude abnormalities, and asymmetry); (iii) peak pow-er values for 16 channels at 12–30 Hz (alpha and beta band) frequency range. We chose this frequency range because it included both alpha and beta activity. Spectral analysis is a commonly used signal analysis method in EEG analysis. To observe the frequency corresponding to density, com-mon approach in HFD analysis is using the squares of Fourier coefficients to form the graphic termed as power spectrum and the digital EEG device presents these data with a loaded program. PSD EEG signal provides in-formation regarding the power carried by the EEG waves at the defined frequency range per unit frequency. In the present study, PSD was defined as dbµV/Hz, i.e., output power is logarithmic and expressed in decibels. Maximum value was considered among the power values at the given frequency range (12–30 Hz) and frequency corresponding to this value was found. This procedure was performed for each channel.
Statistical Analysis
For the comparison of numerical data, T test (mean±SD<0.3) was used; if they were not distributed normally Mann–Whitney U test was used. For the comparison of categorical data, chi-square and Fisher’s exact tests were used. All tests were two ended and p value of <0.05 was considered significant. For correlation analysis, Pearson correlation test was used. For the comparison of repeated measurements in the same cases, Wilcoxon test was used.
RESULTS
Sample Characteristics
Of the BD cases in the first-episode manic period, 44% were female and 56% male. Their mean age was 26.4±4.8 years and mean duration of education was 10.7±2.1 years (Table 1).
Comparison of Peak Power Values between Mania and Remission
Peak power values detected at FP2P4 and F7T3 electrodes were found to be higher during the manic period than those during the remission period (p=0.027 and 0.033; Table 2). These values correspond to approximate-ly15- and 16-Hz in beta band.
Investigation of the Relation between Peak Power Value and Clinical Characteristics
Manic period: In first-episode mania cases, cases with significant family
history, childhood trauma, suicide attempt, and psychotic findings were compared with the cases without them, and peak power values were found to be similar between both. No relation was found between age (also the age of onset) and YMRS scores and peak power values at 16 points.
Remission period: When peak power values were compared between
cases with significant family history, childhood trauma, suicide attempt, and psychotic findings and those without them, similar to the manic period, peak power values were found to be similar. However, in cases with psy-chotic findings during the manic period, F4C4 peak value in the remis-sion period was found to be higher than that in those without psychotic findings during the same period (p=0.027). These values correspond to approximately alpha band 11 Hz.
DISCUSSION
In the study by Ray and Cole (16) in 1985, it was reported that in cognitive functions such as mental arithmetic not requiring environmental attention, alpha activity increased, particularly in the parietal region, whereas in the 195
tests with emotional content, beta activity increased, particularly in the temporal region. In the present study, in first-episode mania cases, un-like in the remission period, higher maximum peak values were obtained from right frontoparietal and left frontotemporal electrodes. Beta band corresponding to these values is responsible for maintenance of present sensorimotor and cognitive status (status quo) and for preparation of (go-no go) responses and inhibitor control (17). Pathological changes in the activity of this band are linked to abnormal resistance in present condi-tion, and lack of flexible cognition and behavior (18). EEG spectral power analysis has revealed that significant effect was generally observed in beta subbands with low frequency and that the highest peak power values be-longed to them in performance tests.
Findings supporting the above findings can be found in studies on ADHS. In ADHS, beta activity was found to be higher than that in healthy controls,
particularly in the frontal region, and it was reported that it decreased with drugs but did not return to normal and was associated with hyperac-tivity and impulsivity (19). In ADHS, frontal beta achyperac-tivity is higher in cases responding to stimulants than that in cases not responding (20). In addi-tion, frontal beta activity was found to be associated with improvement in Conners Continuos Performance Test performance (maintenance of attention and inhibitor control) and decrease in hyperactivity–impulsivity scores reported by the family. Increased beta oscillatory beta activity after a positive feedback has been repeatedly demonstrated in previous studies (21). In gambling test including both positive and negative feedback, unex-pected awards were markedly associated with increased beta activity (22). In a study comparing cases who are successful in inhibitor control with those who are not so in stop signal task, highest response in intracranial electrodes was obtained in the right inferior frontal gyrus beta band (opti-mally approximately 16 Hz) (23). In the same study, in cases with inhibitor control, alpha/beta desynchronization in primary motor cortex was found to be decreased. It was suggested that this decrease is associated with GABAergic inhibition. It was also proposed that the function of GABA in this context is a type of gating to synchronize and harmonize processes in different areas (24,25,26). In the study by Liu et al. (27), it was demon-strated that increased slow-wave activity in frontal central regions was specific to bipolar depressions. In a study on early onset psychosis cases, it was suggested that abnormal gama and beta activities detected with mag-netoelectroencephalography (MEG) implied reduction in control over motor movements, which was associated with the reflection of impaired inhibition function of GABA at cellular and system level (28).
In the present study, no relation was found between YMRS scores and peak values at 16 points. However, the presence of psychotic finding ap-pears to create a difference. F4C4 peak value during the remission period was found to be lower in cases with psychotic findings during manic period than those without psychotic cases during the same period. This finding may be interpreted as the trace left by psychosis. In the course of BD, disease periods have accumulating effect, which is felt most strongly in cognitive functions (23).
Central alpha activity, corresponding to peak power values, which are found to be lower in the remission period in cases with psychotic findings in the mania period, are associated with coding and recognition process-es (29). Increase in performance in working memory tprocess-ests, particularly semantic memory, is expected to transfer long term memory codes to short term memory and to reactivate them. In the study by Başar et al. (30), alpha activity detected in euthymia was found to be lower in cases with BD than that in healthy controls. The relation between psychotic findings and EEG abnormality is more marked in psychotic spectrum. Increased gamma activity in first-attack psychotic cases is a finding cor-roborated in many studies (31). In cases in which EEG abnormality was detected in first attack, unfavorable clinical course characteristics were observed more commonly in the first 3-year follow-ups (32). In a study comparing epileptic cases with and without psychotic findings, in epileptic cases with schizophrenia-like psychosis, increased alpha synchronization was observed in MEG and dorsolateral prefrontal cortex (33).
The effect of psychotropic drugs on peak values during the remission pe-riod is an important confounding factor. As in previous studies with similar design, the fact that antimanic treatment, in other words psychotrope use was not controlled for is an important limitation of the present study. Antimanic treatments received by our cases is as follows: lithium in 8 cases, sodium valproate in 12 cases, lithium and ketiapin in 7 cases, lithium and olanzapine in 3 cases, and sodium valproate and olanzapin in 8 cases. An-other limitation of our study was that there was no healthy control group. 196
Güven et al. EEG in First-Episode Mania and Subsequent Remission Arch Neuropsychiatr 2015; 52: 194-7
Table 1. Sociodemographical and clinical properties of BD patients
BD, n=50
Gender (F/M) 22/28
Age (Mean±SD) 22.6±3.7 Education year (Mean±SD) 7.8±1.1 Age of onset (Mean±SD) 22.6±3.7 Family history (%) 46 Severity of episode (YMRS), (Mean±SD) 28.3±3.5 Psychotic symptom (%) 32 Duration of episode (day), (Mean±SD) 46.7±11.5 GAF (Mean±SD) 55.6±20.9 F: female; M: men; SD: standart deviation; BD: bipolar disorder; YMRS: Young Mania Rating Scale; GAF: general assessment of functionality
Table 2. Comparison of peak power values between mania and
remission
Mania Remission Analysis n=38 n=38 p FP2-F4 0.1852±0.1195 0.0891±0.0452 0.018 F4-C4 0.0873±0.0724 0.0583±0.0161 0.623 C4-P4 0.0897±0.0703 0.0557±0.0306 0.642 P4-O2 0.0927±0.0841 0.0653±0.0299 0.702 FP2-F8 0.1613±0.1429 0.1712±0.1662 0.822 F8-T4 0.1663±0.1662 0.1603±0.1484 0.945 T4-T6 0.1432±0.1374 0.1435±0.1299 0.975 T6-O2 0.1439±0.1075 0.1390±0.1335 0.837 FP1-F3 0.1665±0.1424 0.1322±0.0866 0.433 F3-C3 0.1016±0.0883 0.0753±0.0703 0.356 C3-P3 0.1415±0.1247 0.1008±0.0907 0.169 P3-O1 0.1185±0.1085 0.1102±0.1065 0.918 FP1-F7 0.1430±0.1204 0.1119±0.0538 0.645 F7-T3 0.1350±0.1078 0.0687±0.0445 0.025 T3-T5 0.1588±0.1003 0.1359±0.1246 0.683 T5-O1 0.1373±0.0676 0.1336±0.1246 0.913
Despite the limitations, in the present study, important electrophysiolog-ical data and clinelectrophysiolog-ical connections regarding BD were disclosed. First-ep-isode mania and the subsequent remission period display differences electrophysiologically. These differences are characterized by abnormal resistance and lack of flexible cognition and behavior. In addition, peak power values of PSD during the remission period aid in distinguishing cas-es with psychotic findings in manic period from those without psychotic findings. Our cases were first-episode cases indicated that electrophysio-logical corollary of BD is present starting from the onset of disease. Conflict of Interest: No conflict of interest was declared by the authors. Financial Disclosure: The authors declared that this study has received no
fi-nancial support.
REFERENCES
1. Van Gourp WG, Altshuller L, Theberge DC. Cognitive impairment in euthy-mic bipolar patients with and without prior alcohol dependence. Arch Gen Psychiatry 1998; 55:41-46. [CrossRef]
2. Ferrier IN, Santon BR, Kelly TP. Neuropsychological function in euthymic pa-tient with bipolar disorder. Br J Psychiatry 1999; 175:246-251. [CrossRef]
3. Clark L, Iversen SD, Goodwin GM. Sustained attention deficit in bipolar disor-der. Br J Psychiatry 2002; 180:313-319. [CrossRef]
4. Savitz J, Solms M, Ramesar R. Neuropsychological dysfunction in bipolar affec-tive disorder. Bipol Disord 2005; 7:216-235. [CrossRef]
5. Starkowski SM, Del Bello MP, Adler CM. The functional neuroanatomy of bipolar disorder: a review of neuroimaging findings. Mol Psychiatry 2005; 10:105-116. [CrossRef]
6. Başar E, Başar Eroğlu C, Karakaş S. Gamma, alpha, delta and theta oscillations govern cognitive processes. Int J Psychophysiol 2001; 39:241-248. [CrossRef]
7. Başar E, Güntekin B. A rewiev of brain ossilations in cognitive disorders and role of neurotransmitters. Brain Res 2008; 1235:172-193. [CrossRef]
8. Fisch BJ. Fisch ve Spehlmann’dan EEG’ye Giriş: Dijital ve Analog EEG’nin Temel İkeleri. 3. Baskı. Şahiner T (Çev. ed). İstanbul: Turgut Yayıncılık 2008. 9. El-Badri SM, Ashton CH, Moore PB, Marsh VR, Ferrier IN.
Electrophysiolog-ical and cognitive function in young euthymic patients with bipolar affective disorder. Bipolar Disord 2001; 3:79-87. [CrossRef]
10. First MB, Spitzer RL, Gibbon M. Structured Clinical Interview for DSM-IV Clini-cal Version (SCID-I / CV), Washington DC, American Psychiatric Press 1997. 11. Özkürkçügil A, Aydemir Ö, Yıldız M. DSM-IV Eksen I bozuklukları için
yapılandırılmış klinik görüşmenin Türkçe’ye uyarlanması ve güvenilirlik çalışması. İlaç ve Tedavi Dergisi 1999; 12:233-236.
12. Özerdem A, Yazıcı O, Tunca Z, Mood Disorders Study Group, Psychiatric As-sociation of Turkey and K Tırpan. Establishment of Computerized Registry Pro-gram for Bipolar Illnes in Turkey: SKİP-TÜRK. J Affect Disord 2004; 84:82-86. 13. Young RC, Biggs JT, Ziegler VE. A Rating Scala for Mania: Reliability, validity and
sensitivity. Br J Psychiatry 1978; 133:429-435. [CrossRef]
14. Karadağ F, Oral ET, Yalçın F. Young Mani Derecelendirme Ölçeği’nin Türkiye’de geçerlik ve güvenirliği. Türk Psikiyatri Dergisi 2001; 13:107-114.
15. Centorrino F, Price B, Tuttle M. EEG abnormalities during treatment with typi-cal and atypitypi-cal antipsychotics. Am J Psychiatry 2002; 159:109-115. [CrossRef]
16. Ray WJ, Cole HW. EEG alpha activity reflects attentional demands and beta activity reflects emotional and cognitive processes. Science 1995; 228:750-752. [CrossRef]
17. Zhang Y, Chen Y, Bressler SL, Ding M. Response preparation and inhibition: the role of the cortical sensorimotor beta rhythm. Neuroscience 2008; 156:238-246. [CrossRef]
18. Engel AK, Fries P. Beta band oscillations signalling the status quo? Curr Opin Neurobiol 2010; 20:156-165. [CrossRef]
19. Clarke AR, Barry RJ, McCarthy R, Selikowitz M, Clarke DC, Croft RJ. Effects of stimulant medications on children with ADHD and excessive beta activity in their EEG. Clin Neurophysiol 2003; 114:1729-1737. [CrossRef]
20. Loo SK, Hopfer C, Teale PD, Reite ML. EEG correlates of methylphenidate response in ADHD: association with cognitive and behavioral measures. J Clin Neurophysiol 2004; 21:457-464. [CrossRef]
21. HajiHosseini A, Rodriquez-Fornells A, Marco-Pallares J. The role of be-ta-gamma oscillations in unexpected rewards processing. Neuroimage 2012; 60:1678-1685. [CrossRef]
22. Marco-Pallares J, Cucurell D, Cunillera T, García R, Andrés-Pueyo A, Münte TF, Rodríguez-Fornells A. Human oscillatory activity associated to reward pro-cessing in a gambling task. Neuropsychologia 2008; 46:241-248. [CrossRef]
23. Swann N, Tandon N, Canolty R, Ellmore TM, McEvoy LK, Dreyer S, DiSano M, Aron AR. Intracranial EEG reveals a time- and frequency-specific role for the right inferior frontal gyrus and primary motor cortex in stopping initiated responses. J Neurosci 2009; 29:12675-12685. [CrossRef]
24. Whittington MA, Traub RD, Kopell N. Inhibition-based rhythms: experimen-tal and mathematical observations on network Dynamics. Int J Psychophysiol 2000; 38:315-336. [CrossRef]
25. Martinez-Aran A, Vieta E, Torrent C. Functional outcome in bipolar disor-der: the role of clinical and cognitive factors. Bipolar Disord 2007; 9:103-113.
[CrossRef]
26. Bhagwagar Z, Wylezinska M, Jezzard P. Reduction in accipital cortex gam-ma-aminobutyric acid concentrations in medication-free recovered unipolar depressed and bipolar subjects. Biol Psychiatry 2007; 61:806-812. [CrossRef]
27. Liu X. Quantitative EEG analysis and the value for differantial diagnosis on depression: I. Spectral power and coherence analysis. Zhonghua Shen Jing Jing Shen Ke Za Zhi 1991; 24:275-317.
28. Wilson TW, Slason E, Asherin R. Abnormal gamma and beta MEG activity during finger movements in early-onset psychosis. Dev Neuropstchol 2011; 36:596-613. [CrossRef]
29. Schack B, Klimesch W. Frequency characteristics of evoked and oscillatory electroensephalic activity in a human memory task. Neurosci Lett 2002; 331:107-110. [CrossRef]
30. Başar E, Güntekin B, Atagün İ, Turp Gölbaşı B, Tülay E. Brains alpha activity is highly reduced in euthymic bipolar disorder patients. Neurodyn 2012; 24:35-38. 31. Flynn G, Alexander D, Harris A. Increased absolute magnitude of gamma syn-chrony in first-episode psychosis. Schizophr Res 2008; 105:262-271. [CrossRef]
32. Manchanda R, Norman R, Malla A. EEG abnormalities and 3-year outcome in first episode psychosis. Acta Psychiatr Scand 2008; 117:177-182. [CrossRef]
33. Canuet L, Ishii R, Iwase M. Psychopathology and working memory-induced activation of the prefrontal cortex in schizophrenia-like psychosis of epilep-sy: Evidence from magnetoencephalography. Psychiatry Clin Neurosci 2011; 65:183-190. [CrossRef]
197