Page 1 of 26
Acoustic Streaming in a Soft Tissue Microenvironment
Ahmed El Ghamrawy1, Florentina de Comtes1, Hasan Koruk1,2, Ali Mohammed3,
Julian R. Jones3, James J. Choi1,*
1Noninvasive Surgery and Biopsy Laboratory, Department of Bioengineering, Imperial
College London, London, SW7 2AZ, UK
2Mechanical Engineering Department, MEF University, Istanbul, 34396, Turkey
3Department of Materials, Imperial College London, London, SW7 2AZ, UK
Page 2 of 26 ABSTRACT
1
We demonstrate that sound can push fluid through a tissue-mimicking material.
2
Although acoustic streaming in tissue has been proposed as a mechanism for biomedical
3
ultrasound applications, such as neuromodulation and enhanced drug penetration, no
4
direct observation of streaming in tissue or acoustic phantoms has been observed. We
5
developed a material that mimics the porous structure of tissue and used a dye and a video
6
camera to track fluid movement. When applied above an acoustic intensity threshold, a
7
continuous focused ultrasound beam (spatial peak time average intensity: 238 W/cm2,
8
centre frequency: 5 MHz) was shown to push the dye axially i.e. in the direction of wave
9
propagation and in the radial direction. Dye clearance increased with ultrasound intensity
10
and was modelled using an adapted version of Eckart’s acoustic streaming velocity
11
equation. No microstructural changes were observed in the sonicated region when
12
assessed using scanning electron microscopy. Our study shows that acoustic streaming
13
can occur in soft porous materials and provides a mechanistic basis for future using
14
streaming for therapeutic or diagnostic purposes.
15
Keywords: acoustic streaming; porous materials; drug delivery; focused ultrasound.
16 17
Page 3 of 26 INTRODUCTION
1
Acoustic streaming (Lighthill 1978; Nyborg 1953) - the bulk steady fluid
2
movement generated by the propagation of sound – has been proposed as the mechanism
3
of material displacement for biomedical applications, such as the enhancement of drug
4
penetration (Nieminen et al. 2012; Nieminen et al. 2015), promotion of angiogenesis
5
(Young and Dyson 1990), enhancement of tissue repair (Speed 2001), stimulation
6
(Bystritsky et al. 2011; Tyler 2011) and prenatal migration of neurons (Ang et al. 2006).
7
However, a mechanistic link between acoustic streaming and each bioeffect has not yet
8
been established. This is in part due to the lack of any direct observation or measurement
9
of acoustic streaming in soft tissues or porous materials, and whether this is even possible
10
has yet to be shown.
11
Flow generated in a free fluid by a sound beam has been described in theoretical
12
and experimental work (Eckart 1948; Lighthill 1978; Nyborg 1953; Westervelt 1953).
13
When an ultrasonic beam propagates through an unbounded liquid, a transfer of acoustic
14
momentum from the beam to the fluid particles occurs. Fluid viscosity, heat transfer and
15
relaxation processes lead to a reduction of the beam’s pressure amplitude, and thus its
16
intensity, with increasing distance from the sound source. Therefore, the momentum
17
transferred to the fluid also decreases with increasing depth. Consequentially an energy
18
density gradient is established, which in turn causes a net force acting on the fluid. This
19
force, also known as acoustic radiation force (ARF), generates acoustic streaming when
20
applied onto fluid (Lighthill 1978). The applied ARF increases with the sound intensity
21
and the material’s acoustic absorption property, which is in turn dependent on the sound
22
centre frequency and material’s fluid viscosity. It has been shown that focused ultrasound
23
(FUS) can generate streaming velocities up to several cm/s in free fluid close to the
24
geometric focus in the direction of propagation (Starritt et al. 1989).
Page 4 of 26
Acoustic streaming has been proposed as a mechanism for many therapeutic
1
bioeffects, because it could explain the net movement of a material (e.g., a drug) in a fluid
2
in a single direction (e.g., the direction of wave propagation), which was observed in
3
many studies in post-mortem analyses. This directional bias contrasts with temperature
4
dependent diffusion where molecular movement occurs in all directions. In studies of
5
articular cartilage exposed to FUS (Nieminen et al. 2012; Nieminen et al. 2015), a net
6
maximum displacement of an injected drug was observed at the focus in the direction of
7
wave propagation. In other applications, such as neuromodulation (Bystritsky et al. 2011)
8
and bone healing (Romano et al. 2009), although a net unidirectional fluid movement was
9
not observed, such an effect could have led to the resulting biological response. However,
10
even when a net displacement of a fluid is observed after ultrasound exposure, it does not
11
rule out other potential mechanisms of fluid movement. For example, ultrasound can
12
nucleate bubbles and drive the bubbles into a dynamic range of behaviours that lead to a
13
net displacement of fluid (e.g., primary Bjerknes force) (Apfel 1997; Bjerknes 1906). It
14
has been shown that cavitation can enhance skin permeability for drug delivery (Ogura et
15
al. 2008) and create tunnels in gel phantoms (Caskey et al. 2009). Currently, there is no
16
direct observation or quantification of acoustic streaming in soft tissue
17
microenvironments.
18
We hypothesized that acoustic streaming can be generated within soft porous
19
material microenvironments. This hypothesis was evaluated by developing a suitable soft
20
tissue phantom material and experimental methods that allowed for the direct optical
21
observation of fluid movement through the phantom. Moreover, the resulting acoustic
22
streaming was modelled using an adapted version of Eckart’s acoustic streaming velocity
23
equation. Our study shows that acoustic streaming can occur in soft porous materials and
Page 5 of 26
provides a mechanistic basis for future studies using streaming for therapeutic or
1
diagnostic purposes.
2
3
MATERIALS AND METHODS 4
Manufacturing and characterisation of tissue-mimicking materials
5
We created three phantoms – gelatin, polyacrylamide, and a macroporous
6
polyacrylamide (MPPa) hydrogel (Plieva et al. 2006). The gelatin phantom was prepared
7
by dissolving 5 g of gelatin powder (Fisher Scientific,Loughborough, UK) in 100 ml of
8
water heated to 40 C. The solution was then allowed to set overnight in a fridge. The
9
polyacrylamide hydrogel was prepared using 5 g of acrylamide monomer, 0.1 g of
N,N′-10
methylene-bis-acrylamide (BIS), 0.06 g of ammonium persulfate (APS) and 94 L of
11
N,N,N′,N′-tetramethylethylenediamine (TEMED) mixed in a 100 ml solution. The BIS
12
crosslinked the monomers while APS and TEMED initiate the polymerization process.
13
The gel was left to set at room temperature for 15 – 20 minutes. Macroporous
14
polyacrylamide (MPPa) was prepared using the freezing before gelation process. The
15
MPPa phantom was prepared using 10 g of Acrylamide monomer, 0.2 g of BIS, 0.12 g of
16
APS, 2 mL of allyl glycidyl ether (AGE) and 200 L of TEMED mixed in a 200 ml
17
solution. The compounds for the polyacrylamide and MPPa gels were from
Sigma-18
Aldrich Company Ltd., Dorset, UK. The solution was then degassed and slowly poured
19
into four 50 mL cylindrical containers. The containers were then placed in a freezer at
-20
20 C; this process allowed the gel to polymerize around the frozen water crystals, i.e.,
21
freezing before gelation. The containers including the materials were left in the freezer
22
for 16 hours. The containers were then removed from the freezer, washed and kept in an
23
oven at 60 C for 8 hours. The dry samples were taken out of the containers and measured
Page 6 of 26
for their weight and volume. The samples were then swelled in water for a few minutes
1
and measured again for their weight and volume. The mass and volume swelling
2
percentages for the MPPa gels were 98 12 % and 95 17 %, respectively. Scanning
3
electron microscopy (SEM) and mercury intrusion porosimetry (MIP) of gelatin,
4
polyacrylamide and MPPa were performed using a scanning electron microscope
5
(JSM5610LV Jeol, Peabody, MA, USA) and an automated mercury porosimeter
6
(AutoPore IV 9500 Series Micromeritics, Norcross, GA, USA) respectively. SEM
7
evaluates the hydrogel’s structure qualitatively and MIP measures the pore size
8
distributions based on the constrictions on mercury flow through the sample.
9
Experimental setup and acoustic measurements
10
A 5 MHz spherical-segment, single-element transducer (diameter: 33 mm, focal
11
length: 35 mm; SU-108 Sonic Concepts, Bothell, WA, USA) was used to emit focused
12
ultrasound pulses. The full width at half maximum (FWHM) focal diameter and length
13
of the ultrasound beam were 0.45 and 3.2 mm, respectively. Pressure calibrations, focal
14
point location, and FWHM beam measurements were performed in a degassed water tank
15
using a 200 µm diameter polyvinylidene fluoride (PVDF) needle hydrophone (Precision
16
Acoustics Ltd, Dorchester, UK) for peak-negative pressures up to 1 MPa. The water was
17
degassed using two filters and a membrane contactor (MiniModule, Liqui-Cel, Charlotte,
18
NC, USA) for two hours. The higher pressures and intensities reported for the parameters
19
used were simulated using a HIFU simulation tool based on the geometry of the
20
transducer and setup, attenuation of the MPPa gel and acoustic power transmitted from
21
the ultrasound transducer. The tool (a propagation module, which solves the Khokhlov‐
22
Zabolotskaya‐Kuznetsov (KZK) equation) simulated asymmetric nonlinear waves in an
23
attenuating medium (Soneson and Ebbini 2009).
Page 7 of 26
A dye of 0.025 ml from a 0.1% Bromophenol blue solution was injected into the
1
MPPa gel surface over 0.45 seconds using a 1 mL needle-less syringe and a syringe pump
2
(Harvard Apparatus PHD Ultra, Holliston, MA, USA), which was set to the maximum
3
constant flow rate of 3.3 ml/min. The MPPa hydrogel was then immersed in a degassed
4
water tank that was previously heated to 37°C. The MPPa surface was placed 35 mm
5
away from the transducer's surface and overlapped with the transducer’s focal point. The
6
focal point of a FUS transducer was placed to overlap with the region injected with the
7
dye (Fig.1). Axially, it was placed at the distal end of each hydrogel’s surface so that the
8
proximal half of the focal volume was in the phantom and the distal half was in the water.
9
A function generator (33500B Series, Agilent technologies, Santa Clara, CA, USA)
10
produced continuous 30 second pulses that were transmitted through a 50 dB power
11
amplifier (2100L, E&I Ltd, Rochester, NY, USA) and to the 5 MHz transducer. Three
12
different sets of ultrasound parameters [peak-negative pressure (pn): 2.6, 4.7, and 6.2
13
MPa, peak-positive pressure (pp): 3.1, 7.3 and 12.0 MPa, spatial peak time average
14
intensity (ISPTA): 238, 972 and 2002 W/cm2, duration: 30 s] were evaluated in our
15
experiments.
16
Dye clearance was captured with a camera (frame rate: 60 Hz, field of view:
17
1980×1080 pixels, model: Nikon 1 V3, Nikon Inc., USA). The camera was used with a
18
lens (focal length: 10-100mm, zoom ratio: 10:1, model: 1 NIKKOR 10-100mm f/4.0-5.6
19
VR, Nikon Inc., USA) and two magnifying glasses (zoom ratio: 6:1) (Fig.1).
20
Determination of the samples where the ultrasound beam was accurately placed
21
on the dye-infused hydrogel region was evaluated using a quantitative exclusion criterion.
22
After every sonication, the same hydrogel region was sonicated using a high acoustic
23
intensity that was known to produce dye clearance. Accurate targeting was determined if
24
thedye clearance occurring occurred in an area within 50% of the peak optical intensity.
Page 8 of 26
The parametric study was randomized such that 5 samples of MPPa hydrogels were used
1
for every ultrasound exposure parameter and the control (no ultrasound). The 5 samples
2
were produced from 3 different MPPa batches.
3
Analysis of raw videos
4
All images and raw video frames were processed and analysed using Matlab. The
5
dye clearance was measured by image processing of the captured video data. A spatial
6
disk filter of radius 5 pixels and a moving average filter of 5 frames was used to smooth
7
the raw data. The spatial resolution was approximately 10 µm/pixel. In order to visualise
8
the dye clearance, we subtracted each image frame after the start of sonication from the
9
first (reference) frame. The dye clearance is the mean average intensity of the pixels in
10
the FWHM of the focal region and was tracked over 1800 frames or 30 s. The dye
11
clearance is denoted in optical intensity units, a dimensionless quantity denoting the
12
intensity value per pixel in a grayscale frame or image.
13
Average velocity estimation
14
The calculation of steady state velocities of the developed flow in the MPPa gel
15
were obtained using a model derived from Eckart’s solution. To estimate the acoustic
16
streaming velocity induced by an ultrasound beam, the characteristics of both the sound
17
field and the sonicated material was considered. The hydrogel phantom was modelled as
18
a porous material with the dynamic properties of a viscoelastic fluid. In this case, the
19
microenvironment of the sample was characterized by its average pore diameter 𝛷, its
20
porosity 𝜀 and its permeability 𝜅. These parameters were material specific and were
21
estimated using MIP.
22
We assumed that the ARF generating the acoustic streaming has a component
23
acting in the axial direction and radial force was assumed to be to zero (Kamakura et al.
Page 9 of 26
1995). In addition, only the momentum transferred to the volume occupied by fluid
1
caused acoustic streaming and zero impedance mismatch between the fluid and the MPPa
2
hydrogel (Prokop et al. 2003). Laminar flow was induced, boundary effects at the pore
3
walls were neglected and thermal equilibrium existed (i.e. there was no energy loss due
4
to heating).
5
Acoustic streaming is a direct result of an ARF acting on the fluid. The magnitude
6
and direction of the force field generating the flow is in turn dictated by the shape of the
7
ultrasound beam. Therefore, knowing the spatial distribution of the sound field is a
8
prerequisite for any subsequent velocity estimation. In this study, we only considered the
9
sound field generated by a focused single-element transducer. Its radiating surface was
10
approximated as a segment of a sphere with disk radius 𝑎 and a geometrical focus at
11
distance 𝑑. The 𝐴𝑅𝐹 acting along the beam axis 𝐹𝑧, was modelled using the following
12
equation (Kamakura et al. 1995):
13 𝐹𝑧 =(𝜌𝛼 0𝑐0)2 𝑃𝑝2 𝑓2(𝑧)𝑒−2𝛼𝑧 (1) 14 with 15 𝑓(𝑧) = √(1 −𝑧𝑑)2+𝑧𝑧2 𝑑𝑖𝑓𝑓2 , 𝑧𝑑𝑖𝑓𝑓 = 𝜋 𝑎2 𝜆 (2) 16
Here, 𝛼 is the attenuation coefficient of the liquid phase, 𝜌0 is the fluid density,
17
𝑐0 is the speed of sound within the fluid and 𝑃𝑝 is the peak pressure at the focus of the
18
ultrasound beam. z𝑑𝑖𝑓𝑓 is the characteristic length of diffraction or Rayleigh length.
19
After defining the force field of the ARF, the steady state velocity of the fully
20
developed flow in a porous medium was approximated using a model derived from
21
Eckart's solution (Eckart 1948) to the acoustic streaming problem. Eckart considered the
Page 10 of 26
second-order, incompressible bulk-driven flow generated by an unfocused beam of sound
1
travelling through an infinitely long cylinder of radius 𝑟𝑐 with non-reflecting walls and
2
derived a model for the flow vorticity giving the streaming velocity 𝑈 as:
3 𝑈 = 𝐴 { 1 2(1 − 𝑥2 𝑦2) − (1 − 1 2𝑦 2) (1 − 𝑥2) − log 𝑦 0 ≤ 𝑥 ≤ 𝑦 − (1 −12𝑦2) (1 − 𝑥2) + log 𝑥 𝑦 ≤ 𝑥 ≤ 1 (3) 4 𝐴 = 𝑟𝑏2 𝜇 𝛼𝑃02 2𝜌0𝑐02 = 𝑟𝑏2 𝜇 𝛼𝐼 𝑐0, 𝑥 = 𝑟 𝑟𝑐, 𝑦 = 𝑟𝑏 𝑟𝑐 (4) 5
where 𝑟𝑏 is the radius of the sound beam, 𝑟 is the distance from the centre axis of the
6
beam, 𝑃0 is the peak sound pressure at the transducer surface, 𝐼 is the sound intensity, 𝛼
7
is the coefficient of attenuation, µ is the fluid viscosity and 𝑐0 is the speed of sound in the
8
fluid. 𝐴 is the ratio of the generated 𝐴𝑅𝐹 and the viscous damping of the fluid. Evidently,
9
Eckart's equation coincides with the theoretical prediction in which the acoustic streaming
10
velocity is proportional to 𝛼 and inversely proportional to µ.
11
Equation 3 only describes the bulk flow induced when plane waves traverse an
12
attenuating open fluid body (i.e. 𝑟𝑐 > beam diameter). In contrast, this study is interested
13
in the second-order flow generated by a focused ultrasound beam within a porous
14
medium. Therefore, eqn. 3 had to be adapted to the systems geometry and beam shape.
15
The following model was proposed to describe the axial streaming velocity generated in
16
a medium with porosity 𝜀, permeability 𝜅, and pore diameter 𝛷. Equation 5 corresponds
17
to a volume-averaged Poiseuille flow through a channel filled with a porous medium.
18
Substituting 𝑃0 in eqn. 3 by eqn. 1 incorporated the spatial changes in pressure amplitude
19
and characteristic beam width due to focusing. The systems geometry was taken into
20
account by the two factors 𝜀, considering for the stationary proportion of the medium not
21
contributing to the streaming velocity, and cos 𝜃. The latter accounts for the reduction in
Page 11 of 26
axial fluid velocity due to the internal geometry. Its necessity arises from the assumption
1
that the force is only acting in the axial direction, i.e. 𝐹𝑟 = 0. To consider the influence of
2
the channel size on the flow velocity, the inclusion of an additional term, 𝛷/𝑟𝑏 is used.
3
This material specific parameter took the relative size of the pore-channels 𝛷 to the beam
4
width 𝑟𝑏 into account. However, this parameter was ad-hoc and its justification needed to
5 be experimentally verified. 6 𝑈𝑧,𝑠= 𝜖 𝑟𝛷 𝑏 𝜅 𝜇 𝛼𝑃𝑝2 2𝜌0𝑐02 1 𝑓2(𝑧)𝑒−2𝛼𝑧cos(𝜃) (5) 7
Equation 5 only described the case where 𝛷 < 𝑟𝑏. For 𝛷 > 𝑟𝑏 eqn. 3 holds.
8
Furthermore, we assumed a one-dimensional flow field of streaming induced within
9
straight non-interacting channels. This contradicted the expectation for the flow pattern
10
in media consisting of interconnected channels such as the MPPa samples. In this case,
11
the channel geometry hindered the fluid to flow along straight lines and a radial velocity
12
component ensued even though radial force was equal to zero. This led to a reduction in
13
axial streaming velocity compared to the case of straight non-interacting channels.
14
Statistical analysis
15
Statistical tests were performed to ensure statistical significance of our results.
16
The maximum dye clearance for the different ultrasound exposure levels and control were
17
compared using a one-way analysis of variance (ANOVA) with multiple comparison test.
18
The significance levels adopted were p < 0.05, p < 0.01 and p < 0.001.
19
20
RESULTS 21
A tissue-mimicking material for acoustic streaming
Page 12 of 26
When designing a material to test acoustic streaming, we considered
tissue-1
mimicking phantoms often used for ultrasound imaging or therapy studies (Culjat et al.
2
2010). However, although these materials mimicked the acoustic properties well, they did
3
not necessarily mimic the fluid microenvironment that would be present in soft tissue.
4
Scanning electron microscopy was used to image the pores that remain following freeze
5
drying of the gels, to estimate the gel network and fluid pathways of the hydrated gel. The
6
SEM images showed that while the gelatin and polyacrylamide networks were porous,
7
the pores were not well connected so fluid transport was likely to be hampered by walls
8
of material [Fig. 2(a) and 2(b)]. For gelatin, polyacrylamide and MPPa, MIP showed that
9
the size of interconnecting pores were 0.22 0.11 μm, 0.21 0.14 μm and 33 7.7 μm,
10
respectively supporting the SEM findings. We deduced that acoustic streaming with
11
gelatin and polyacrylamide materials was unlikely to occur unless enough stress was
12
applied to break the walls. In contrast, MPPa had interconnected pores throughout the
13
gel, a feature that more accurately resembled the interstitial space of soft tissue [Fig. 2(c)].
14
Therefore, we selected MPPa to study acoustic streaming here as it can mimic both the
15
acoustic properties of tissue and the tissue microenvironment.
16
Feasibility of acoustic streaming
17
We tested ultrasound induced acoustic streaming in the MPPa by injecting a dye
18
into the hydrogel and observing any clearance once ultrasound was applied. FUS was
19
applied for 30 seconds using a range of acoustic parameters.
20
To test whether ultrasound applied in a porous material could displace fluid in the
21
MPPa gel, the transducer’s focal volume was placed at the phantom-water interface where
22
the dye was inserted, and exposed to either no ultrasound (control) or ultrasound at a high
23
intensity (fc: 5 MHz, pn: 6.2 MPa, pp: 12.0 MPa, ISPTA: 2002 W/cm2, duration: 30 s). To
24
demonstrate the axial motion of the dye, we placed the camera to image the
Page 13 of 26
elevational plane [Fig. 1(Camera View - YZ)]. When ultrasound was applied, the dye was
1
instantaneously pushed axially within the MPPa gel surface then out into the water [Fig.
2
3(a-c)]. The presence of dye movement was assessed by calculating difference images by
3
subtracting each frame by an earlier reference frame (start of sonication). To demonstrate
4
the radial motion of the dye, we placed the camera to image the lateral-elevational plane
5
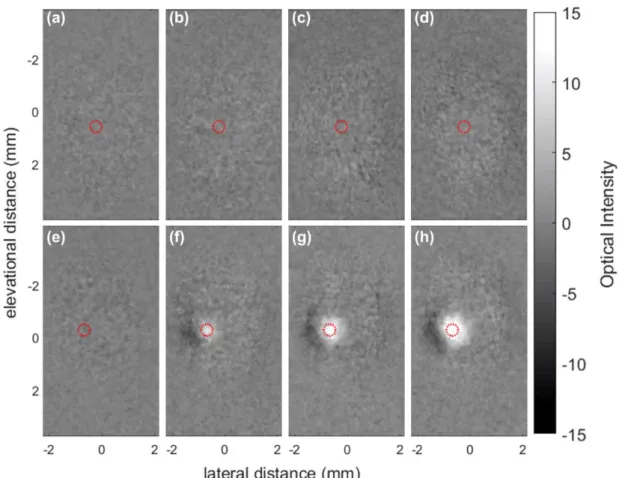
[Fig. 1(Camera View - XY)]. Without the application of ultrasound, no detectable
6
changes in contrast was observed [Fig. 4(a-d)]. However, when ultrasound was applied,
7
the dye contrast changed, indicating that the dye was acoustically displaced [Fig. 4(e-h)].
8
The dye cleared from the focal volume and was pushed radially to other regions of the
9
MPPa hydrogel. The clearance region diameter was approximately 1.5 mm at the time of
10
maximum clearance (t: 30 s) [Fig. 4(h)].
11
Assessment of the mechanical structure of the MPPa
12
To evaluate whether the acoustically-mediated fluid movement was not due to
13
mechanical damage to the tissue (e.g., cavitation, tunnelling), we compared the
14
microstructure of regions exposed to ultrasound (fc: 5 MHz, pn: 6.2 MPa, pp: 12.0 MPa,
15
ISPTA: 2002 W/cm2, duration: 30 s) with regions that were not (Fig. 5a). Based on scanning
16
electron microscopy images of the sonicated region, no difference in the mechanical
17
structure between sonicated (Fig. 5b) and unsonicated regions (Fig. 5c and d) was
18
observed.
19
Effects of ultrasound parameters on acoustic streaming
20
Lower ultrasound intensities were tested to determine how clearance depended on
21
the intensity. Three different ultrasound intensities were evaluated (fc: 5 MHz, pn: 2.6,
22
4.7, and 6.2 MPa, pp: 3.1, 7.3 and 12.0 MPa, ISPTA: 238, 972 and 2002 W/cm2) for 30 s of
23
exposure duration while dye clearance was characterised by a change in optical intensity.
Page 14 of 26
For all three intensities evaluated, average dye clearance increased with time [Fig. 6(a)].
1
The optical intensity of the clearance at time (t: 30 s) of maximum clearance for ISPTA:
2
238, 972 and 2002 W/cm2 and the unsonicated control were compared using a one-way
3
ANOVA with multiple comparison test. Only the highest exposure level was statistically
4
significant compared to the control, however the clear trend is dye clearance increasing
5
with increasing intensity [Fig. 6(b)]. The clearance rates [Fig. 6(c)] obtained from the dye
6
clearance over time [Fig. 6(b)] were shown to increase as the ultrasound intensity
7
increased. Estimated steady state velocities of the developed flow in the MPPa gel [Fig.
8
6(c)] were obtained using the model described above. The estimated average flow
9
velocity through the MPPa gel was approximately 0.05, 0.25 and 0.65 mm/s for 238, 972
10 and 2002 W/cm2, respectively. 11 12 DISCUSSION 13
The type of acoustic streaming produced was Eckart streaming (also known as
14
quartz wind), which is the steady fluid flow caused by the bulk absorption of acoustic
15
momentum. The ARF acting on the fluid pushed the fluid through the MPPa gel’s
16
interconnected network of pores. Higher ultrasound intensities increased the applied ARF
17
(Nyborg 1965), which resulted in higher streaming velocities. From the raw videos, the
18
observed streaming direction is both axial (dye leaving the MPPa gel was observed) and
19
radial. Although the ARF is applied axially in the direction of wave propagation, some
20
dye moved radially due to the structure of the gel, where the channels are interconnected
21
in all directions. Moreover, the generated streaming is confined to the area around the
22
ultrasound beam, thus demonstrating a localised effect.
Page 15 of 26
We confirmed that the dye clearance was caused by acoustic streaming, by
1
excluding the possibility of thermal or mechanical damage to the material. First, the net
2
dye displacement was produced in the axial and radial directions. In contrast, dye
3
movement caused by heat or Fickian diffusion is a slow process (Cussler 2009) and
4
would be generated in all directions. Spherical diffusion with a maximum concentration
5
of dye at the centre and decreasing with distance was not observed in our study. The
6
modelled average velocity was proportional with the dye clearance rate as they both
7
increased with increasing ultrasound intensity. We used the clearance to relate acoustic
8
streaming through the gel based on the assumption that a larger clearance area over time
9
implies implied that a fluid of higher speed is moving through the gel. Second, the melting
10
point of our MPPa gel is greater than 200°C, which was well above the temperature rise
11
that we could induce with our ultrasound parameters. Third, no detectable changes in the
12
microstructure of the MPPa gel was observed, indicating that cavitation-mediated
13
mechanical damage, such as tunneling, was not responsible for the dye movement.
14
Fourth, the mechanical index (MI) of the lowest pressure tested that produced dye
15
clearance – MI of 1.2 – was well below the typical guidelines to avoid bubble nucleation
16
(i.e., MI of 4.0) (AIUM 2015; Church et al. 2008; Church et al. 2015). To ensure that no
17
gas bodies were present in our hydrogel, both the phantom and the experimental tanks
18
were degassed. Finally, mechanical damage to the hydrogel was not detected from our
19
SEM image analysis.
20
One of the critical aspects of our experiment was to use an appropriate material
21
for studying acoustic streaming. Current tissue substitutes used for ultrasound imaging
22
(Culjat et al. 2010) have similar acoustic properties of soft tissue, but do not resemble the
23
microstructural characteristics relevant for acoustic streaming. Although these tissue
24
substitutes contain large amounts of fluid, its fluid is confined in pockets. In many
Page 16 of 26
materials, such as healthy tissue and tissue scaffolds, fluid is interconnected. For example,
1
in healthy tissue, interstitial space resides between the blood and lymphatic system and is
2
interconnected throughout an organ, such as the brain.
3 4
CONCLUSIONS 5
The results presented here demonstrate that acoustic streaming could be directly
6
observed in a soft porous material. We have shown that this is achieved by a carefully
7
designed material resembling soft tissue and that traditional soft materials used for
8
ultrasound imaging, such as gelatin and polyacrylamide, may not appropriate for studying
9
acoustic streaming. The fluid velocities produced by acoustic streaming could be
10
controlled by adjusting the ultrasound intensity. Finally, we demonstrated that acoustic
11
streaming could be achieved without mechanical or thermal damage.
12
13
ACKNOWLEDGEMENTS 14
A.G. was supported by the Qatar Foundation Research Leadership Programme
15
(QRLP). We would like to thank Ms. Jamielyn Lau for assisting with phantom testing
16
and preparation and thank Mr. Daniel Nardini constructing the transducer holder, the
17
phantom holder, and the water tank.
18
19
REFERENCES 20
AIUM. Statement on Mammalian Biological Effects in Tissues Without Gas Bodies. Off. 21
Statements. 2015. Available from: http://www.aium.org/officialStatements/63 22
Ang ESBC, Gluncic V, Duque A, Schafer ME, Rakic P. Prenatal exposure to ultrasound waves 23
Page 17 of 26
impacts neuronal migration in mice. Proc Natl Acad Sci U S A National Academy of 1
Sciences, 2006;103:12903–10. 2
Apfel RE. Sonic effervescence: A tutorial on acoustic cavitation. J Acoust Soc Am Acoustical 3
Society of America, 1997;101:1227–1237. 4
Bjerknes V. Fields of force. New York: The Columbia university press, 1906. 5
Bystritsky A, Korb AS, Douglas PK, Cohen MS, Melega WP, Mulgaonkar AP, DeSalles A, 6
Min B-K, Yoo S-S. A review of low-intensity focused ultrasound pulsation. Brain Stimul 7
2011;4:125–136. 8
Caskey CF, Qin S, Dayton PA, Ferrara KW. Microbubble tunneling in gel phantoms. J Acoust 9
Soc Am 2009;125:EL183. 10
Church CC, Carstensen EL, Nyborg WL, Carson PL, Frizzell LA, Bailey MR. The Risk of 11
Exposure to Diagnostic Ultrasound in Postnatal Subjects. J Ultrasound Med American 12
Institute of Ultrasound in Medicine, 2008;27:565–592. 13
Church CC, Labuda C, Nightingale K. A Theoretical Study of Inertial Cavitation from Acoustic 14
Radiation Force Impulse Imaging and Implications for the Mechanical Index1. Ultrasound 15
Med Biol 2015;41:472–485. 16
Culjat MO, Goldenberg D, Tewari P, Singh RS. A review of tissue substitutes for ultrasound 17
imaging. Ultrasound Med Biol 2010;36:861–73. 18
Cussler EL. Diffusion: mass transfer in fluid systems. second ed. Cambridge University Press, 19
2009. 20
Eckart C. Vortices and Streams Caused by Sound Waves. Phys Rev American Physical Society, 21
1948;73:68–76. 22
Kamakura T, Matsuda K, Kumamoto Y, Breazeale MA. Acoustic streaming induced in focused 23
Gaussian beams. J Acoust Soc Am Acoustical Society of America, 1995;97:2740–2746. 24
Page 18 of 26
Lighthill SJ. Acoustic streaming. J Sound Vib 1978;61:391–418. 1
Nieminen HJ, Herranen T, Kananen V, Hacking SA, Salmi A, Karppinen P, Haeggstrom E. 2
Ultrasonic transport of particles into articular cartilage and subchondral bone. 2012 IEEE 3
Int Ultrason Symp IEEE, 2012. pp. 1869–1872. 4
Nieminen HJ, Ylitalo T, Suuronen J-P, Rahunen K, Salmi A, Saarakkala S, Serimaa R, 5
Hæggström E. Delivering Agents Locally into Articular Cartilage by Intense MHz 6
Ultrasound. Ultrasound Med Biol 2015;41:2259–65. 7
Nyborg WL. Acoustic Streaming due to Attenuated Plane Waves. J Acoust Soc Am 1953;25:68. 8
Nyborg WL. Acoustic Streaming. In: Mason W P., ed. Phys Acoust New York, 1965. pp. 265– 9
331. 10
Ogura M, Paliwal S, Mitragotri S. Low-frequency sonophoresis: Current status and future 11
prospects. Adv Drug Deliv Rev 2008;60:1218–1223. 12
Plieva F, Huiting X, Galaev IY, Bergenst?hl B, Mattiasson B. Macroporous elastic 13
polyacrylamide gels prepared at subzero temperatures: control of porous structure. J Mater 14
Chem Royal Society of Chemistry, 2006;16:4065. 15
Prokop AF, Vaezy S, Noble ML, Kaczkowski PJ, Martin RW, Crum LA. Polyacrylamide gel as 16
an acoustic coupling medium for focused ultrasound therapy. Ultrasound Med Biol 17
Elsevier, 2003;29:1351–1358. 18
Romano CL, Romano D, Logoluso N. Low-Intensity Pulsed Ultrasound for the Treatment of 19
Bone Delayed Union or Nonunion: A Review. Ultrasound Med Biol 2009;35:529–536. 20
Soneson JE, Ebbini ES. A User-Friendly Software Package for HIFU Simulation. AIP Conf 21
Proc American Institute of Physics, 2009;1113:165–169. 22
Speed CA. Therapeutic ultrasound in soft tissue lesions. Rheumatology (Oxford) 23
2001;40:1331–6. 24
Page 19 of 26
Starritt HC, Duck FA, Humphrey VF. An experimental investigation of streaming in pulsed 1
diagnostic ultrasound beams. Ultrasound Med Biol 1989;15:363–373. 2
Tyler WJ. Noninvasive Neuromodulation with Ultrasound? A Continuum Mechanics 3
Hypothesis. Neurosci SAGE PublicationsSage CA: Los Angeles, CA, 2011;17:25–36. 4
Westervelt PJ. The Theory of Steady Rotational Flow Generated by a Sound Field. J Acoust Soc 5
Am 1953;25:60. 6
Young SR, Dyson M. The effect of therapeutic ultrasound on angiogenesis. Ultrasound Med 7
Biol 1990;16:261–269. 8
9
Page 20 of 26 FIGURE LIST
1
2
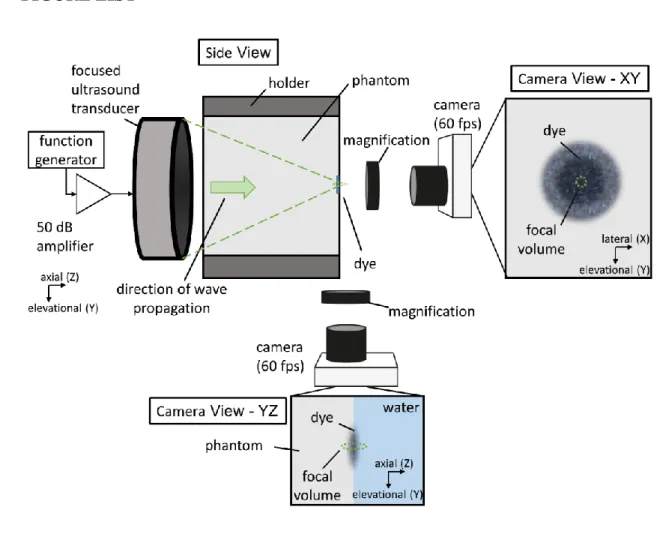
Fig. 1. Experimental setup. An MPPa gel with a localised region of a dye was immersed 3
in a water tank and sonicated by a 5-MHz focused ultrasound transducer. Ultrasound
4
pulses pushed the dye, which then cleared over time. Dye displacement was monitored
5
by a video camera. Camera View – YZ was used to image the axial displacement of the
6
dye and Camera View – XY was used to image the radial displacement.
Page 21 of 26 1
Fig. 2. Scanning electron microscopy images of three soft porous materials: (a) gelatin, 2
(b) polyacrylamide, and (c) macroporous polyacrylamide (MPPa). Zoomed in sections
3
show closed pockets or pores for gelatin and polyacrylamide. In contrast, the MPPa had
4
interconnected pores that provide a path for fluid to travel through.
5 6
Page 22 of 26 1
Fig. 3. Demonstration of axial acoustic streaming of dye. Ultrasound travelled axially, 2
which was parallel to the elevational-axial plane captured by the video camera. Images
3
acquired at 0, 0.1, and 0.2 s after the start of the sonication were subtracted from a
4
reference frame. The MPPa hydrogel was exposed to (a-c) ultrasound (fc: 5 MHz, pn: 6.2
5
MPa, pp: 12.0 MPa, ISPTA: 2002 W/cm2, duration: 30 s). The dye was instantaneously 6
pushed axially within the phantom surface then into the water, which appeared as a
7
negative change in optical intensity (grey/black). The red dashed circle is the FWHM of
8
the ultrasound focus. Black arrows denote phantom-water interface. White arrows show
9
the dye displacement.
Page 23 of 26 1
Fig. 4. Feasibility of acoustic streaming in a porous material tested by changes in dye 2
contrast. A video camera imaged the ultrasound region of exposure (Fig. 1). Ultrasound
3
travelled axially, which was perpendicular to the lateral-elevational plane captured by the
4
video camera. Images acquired at 0, 10, 20 and 30 s after the start of the sonication were
5
subtracted from a reference frame. The MPPa hydrogel was exposed to (a-d) no
6
ultrasound (control) and (e-h) ultrasound (fc: 5 MHz, pn: 6.2 MPa, pp: 12.0 MPa, ISPTA: 7
2002 W/cm2, duration: 30 s). With ultrasound, the dye was removed from the hydrogel at
8
the focus, which appeared as a positive change in optical intensity (white). The red dashed
9
circle is the FWHM of the ultrasound focus.
10 11
Page 24 of 26 1
Fig. 5. Assessment of mechanical structure of the MPPa (a, box s; b) at the ultrasound 2
focus and (a, boxes 1 and 2; c and d) away from the focus using scanning electron
3
microscopy images of these regions (b-d). Ultrasound was applied at the highest
4
ultrasound intensity evaluated in our study (fc: 5 MHz, pn: 6.2 MPa, pp: 12.0 MPa, ISPTA: 2002 5
W/cm2, duration: 30 s). No qualitative structural differences between the MPPa’s 6
microstructures of the sonicated (b) and control, unsonicated (c-d) regions were observed.
7
Page 25 of 26 1
Fig. 6. Ultrasound intensity dependent dye clearance, dye clearance rate and estimated 2
average velocities. Ultrasound at 0 (no ultrasound), 238, 972 and 2002 W/cm2 was applied
3
to the MPPa gel containing a dye. The dye clearance was measured by observing changes
4
to the optical intensity of pixels in the focal region (red dashed circle in Fig. 4). (a) The
5
dye clearance over time was observed over 30 s, revealing increased clearance over time.
6
Solid lines and shaded areas represent the average clearance and one standard deviation
7
respectively (n = 5). (b) Comparison of maximum dye clearance at 30 s for different
8
ultrasound exposure levels and the control. Measurements are presented as mean plus
9
standard deviation. (* p < 0.05, ** p < 0.01, *** p < 0.001). (c) The clearance rate and the
10
simulated average velocity through the phantom, they both increased with increasing
Page 26 of 26
ultrasound intensity. The measurements of the dye clearance rates for the different
1
ultrasound exposure levels are presented mean ± standard deviation.
2 3