i lÉ ·< Ι0 ·' яг ·«»' 'ѴМІ^’ m· ■»
mf '
P'. .4 - ¿‘1
P r i ñ : ! «
:vt M «' 'ΐίί*>' «< *'İİİM ЙГ Ú 4 ^ ' λ «I г Ц ^Sİ^’ «* ·· ''^ « it ^ '<£^ >Î^ ¿ Ш ¿ ѵ^'Д' u
'«i i¿’i Í ' ■ - » i * » ' 4» ·«. ■'іЗу д лІ,'— w'üaú* чі'«·»' » »'¿А· ÍAÍV і»
THE SHORT AND LONG TERM
PRICE PERFORMANCE
OF INITIAL PUBLIC OFFERINGS
IN ISTANBUL STOCK EXCHANGE
A THESIS
Submitted to the Faculty of Management
and the Graduate School of Business Administration
of Bilkent University
in Partial Fulfillment of the Requirements
For the Degree of
Master of Business Administration
Sevengul Karayaka
June, 1998
не
' J 8 Si
3
es
I certify that I have read this thesis and in my opinion it is fully adequate, in scope and
quality, as a thesis for the degree of Master of Business Administration.
Assoc. Prof Kursat Aydogan
I certify that I have read this thesis and in my opinion it is fully adequate, in scope and
quality, as a thesis for the degree of Master of Business Administration.
Assoc. Prof Gulnur Muradoglu
I certify that I have read this thesis and in my opinion it is folly adequate, in scope and
quality, as a thesis for the degree of Master of Business Administration.
Assistant Prof Aslihan Salih
4 ^ .
THE SHORT AND LONG TERM PRICE PERFORMANCE OF INITIAL PUBLIC OFFERINGS IN ISTANBUL STOCK EXCHANGE
SEVENGUL KARA YAKA
M.B.A THESIS
Supervisor; Assoc. Prof. Kursat Aydogan
The present study aims at investigating the price performance of IPO’s in the Istanbul Stock Exchange (ISE) during the 1990-95 period in the short term and long term. The study is also devoted to the procedures for an Initial Public Offerings (IPO) and the existing regulatory environment. The existence of significant abnormal positive returns of new issues on the first day of trading is the proof of underpricing hence investors taking a position in IPO’s during the offering date can enjoy short term return relative to the market. However, on the average, cumulative abnormal returns do not exhibit any significant long term anomaly measured over 750 trading days.
ABSTRACT
Key words; Initial Public Offerings (IPO), underpricing
ÖZET
İSTANBUL MENKUL KIYMETLER BORSA’SINDA HALKA AÇILAN ŞİRKETLERİN KISA VE UZUN DÖNEMDE FİYAT PERFORMANSLARI
SEVENGÜL KARAYAKA
M.B.A TEZİ
Tez Yöneticisi: Doç. Dr. Kürşat Aydoğan
Bu çalışmanın amacı, 1990-95 yılları arasında İstanbul Menkul Kıymetler
Borsa’sında (İMKB) halka açılan şirketlerin kısa ve uzun dönemde fiyat
davranışlarını incelemektir. Ayrıca halka arz prosedürleri ve mevcut yasal düzenlemeler de bu çalışmada incelenmiştir. Yeni hisse senetlerinin ilk işlem günündeki normalin üzerindeki pozitif getirilerinin varlığı düşük fiyatlandırmanın kanıtıdır. Böylece, halka arz sırasında pozisyon alan yatırımcılar ilk gün piyasaya göre daha yüksek getiriler elde ederler. Fakat, 750 günlük birikmiş getirileri incelediğinde herhangi bir normalin üzerinde getiriye rastlanmamıştır.
TABLE OF CONTENTS
ABSTRACT ... j ÖZET ... ii TABLE OF CONTENTS ... jjj LIST OF TABLES V I. INTRODUCTION 1 II. IPOANDISE 4 III. PROCEDURES FOR AN IPO IN TURKEY ...6III.I Initiation Process 6 111.1.1 Valuation Report ...6
111.1.2 Pricing 7 111.1.3 Timing 7 111.1.4 Undenrt/riting versus Best Efforts Alternatives 7 111.11 Alternative Methods Employed in IPO ... 9
111.11.1 Offering Through Sale of Existing Shares ...9
111.11.2 Offering Through Sale of Newly Issued Capital ... 10
III.Ill Application to CMB ...11
III.IV Registration of shares with the CMB ...11
III.IV.1 Registration with the CMB ...11
III.IV.2 Filling Memorandum ...12
III.IV.3 Offering Circular 12 III.IV.4 Collection of Bids 12 III.IV.5 Regulations Pertaining to Promotion and Advertising ... 12
III.V Methods of Sale ...13
III.V.1 Collection of Bids ...13
III.V. 1.1 Fixed-Price Offering ...13
III.V.1.2 Book Building Method ...14
III.V.2 Sale Through the Stock Exchange ... 15
III.VI Application for Listing and Trading on the ISE ... 16
III.VII ISE Disclosure Requirements ...16
III.VIII Timing ...16
IV. LITERATURE SURVEY 17 V. DATA AND METHODOLOGY ... 25
V.l Data 25 V.ll Methodology 27 VI. RESULTS 30 VII. CONCLUSION 39
REFERENCES
42
APPENDIX
44
LIST OF TABLES
Table 1 The Quoted Companies in the ISE during the 1991-1997 period ... ... 5
Table 2 The Approximate Time Needed to Complete the Stages of IPO ...
Process
... 16
Table 3 The Summary of Emprical Studies About IPO’s Reported Short ...
and Long term Anomalies
... 17
Table 4 The Summary of IPO’s in the Sample ... ... 25
Table 5 Cumulative Abnormal Returns for IPO’s in the Present Study ... 30
Table 6 Cumulative Abnormal Returns for Private and Public ...
Companies
... 31
Table 7 Cumulative Abnormal Returns for IPO’s Grouped According ...
Year of Issuance
... 33
Table 8 Cumulative Abnormal Returns for IPO’s Grouped According to ...
the Type of Offering Method
... 36
Table 9 Cumulative Abnormal Returns for IPO’s Grouped According to ...
the Percentage of the Shares Offered to the Public
... 37
I.INTRODUCTION
The underpricing of initial public offerings are well documented aspect in finance literature and several empirical studies examining the price behavior of Initial Public Offerings (IPO’s) have been done over the past three decades. Early IPO studies primarily describe and develop the price behavior of new issue’s without analyzing the reason of pattern of IPO’s performance. The anomalies found by early empirical studies are not easily explainable using the existing theories at that time. These early findings stimulated the writing of theoretical papers attempting to explain the reasons of underpricing of IPO’s and to test the models empirically.
The empirical evidence accumulated during recent years for almost every capital market in the world indicates that IPO’s provide significant abnormal returns on their first day of trading. While there is a considerable debate concerning the underlying rationale of such returns, the literature is almost unanimous its conclusion that their presence constitutes evidence of deliberate underpricing. In addition to the short run underpricing phenomenon, numerous studies have documented another anomaly that significant short-term returns often evaporate over time. Moreover, modern theories of IPO pricing offer various explanations for underpricing and these explanations arise from important informational asymmetries betw'een market participants.
By far, the empirical studies in literature covered the short-run and long-run performance of IPO’s, the reasons of the underpricing of new issues, underwriter price support, underwriter reputation and its impact on the pricing of new issues, the choice of the offering method in IPO’s and the firm value.
In the light of the available finance literature, the present empirical study insights into underpricing mystery of IPO’s but does not solve it. The present study aims at investigating the return characteristics of IPO’s in the Turkish Stock Market in the short term and long term. One objective is to measure the initial performance in the
first day following the offer. Furthermore, IPO’s performance in the secondary
market is observed. Accordingly, the present study focuses on determining the short-term and long-term anomalies of IPO’s in Istanbul Stock Exchange (ISE) in the days and years following the offer.
In the short term, underpricing of IPO’s of common stock are investigated and we determine whether the new issues are underpriced or overpriced. In the longer term the speed of market adjustment to mispricing is analyzed. Such anomalies are inconsistent with efficient markets and with effective information processing by undenfl/riters and buyers of new issues. If such anomalies were the sign of inefficiency, we would expect stronger anomalies in this study since the Turkish market is not efficient.
On the other hand, the documented studies in finance literature are generally conducted on the institutional and legal framework of developed capital markets, mostly US. The pricing behavior of IPO’s in an emerging market with different institutional arrangements can be different from its pattern in developed markets. Hence, our empirical study also provides an opportunity to decide whether or not institutional and legal framework are responsible for the behavior of IPO’s.
We examine the daily abnormal returns of 87 IPO’s in the Turkish Stock Market during the period 1990-95. Results indicate that they are generally underpriced on the first day of trading. However, on the average, cumulative abnormal returns do
not exhibit any significant long term anomaly measured over 750 trading days. The only significant anomaly found in that part of the study was the first day abnormal return.
Furthermore, IPO’s are grouped according to the types of companies including private versus public, the year of issuance, the offering method and the percentage of the shares offered to the public in order to determine the underlying reasons for abnormal returns. Though some segmentation used in this study exhibit a relation with the underpricing and the performance of IPO’s, the results suggest that institutional and legal arrangements are more likely to explain such phenomenon.
The paper is organized as follows. The following chapter presents the definition of IPO and the recent developments In the ISE. Chapter 3 is devoted to review the procedures required for a company to be taken public and the role assumed in this process by the intermediary financial Institution. The documented studies in finance literature is presented in Chapter 4. In Chapter 5, data and methodology of the present study are discussed. The results of the study and concluding comments constitute Chapter 6 and the last chapter respectively.
The first public equity issue that is made by a company is referred to as an initial public offering (IPO). The main driving factor behind the companies’ decision to go public is to strengthen financial base and to be protected from undesired economic conditions. When growth can no longer be financed internally or through borrowing,
the companies will consider a public offering. The company aims to obtain
additional funds through public offerings for the new investments, increasing
business volume and paying down debt. The equity capital generated by an IPO improves the debt-equity ratio and enhances the company’s cash position. Thus, companies provide a feasible and rational combination of debt and equity .
Financial Liberalization during 1980's have promoted the development capital
markets in Turkey. Development of equity markets have been taken into
consideration in the process of promoting capital markets. Increasing interest for equity markets gave rise to an improvement in the primary markets. Hence it leads to the increasing tendency of the corporations to make new issue public offerings as well as issue offerings of existing shares.
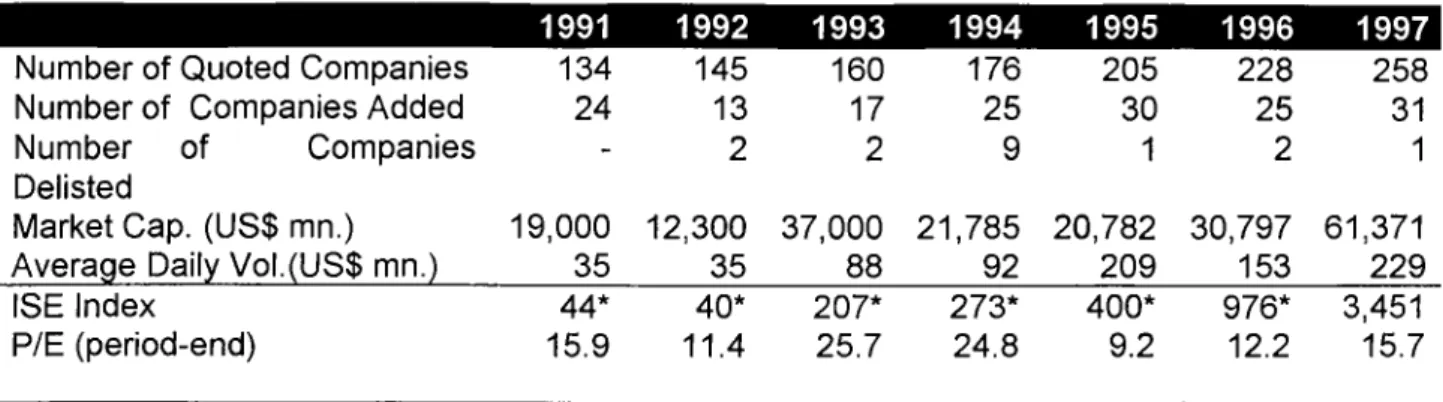
The Istanbul Stock Exchange was established in 1985. Public offerings of common stock were largely introduced in 1990 and continued upto now. During the period of 1986-1997, the market capitalization of the ISE grew from US$ 938 million to US$ 61 billion, nearly 65-fold in US$ terms. The increase in trade volume was even more striking. Between 1986-1997, the annual trade volume rose from US$ 13 million to US$ 58 billion, a 4.5 thousand-fold increase. As seen in Table 1, the average daily trade volume in 1997 was US$ 229 million, representing a 50% increase compared to the previous year.
II. INITIAL PUBLIC OFFERING AND ISTANBUL STOCK EXCHANGE
Table 1; The Quoted Companies in the ISE during the 1991-1997 period
1991 1992 1993 1994 1995 1996 1997
Number of Quoted Companies 134 145 160 176 205 228 258
Number of Companies Added 24 13 17 25 30 25 31
Number of Companies
Delisted
- 2 2 9 1 2 1
Market Cap. (US$ mn.) 19,000 12,300 37,000 21,785 20,782 30,797 61,371
Average Daily Vol.(US$ mn.) 35 35 88 92 209 153 229
ISE Index 44* 40* 207* 273* 400* 976* 3,451
P/E (period-end) 15.9 11.4 25.7 24.8 9.2 12.2 15.7
‘ Adjusted for the dropping of two digits from the index in 1997
As of 31 December 1997, the number of companies listed on the ISE reached 258, up from 80 companies in 1986. As seen in Table 1, in 1997, 31 companies went public compared to 25 in 1996. In 1996, due to an unfavorable economic and political climate, the number of IPO’s could not surpass that in 1995 and 1997. Moreover, a significant number of IPO’s is in the pipeline for 1998 if an unfavorable economic and political climate does not exist during the 1998 period.
The highest market P/E ratio at the Istanbul Stock Exchange was recorded in August 1990 with 30.7, just before the Gulf Crisis. As of December 31, 1997, the average market P/E was 15.7 based on ‘97 year-end profits.
The Capital Markets Law has several clauses forbidding insider trading, price manipulation, self-dealing, and non-reporting of material corporate events. The regulation of the equity market is the duty of the Capital Markets Board, a state agency, which has the authority to issue circulars regarding interpretation of the relevant clauses of the Capital Markets Law, and to penalize and suspend members and listed companies for violations of rules.
The purpose of the section is to review the procedures required for a company to be taken public and for its shares to be traded on the Istanbul Stock Exchange and the role assumed in this process by the intermediary financial institution. The public offering of a company's equity should be thought of in a broad sense. The relevant regulatory framework as well as all activities related to the written and oral solicitation of investors should be viewed as part of the public offering process.
III. I Initiation of the Public Offering Process, Valuation of Company’s Shares, and Strategy Formulation
The process is initiated by the company's decision to go public. The company then contacts an "investment banker" in order to discuss the timing and conditions of the offering. If an agreement is reached between the two parties, an "underwriting agreement" is signed.
III.I.1 Valuation Report
The intermediary institution prepares a valuation report which estimates the value of the company's shares. The content of the valuation report is prescribed in detail by the Capital Market Board ("CMB"). The scope of the report is held broad and features the following main items.
• General structure of the firm and description of the firm's activities (capital structure, production, sales, organization, personnel, facilities, participation’s, etc.)
• Sector review (cost structure, pricing, competition, local and export markets, significant developments in the sector, etc.)
III. PROCEDURES FOR AN INITIAL PUBLIC OFFERING IN TURKEY
• Analysis and projection of demand for the sector and for the company (going forward 5 to 10 years)
• Financial analysis of the firm (review of historical financial statements, financial ratios, comparison with sector)
• Projection of financial statements (forecast of balance sheet and income
statement over the next 5 to 10 years)
• Valuation: the fair value of the company's shares is determined in this section based on the discounted cash flow method and on trading multiples. To the extent possible, prices of similar companies trading on the Stock Exchange are used as a basis for the valuation, in order to reflect current market conditions.
111.1.2 Pricing
This is one of the most important factors that the company must focus on in an initial public offering. While it is difficult for a "good" price to enable the sale of a "bad" firm, it is often the case that a "bad" price disables the sale of a "good" firm. A firm may have various objectives in going public in addition to that of simply maximizing the proceeds of the equity sale. Such objectives may include enhancing prestige, spreading risk, and establishing liquidity in the company's shares.
111.1.3 Timing
The success of a public offering is significantly affected by the timing of the sale. It is difficult for the offering to succeed when trading volume in the market has shrunk. The regulations governing the process of a public offering allow some flexibility with regards to the timing of the sale. For example, if market conditions are not favorable at the time at which the shares are registered with the Capital Market Board, the sale may be delayed for a reasonable time period.
111.1.3 strategy Formulation
Prior to being traded in the secondary market, the shares must be offered for sale either at appropriate outlets or directly at the primary market of the Istanbul Stock Exchange. Depending on the offering price and on the conditions prevailing in the market, the intermediary financial institution will make a suggestion as to which alternative should be preferred.
111.1.4 The "Underwriting" versus "Best Efforts" Alternatives
Until recently, the role of the intermediary institution in a public offering was limited to selling the shares being offered on a best efforts basis.
According to Capital Market Board Decree (Series I, No.22), however, the intermediary institution is required to underwrite the shares being offered if the IPO takes place through the sale of the existing shares of the current owners or the sale of shares newly issued through a capital increase (not only if the company is in the registered capital system). The underwriting of shares by the intermediary institution means that it commits to selling the shares being underwritten and to buy those shares it is unable to sell at the agreed price.
In the "best efforts" alternative, the intermediary institution collects a sales commission on those shares that it is able to sell and returns the rest of the shares. In the "underwriting" alternative, the intermediary institution earns an underwriting commission on those shares which it commits to sell in addition to the sales commission.
111.11. Alternative Methods Employed in a Public Offering
A company that wishes to go public can employ one of two alternative methods. The first method is for the present owners to sell their existing shares. The second method is for the company to increase its nominal capital and to subsequently sell the newly issued shares to the public.
111.11. 1 Offering Through Sale of Existing Shares
The following conditions are required for the company to carry out its IPO through this method.
1. The nominal value of the shares to be issued must be no less than
-15% of the total nominal equity capital of the firm for companies with total nominal equity capital less than 250 billion TL,
-10% of the total nominal equity capital of the firm for companies with total
nominal equity capital between 250 billion TL and 500 billion TL,
-5% of the total nominal equity capital of the firm for companies with total nominal equity capital more than 500 billion TL,
2. If the shares being issued belong to a certain group or tranche, then all of the shares pertaining to that group or tranche must be paid in. Otherwise, the entire equity capital of the firm must be paid in.
3. The transfer and circulation of the shares being issued must not be subject to any restrictions, such as their being held as collateral to financial obligations. 4. The physical certificates pertaining to the shares must be printed in compliance
with the requirements mandated by the Capital Market Board Decree Series I, No. 5.
Public offerings of this kind are regulated by the Capital Market Board Decree Series I, No. 22.
III.II. 2 Offering Through Sale of Newly Issued Capital
In this method, the company increases its nominal capital and the shareholders forego their preemptive rights arising from this capital increase. The newly issued shares, which are not claimed by the existing shareholders, are then offered to the public.
Since this method ensures that the proceeds of the offering flow directly to the
company, it enhances the capital structure of the firm. From an accounting
standpoint, that part of the proceeds which corresponds to the nominal value of the shares being issued is added to the paid-in capital. The remaining part of the proceeds, corresponding to the difference between the sale price and the nominal price of the shares being issued, is added to shareholder equity in the "capital surplus" account and may be subsequently distributed to shareholders through the distribution of bonus shares (effectively a stock-split).
For a public offering to be carried out through this method, the company can operate under the "registered capital" or “regular capital” system. Under the registered capital system, a company may increase its equity capital without being subject to the requirements of the Turkish Trade Law, provided that the capital remains less than or equal to the company's "registered capital ceiling." This allows the physical certificates to be printed prior to the selling process. The ISE requires that only the physical certificates are traded. A company that operates under the registered capital system can have the physical certificates printed before the IPO,
hence the shares of the company can start trading earlier compared to one which does not operate under the registered capital system. The requirements for operating under the registered capital system are given by the CMB Decree Series I, No.22.
Ill.lll. Application to the Capital Market Board
The application to the CMB is carried out by the intermediary institution if the offering is to take place through the sale of existing shares and by the company itself if the offering is to take place through the issuance of new equity capital.
The CMB reviews and reaches a decision on the application within 30 days, excluding the time required for the company to provide any information that may be missing in the application or additionally required by the Board. If the application is accepted, the shares are registered with the CMB. In reviewing the application, the CMB examines whether the offering circular and the sample physical certificates are in compliance with relevant regulations.
III.IV Registration Of Shares with the Capital Market
III.IV.1 Registration with the CMB
For the shares to be registered with the CMB, a registration fee in the amount of 0.2 % of the total amount (total number of issued shares times issue price) must be deposited at the CMB's account with the Central Bank of Turkey.
Within 15 days after the registration of the shares with the CMB, the filing memorandum ("izahname" in Turkish) approved by the CMB must be registered at the Commercial Registry and published in the Commercial Register Newspaper.
III.IV.3 Offering Circular
For public offerings, the "offering circular" must be announced in at least two
nationwide newspapers within 1 week after the publication of the filing
memorandum.
III.IV.4 Collection of Bids
The period allocated for the collection of bids starts at least 3 days and at most 5 days after the announcement of the offering circular. The period lasts at least 2 business days.
III.IV.5 Regulations Pertaining to Promotion and Advertising
All promotion and advertising materials relating to the offering must be submitted to the review of the CMB at least 2 days before their publishing or broadcast. (This is regulated by the CMB Decree Series VIII, No. 22.)
III.IV.2 Filing Memorandum
Regulations pertaining to the methods of sale that may be employed in a public offering have been reconstituted by the CMB and published in the Official Gazette on October 27, 1993.
Accordingly, non-public firms may offer their shares to the public through one of the following two methods of sale.
1. Collection of bids
2. Sale through the Stock Exchange
III.V. 1. Collection Of Bids
The collection of bids may be conducted either through a "fixed-price offering" or through the "book building" method.
III.V. 1.1 Fixed-Price Offering
If public offerings carried out through this method of sale, a fixed share price is determined. Investors fill in and sign the bid forms and submit them to the intermediary institution during the period designated in the offering circular. When the bid form is submitted, the investor must deposit the amount corresponding to the shares to the designated account in the intermediary institution.
At the end of the bid collection period, the allocation of shares among investors is
The total amount of shares to be offered is divided by the number of investors and the request of each investor up to the resulting amount is met. The remaining amount of shares is then divided by the number of investors whose requests have not yet been fully met. This allocation process is continued until the entire amount of shares has been allocated. The allocation of each investor is then reviewed in light of his/her minimum requirement and those allocations that fall short of the investor's minimum requirement are removed from the list. The shares removed from the allocation are reallocated through the same procedure described above.
III.V. 1. 2 Book Building Method
A minimum price is determined for the shares and bids above this minimum price are collected. As in the fixed price method, investors submit the bid forms and deposit the corresponding amount at the intermediary institution.
At the end of the bid collection period, the allocation of shares is conducted as follows.
Starting from the highest-price bid, the bids are transformed into a table showing cumulative bid amounts at each price level. The price level at which the cumulative amount exceeds the amount of shares offered is fixed as the selling price. All bids above that price are met. The remaining shares are allocated among the bids at the level of the fixed price proportionally with the amount of such bids.
In either bid collection scheme, the intermediary institutions submit to the company going public a list of the allocation of shares among investors within two business days after the end of the bid collection period.
The company then approves the allocation list and returns it to the intermediary institution within two business days. The list of bids that are not met are announced by the branches of the intermediary institution and the corresponding amounts are returned immediately to investors. Also, the shares pertaining to bids that have been met are released to investors.
III.V. 2. Sale Through The Stock Exchange
The public offering of capital markets instruments may be carried out on the Stock Exchange within the regulatory framework of the ISE following approval by the CMB. The sale can be made through the Exchange by applying to the ISE along with the required documents at least 20 days prior to the offering. The Board of Directors of the ISE must then approve and announce the offering.
The sale is conducted in the primary market of the ISE single-handedly by a designated intermediary institution. Those investors who buy the shares in the primary market must wait until the shares trade in the secondary market in order to sell their shares. The price designated at the time of registration with the CMB is set as the opening price. From then on, the price of the shares moves within the band determined by the daily limits set by the ISE.
III.VI. Application for Listing and Trading on the ISE
The ISE board of Directors meets once a week on Tuesdays. The application file must be filed with the ISE administration at least one week prior to the Board of Directors (BOD) meeting for the application to be considered. Provided that these
requirements are satisfied, a decision regarding listing and trading in an unseasoned equity will be made by the BOD in the first week after the passage of 2 days pursuant the filing of the application.
III.VII. ISE Disclosure Requirements
Companies, the equity shares of which are traded on the ISE, must prepare annual financial statements, have these audited by authorized independent auditors and announce the results publicly. The disclosure requirement ought to be kept in mind carefully in the decision to go public.
III.VIII. Timing
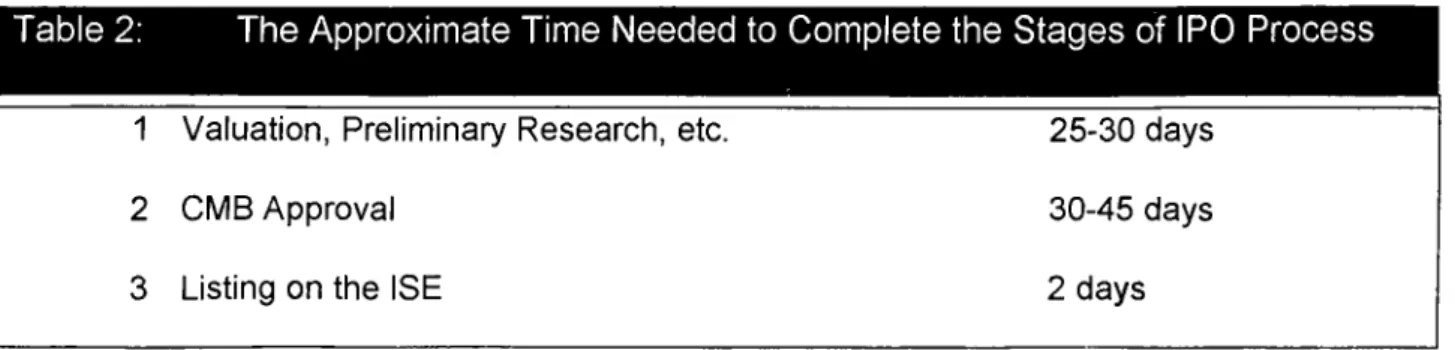
The significant stages in the process of taking a company public and the approximate time needed to complete these stages is given below. The entire process takes approximately two-and-a half months.
Table 2:
The Approximate Time Needed to Complete the Stages of IPO Process
1 Valuation, Preliminary Research, etc. 2 CMB Approval
3 Listing on the ISE
25-30 days 30-45 days 2 days
IV.LITERATURE SURVEY
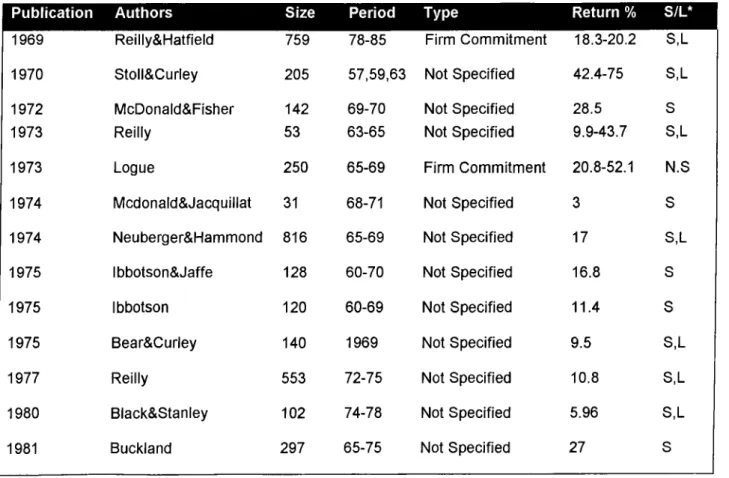
The underpricing of initial public offerings are well documented aspect in finance literature and several empirical studies examining the price behavior of IPO’s have been done over the past three decades as seen in tables below. Early IPO studies primarily describe and develop the price behavior of new issue’s without analyzing the reason of pattern of IPO’s performance. Because the anomalies found by early empirical studies are a puzzle which are not easily explainable using theories at that time. The most striking empirical findings obtained by early IPO studies is a consistent pattern of excess returns on the first day of trading which evaporate over time. Parallel with the development in modern theories, these early findings stimulated the writing of theoretical papers attempting to explain the reasons of underpricing of new issues and to test the models empirically.
Table 3: The Summary of Empirical Studies About IPO’s Reported Short and Long term Anomalies
I Publication Authors Size Period Type Return % S/L*
1969 Reilly&Hatfield 759 78-85 Firm Commitment 18.3-20.2 S,L 1970 Stoll&Curley 205 57,59,63 Not Specified 42.4-75 S,L 1972 McDonald&Fisher 142 69-70 Not Specified 28.5 S
1973 Reilly 53 63-65 Not Specified 9.9-43.7 S,L
1973 Logue 250 65-69 Firm Commitment 20.8-52.1 N.S
1974 Mcdonald&Jacquillat 31 68-71 Not Specified 3 S 1974 Neuberger&Hammond 816 65-69 Not Specified 17 S,L
1975 Ibbotson&Jaffe 128 60-70 Not Specified 16.8 S
1975 Ibbotson 120 60-69 Not Specified 11.4 S
1975 Bear&Curley 140 1969 Not Specified 9.5 S,L
1977 Reilly 553 72-75 Not Specified 10.8 S,L
1980 Black&Stanley 102 74-78 Not Specified 5.96 S,L
Publication Authors 1983 Neuberger&LaChapell 118 75-80 1983 Peavy 41 85-87 1984 Ritter 1028 77-82 1987 Chalk&Peavy 649 75-82 1987 Jog&Riding 100 71-83 1987 Miller&Reilly 510 82-83 1988 Balvers 1182 81-85 1988 Johnson&Miller 502 81-83 1988 Tinic 204 23-71 1988 Ibbotson,Sindelar,Ritter 8,668 60-87 1989 Muscarella& Vetsuypen 38 70-87 1989 Koh&Walter 66 73-87 1989 Anderson&Born 35 86-87 1989 Weiss 64 85-87 1990 Aggarwal&Rivoli 1598 77-87 1990 Carter&Manasters 501 79-83 1991 Aggarwal&Rivoli 1556-196 77-87 1991 Anderson&Beard 43 70-87 1991 Megginson&Weiss 640 83-87 1991 Ritter 1526 75-84 1992 Anderson&Born 30 86-89 1992 ChO 717 75-84 1992 Manuer&Senbet 1002 77-84 1993 Drake&Vetsuypens 93 69-90 1993 Levis 712 80-88 1993 Barry&Jennings 229 88-90 993 Aggarwal,Leal, Hernandez 142 80-90 1993 Affleck-Graves 1127 83-87 Return % Not Specified 8.3-73.5 S,L Firm Commitment Neg S,L Not Specified 16.3-48.4 S Best Effort 19.6-37.8 S,L Not Specified 9-11.5 S Not Specified 9.9 S Firm Commitment 7.84 S Firm Commitment 11.2-14 S Not Specified 14.3-17 S,L Not Specified 16.4 S Best Effort 7.12 S Not Specified 11.2-14 S Firm Commitment Neg S,L Firm Commitment 0 S,L Firm Commitment 10.7 S,L Firm Commitment 13.1-19.6 S,L F.C&B.E 9.9-51.7 S Firm Commitment Neg S,L Firm Commitment 7.1-11.9 S Not Specified 14.3-17 S,L Firm Commitment Neg S,L Best Effort 42.3 S Firm Commitment 18.9 S Not Specified 9.18 S,L F.C&B.E 14.3 S,L Firm Commitment 6.1 S Not Specified 2.8-78.5 S,L Firm Commitment 4.8-10.4 S IPO’s in ISE 18
*: S: The studies cover the short-run performance of IPO’s L: The studies cover the long-run performance of IPO’s
By far. the empirical studies in literature covered the short-run and long-run performance of IPO’s, the reasons of the underpricing of new issues, unden/vriter price support, underwriter reputation and its impact on the pricing of new issues, the choice of the offering method in IPO’s and the firm value.
In this chapter, we present a brief summary of the most relevant research for the present empirical study. First, we summarize descriptive studies and describe their initial conclusions. Then, we summarize and analyze various economic models offered to explain IPO pricing behavior.
The most relevant research for the present empirical study is the research done by Aydogan (1993). The study is examined the performance of initial public offerings in the Turkish market. The examination of IPO’s during 1990-91 in the Turkish market showed that, on the average, IPO’s were not underpriced and any significant pattern in the long term in a way that better or worse than the average stock in the market was not observed.
Many empirical studies built on the framework of developed capital markets document positive initial returns and negative long-run returns such as Aggarwal&Rivoli (1990), Ritter (1991), Levis(1993), Aggarwal, Lealand and Hernadez(1993).
Aggarwal and Rivoli (1990) employ a sample of 1598 offerings over the 1977- 1987 period to investigate whether the price behavior of IPO’s is consistent with the
that prices decline significantly in the year following the initial offering. The phenomenon holds in groupings based on size, offering price, year and underwriter class. They conclude that their findings are supportive of IPO’s being subject to overvaluation or fads in early aftermarket trading.
Ritter (1991) employs a sample of 1526 IPO’s in 1975-1984. Using a 36 month time frame, he reports that IPO’s, on average, exhibit positive returns during the first two months, but returns become negative in the months that follow. Ritter has shown that in the long run, unseasoned issues performed well below average. Three years after initial offering, average return of IPO’s was only half of a matched sample of other stocks
Levis (1993) utilizes 712 IPO’s in the United Kingdom over the 1980-1988 period. He reports an average first-day return of 14.3%. The study also shows that these IPO’s underperform other benchmarks in the three years following the initial public offering.
Aggarwal, Leal and Hernandez (1993) examine a total of 142 IPO’s in Brazil, Chile and Mexico over the 1980-1990 period. The empirical study reports short-term returns of 78.5%, 16.7% and 2.8% respectively. Long-run returns are reported to be negative which is consistent with long-run IPO price behavior in the United States.
The empirical analyses summarized above point to several well-established facts about the characteristics of initial public offerings of stocks in the U.S and other countries. While some of these facts are unsurprising, several features of IPO performance require some explanation.
The literature abounds with a variety of situations that explains the observed underpricing in the initial public offering of common stock. However, with only a few exceptions, many of these theories can be rejected from certain points. They either lack a sound theoretical foundation or refuted by the evidence.
Developments in game theory, financial economics and information theory all contributed to the theoretical analyses of IPO’s observed since the early 1980s. The modern approach pays great attention to describing the informational environment in which economic actors make transactions. Since an IPO involves four relevant groups of actors: The issuing firm, the underwriting/distribution syndicate, the initial buyers and the larger set of investors in the secondary market. The information known to these various groups is critical.
Although agents can have different information without any agent having unambiguously superior information, most models of IPO pricing typically assume one group has superior information on the firm value. Other agents know this and behave accordingly. The most widely discussed theories of underpricing of IPO differ in their assumptions about which actors have superior information.
Perhaps the best known and most studied explanation of IPO underpricing is the
adverse selection mechanism first proposed by Rock(1986), and analyzed by
Beatty and Ritter(1986), Carter and Mananster(1990), Koh and Walter(1989), and Mcstay(1992).
Rock(1986) developed a theoretically consistent model of underpricing based on two primary assumptions: potential investors are differentially informed about the
information on the issuing firm’s prospects. In this formulation, the existence of investors with superior information about the issue value places uninformed investors at a disadvantage. Uninformed investors face competition for good shares, but have a higher probability of obtaining bad shares due to the rationing
mechanism applied to oversubscribed offerings. To induce the uninformed to
participate in the IPO markets, shares must be underpriced on average.
Beatty and Ritter (1986) extend the model to show that the value of information and the bias against uninformed investors and the necessary underpricing are higher for issues for which there is greater uncertainty about their value.
Alternately, Baron (1982) applies principal-agent analysis to the IPO underpricing paradox. Unlike Rock’s model(1986), Baron(1982) assumes that the investment banker/underwriter has information superior to that of the firm. The underwriter has valuable, private information on market demand. The issuer will wish to learn this information, yet must offer an incentive to the underwriter to truthfully reveal it.
Further, the success of the offer depends not just on market conditions, but also on underwriter effort which may itself be unobserved by the issuer. In order to secure truthful private information and encourage promotion efforts, the issuer may agree to a contract that leads to underpricing.
In addition, the other well-known explanation for underpricing of unseasoned equity is relied on market power of investments bankers (Ritter(1984)). Ritter proposes that investment bankers underprice new common stocks on purpose to reduce their risks and cost of underwriting. Monopsony-Power Hypothesis, proposed by Ritter(1984), is that gross underpricing may be a result of the monopsony power of the
investment bankers in underwriting of common stocks of small speculative firms. Large and reputable investment bankers generaliy do not accept to underwrite common stocks of small and speculative firms. The IPO’s of small firms are underwritten by investment bankers who can exercise greater bargaining power over the issuers. These investment bankers intentionally underprice the securities and ration them to their large customers who regularly buy a variety of investment services from them.
Unlike the assumptions made by adverse selection modeis and principal-agent theories of underpricing, signaling models assume that the issuer has better information on security vaiue than do the undenvriters or investors. The well-known studies attempting to provide some explanations for the price behavior of IPO’s relied on the signaling models are Grinblatt and Hwang(1989), Welch (1989) and Cho(1992).
The signaling models predict that issuing firms try to signal positive information to the investor by underpricing IPO’s. Welch(1989) report that firms underprice their initial public offerings of equity so that they can subsequently issue seasoned equity at more favorable prices. A positive relation is found between underpricing of IPO’s and the probability and the size of subsequent seasoned offerings. Issuers retrieve the money they give away by benefiting from higher prices in a later, seasoned offering of additional shares.
Cho (1992) tests the signaling model of Welch in explaining best efforts IPO offerings, incorporating the possibility of failure. He concludes that the optimal offer price is determined by considering the trade-off between underpricing and the
V. DATA AND METHODOLOGY V.l DATA
Data file contains daily closing bid prices of securities trading in ISE and ISE-100 indices for each day for about 750 trading days. Daily ending bid prices of securities are adjusted for the capital increases that might have occurred in the studied time periods. Furthermore, offering prices, type of offerings, the date of first day of trading, the types of companies and the percentage of offering, the issue size are also included in data file. The data used in this study was obtained from ‘Istanbul Stock Exchange’ and ‘Capital Market Boards’. However, due to limited availability of follow up data and some misleading data for the public offerings, the sample used in this study covers just 87 initial public offerings during the period 1990-1995 instead of all IPO’s realized during the same period. Further information about the companies in the sample can be seen in Appendix.
As mentioned before, the aim of the study isto analyze the return characteristics of IPO’s in ISE and to determine whether the new issues are underpriced or overpriced. Furthermore, the study concentrates on determining whether short-term returns evaporate over time and Initial Public Offerings would be outperformed or underperformed the market in the longer term.
Table 4; The Summary of IPO’s in the Sample
All IPO’s Sample Private Public
1990 35 17 14 3 1991 24 14 6 8 1992 13 8 8 -1993 17 9 9 -1994 25 19 19 -1995 30 20 20 -Total 144 87 76 11 IPO’s in ISE 24
The sample in 1990 contained 17 IPO’s managed by 13 different leader intermediaries. Of these, 3 IPO’s were public companies whose shares are offered through the privatization program. The size of the issues and the offering prices
spanned a wide range. Issue size ranged from 375,000 shares to 75,000,000
shares and from US$ 0.7 million to US$ 345 million. The shares of the companies offered to the public spanned from 5% to 40%. The offering prices ranged from 2,500 TL (0.96 US$) to 29,000 TL (11.1 US$). Two firms in the sample issued their stocks by increasing the paid in capital and selling the new issued shares to the public, constraining their preemptive rights and the rest of the sample, fifteen companies sold the existing shares to the public.
The sample in 1991 contained 14 IPO’s, of them, 8 were state owned companies. The issue size spanned from US$ 1 million to US$ 52 million. The shares of the companies oferred to the public ranged from 2.5% to 90.9%. The offering prices were in the range of 1,000 TL (0.22 US$)to 270,000 TL (73.6 US$). Among 14 IPO’s, one firm issued its stocks by increasing the paid in capital and eleven firms sold the existing shares to the public, one firm was sold in the Istanbul Stock Exchange and one firm was established as mutual fund.
The sample in 1992 contained 8 IPO’s which were offered to the public by 7 different leader brokers. The issue size spanned from US$ 0.43 million to US$ 21.8 million. The shares of the companies offered to the public ranged from 4% to 80%. The offering prices were in the range of 1,000 TL (0.14 US$) to 10,500 TL (1.4 US$). 3 IPO’s in the sample were offered to the public by increasing the paid in capital, the rest sold the existing shares to the public.
The sample in 1993 contained 9 IPO’s managed by 7 different leader intermediaries. Issue size ranged from US$ 3.1 million to US$ 22.1 million. The shares of the companies offered to the public ranged from 15% to 33%. The offering prices ranged from 3,900 TL (0.34 US$) to 8,250 TL (0.88 US$). Of IPO’s, 4 IPO’s were offered to the public by increasing the paid in capital, the rest sold the existing shares.
The sample in 1994 contained 19 IPO’s . Of IPO’s, 5 were offered to the public by increasing the paid-in capital and selling the new issued shares to the public and the rest sold the existing shares to the public. Issue size ranged from US$ 1.9 million to US$ 34.8 million. The shares of the companies offered to the public ranged from 9.3% to 38.5%. The offering prices ranged from 4,000 TL (0.11 US$) to 65,000 TL (2.08 US$).
The sample in 1995 contained 20 IPO’s. Issue size ranged from 241 thousand to US$ 42.6 million. The offering prices ranged from 2,800 TL ( 0.07 US$) to 25,500 TL (0.60 US$). Of IPO’s in sample, 12 companies issued their stocks by increasing the paid in capital and selling the new issues, 7 companies sold the existing shares to the public.
V.ll. METHODOLOGY
The methodology used in the present study are similar to the method used by Aydogan (1993). Parallel with the study done by Aydogan, the returns are calculated for 4 intervals:
The initial return period (normally 1 day) defined the offering date to the closing price at the end of first day of trading and the after market period defined as the 1, 2 and 3 years after the IPO's exclusive of the initial return period.
The abnormal return on security i on day t (AR|,t) is defined as the difference between daily return Ri,, and the return on the market M,
ARj,t = Ri,t - Mf
The return on day t (R|,t) is the percentage change in prices between two
successive d a ys;
Rf.t - ( Pi, t "Pi ,t-i) / Pi ,1-1
where P|,t and Pi represents closing prices adjusted for stock dividends on days t
and t-1
ISE-100 index was selected as the proxy for the market. The return on the market (M t) is defined in a similar fashion as the percentage change in the levels of the ISE Composite Index in two successive days.
M, = (MİSE,-MİSE ,-i)/M IS E ,.i
If t= 0 denotes the day an initial public offering is made, the average abnormal return of n IPO's t days after the initial offer, AR, is given as
A R ,= ^ A R i,/n
1 = 1
For n securities average cumulative abnormal returns between the days ti and t2 after the initial offering , CARt is the sum of average abnormal returns over that period:
tl
CAR, = 2 ] AR,
(=il
The statistics for the average CAR's (t) are computed as
t= C A R ,/a (CAR,) (t= ti...t2)
Where a (CAR,) = a( AR,) *
Vt2 - tl
+ 1CT ( AR,) is the average variance between days t , and t2.
VI.RESULTS
Firstly, abnormal returns on the first day after issue is computed for each one of the 87 IPO’s in the sample. As seen in Table 5, on the average, first day abnormal returns is 10.4% with a t-stat of 3.15. The highest abnormal returns in belongs to Adana Çimento (A,C), whose shares are sold to the public under the privatization program. After excluding Adana Çimento (A,C), the highest abnormal return belongs to Otokar which realized an abnormal return of 32.6% on the first day. Excluding Adana Çimento ( A,C), on the average, first day abnormal returns is 6.52% with a t- stat of 5.6. Of the sample, 76% is underpriced. Average first day abnormal return of IPO’s during the 1990-95 period is statistically different from zero. Hence we conclude that IPO’s in Turkish market are underpriced.
Table 5; Cumulative Abnormal Returns for IPO’s
CAR(1) CAR(5) CAR(250) CAR(500) CAR(750)
All n 10.4% 13.2% 13.5% 17.0% 17.7%
( t-stat) 87 3.15 3.6 1.6 1.4 1.1
Notes:
CAR(1), CAR(5), CAR(250): includes the IPO made between 1990-1995 period. CAR(500): excludes the IPO’s made in 1995 due to limited availability of follow up data.
CAR(750); excludes the IPO’s made between 1994-1995 period due to limited availability of follow up data.
In order to investigate the performance of IPO’s over a longer time period, Cumulative Abnormal Returns (CAR’s) were computed for up to 750 trading days (about 3 years). Average CAR’s for 5. 250, 500 and 750 days and their t statistics are given in Table 5. All CAR’s are positive but only one CAR for 5 days is statistically significant. Though the results are not statistically significant, the positive cumulative abnormal returns denote that short term return of new issues does not evaporate over time as shown in Figure 1. Whereas, considering the results of the tests for medium and long term price behavior, it can be concluded that cumulative abnormal returns do not exhibit any long term anomaly. The only anomaly found in that part of the study is the underpricing of the new issues on the first day of the trading.
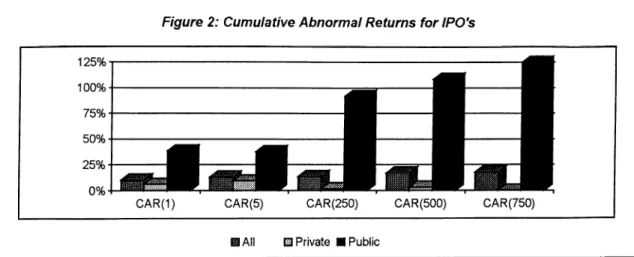
Table 6: Cumulative Abnormal Returns for Private and Public Companies
n CAR(1) CAR(5) CAR(250) CAR(500) CAR(750)
Private 76 6.4% 9.6% 2.1% 3.4% 0.5% ( t-stat) 5.3 4.7 0.3 0.3 0.0 Public 11 38.5% 37.8% 92.1% 108.8% 127.8% ( t-stat) 1.6 1.6 2.6 2.6 2.5 Public* 9 7.9% 8.7% 65.6% 83.6% 111.9% ( t-stat) 1.9 1.3 2.3 2.2 2.2
Public*: After excluding Adana (A,C )
We also investigated the impact of the type of companies on the underpricing of new issues through grouping the companies in the sample in terms of private issues versus public companies whose shares were offered through the privatization program. The average underpricing of the privatization companies is 38.5%, whereas private issues are underpriced by 6.4% on the average, as seen in Table 6. Though the result for private issues is statistically significant, the result for public issues is not statistically significant. On the other hand, after excluding Adana (A,C),
the privazation issues are underpriced by 7.9% though the result is not statistically significant.
Figure 2: Cumulative Abnormal Returns for IPO's
I All O Private ■ Public
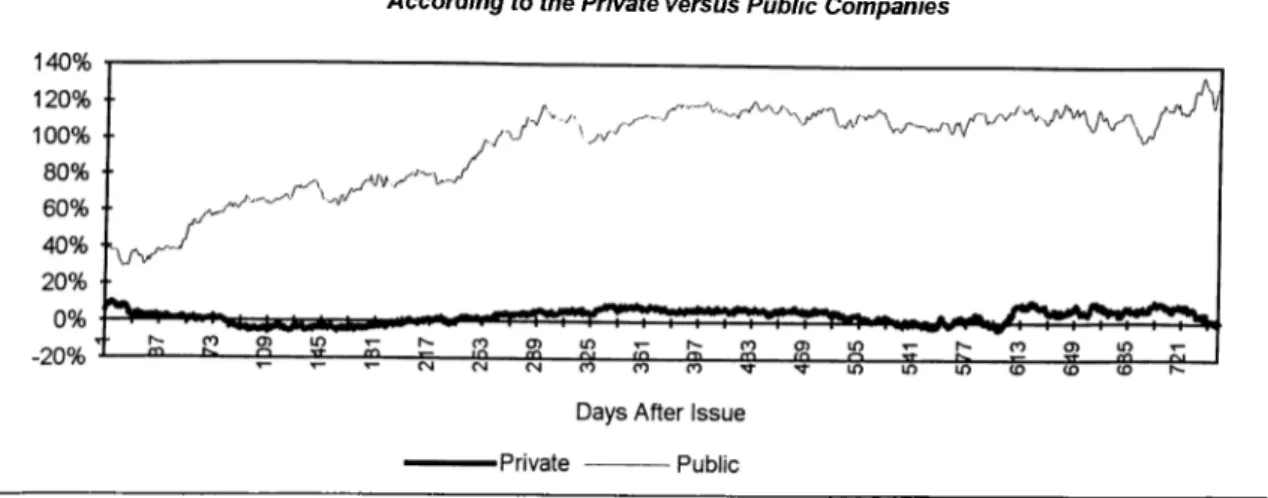
As far as the long term performance is concerned, as seen in Figure 3, state owned companies obtain statistically significant abnormal return of 127.8%, however private owned companies have cumulative abnormal return of 0.5% which is not statistically significant. Furthermore, after excluding Adana(A,C), the state owned companies still obtain statistically significant abnormal return of 111.9%.
Public Participation’s Administration (PPA), the governmental agency engaged in privatization is known to act as a market maker for stocks in its portfolio. PPA generally support IPO’s after issue due to its concern for the next public offering in the privatization program. The case may help explain why long run performance of the IPO’s of state owned companies are better than the IPO’s of private companies as shown in Figure 2. For instance, especially during the economic crisis in 1994, PPA acted as a market maker for the state owned companies. Moreover, the speculations about the further privazation programs have resulted the significant cumulative abnormal returns for the state owned companies.
Figure 3: Cumulative Abnormal Returns for IPO's Grouped According to the Private versus Public Companies
The impact of market conditions on pricing of IPO’s, as well as their long term performance are also investigated through grouping IPO’s according the year of issuance.
Table 7; Cumulative Abnormal Returns for IPO’s Grouped According Year of Issuance
1 n CAR(1) CAR(5) CAR(250) CAR(500) CAR(750)
1990 ( t-stat) 17 3.63% 1.96 6.63% 2.10 (7.39%) (0.37) (10.48%) (0.39) 0.98% 0.03 1991 14 31.59% 31.45% 69.72% 79.86% 88.21% ( t-stat) 1.65 1.61 2.39 2.19 1.94 1992 8 5.14% 11.90% (11.48%) 55.52% 10.36% ( t-stat) 2.88 2.33 (0.49) 1.40 0.20 1993 9 6.45% 27.34% 57.01% 67.41% 77.68% ( t-stat) 4.00 6.06 2.26 2.06 2.01 1994* ( t-stat) 19 5.22% 2.41 (0.75%) (0.2) (19.04%) (1.13) (20.56%) (0.88) 1995** 20 10.21% 13.24% 11.01% (2.94%) ( t-stat) 3.03 2.58 0.73 (0.15)
*: computed for up to 500 trading days due to limited availability of follov/ up data. **: computed for up to 450 trading days due to limited availability of follow up data.
The smallest first day abnormal return belongs to the IPO’s in 1990. The first day abnormal return of IPO’s in 1990 is on the average 3.6% with a t-stat of 1.96. The highest abnormal return belongs to the IPO’s in 1991 with an abnormal return of
31.6% and a t-stat of 1.65 though the result is not statistically significant. Furthermore, the first day abnormal returns of the samples during the 1992-1995 period are all statistically significant. Considering abnormal returns on the first day after issue it can be concluded that the IPO’s in ISE during 1990-1995 except 1991 are underpriced as shown in Table 7 .
Figure 4: CAR for IPO's Grouped According to the Year of Issuance
Furthermore, we analyzed long term performance of IPO’s by computing cumulative abnormal returns for up to 500 and/or 750 trading days as shown in Figure 5 and Figure 6. The highest cumulative abnormal return for 750 trading days belong to the IPO’s in 1991 with a cumulative abnormal return of 88.2% and a t-stat of 1.94 as shown in Table 7. The smallest cumulative abnormal return for 750 trading days belong to the IPO’s in 1990 with a cumulative abnormal return of 0.9% and a t-stat of 0.03 as presented in Table 7.
Figure 5: Cumulative Abnormal Returns for IPO's Grouped According to the Year o f Issuance
Though the cumulative abnormal returns of the IPO’s during the 1990-93 period for 750 trading days are positive as seen in Figure 4, the results except in 1993 are not statistically significant as presented in table 8. Hence, the study report that the long term performance of IPO’s during the 1990-92 period is not any better or worse than the average stock in the market, however, the issues in 1993 have significantly outperformed the market as seen in Figure 5.
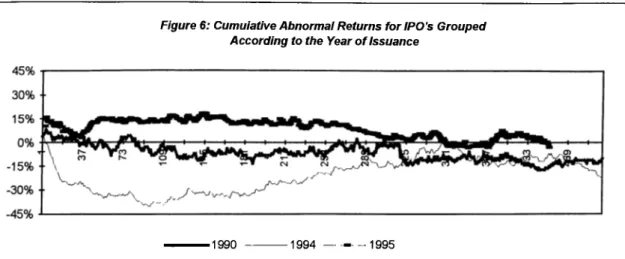
Figure 6: Cumuiative Abnormal Returns for IPO ’s Grouped According to the Year o f Issuance
-1990 -1994 — - - — 1995
The smallest cumulative abnormal return for 450 trading days belong to the IPO’s in 1990 with a cumulative abnormal return of (16.2%) and a t-stat of 0.65 as seen in Figure 6.
Though the results are not statistically significant as presented in Table 7, the study showed that the issues in 1994 and 1995 have underperformed the market and the initial positive returns in the days following the initial offering become negative in the months that follow as seen in Figure 6. Hence, as far as the medium and long term performance of issues during the 1994-95 period is concerned, it can be concluded that a significant abnormal return characteristics of IPO’s is not observed.
The impact of offering methods on pricing of IPO’s, as well as their long term performance are also investigated through grouping IPO’s according to the offering method including offering through sale of newly issued capital and offering through sale of existing shares.
Table 8: Cumulative Abnormal Returns for IPO’s Grouped According to the Type of Offering Method
1 Offering Method n CAR(1) CAR(5) CAR(250) CAR(500) CAR(750)
Newly Issued C. 27 9.7% 14.8% 18.9% 10.3% 7.2%
( t-stat) 5.06 4.26 1.31 0.50 0.25
Ex. Shares 57 10.3% 9.9% 10.9% 18.7% 22.6%
( t-stat) 2.11 1.93 1.01 1.26 1.12
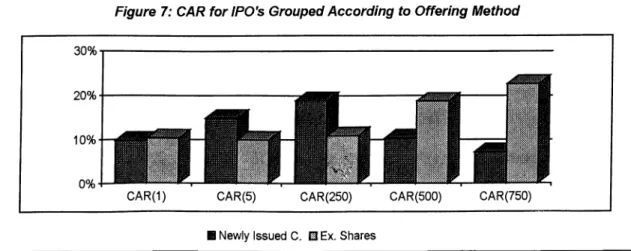
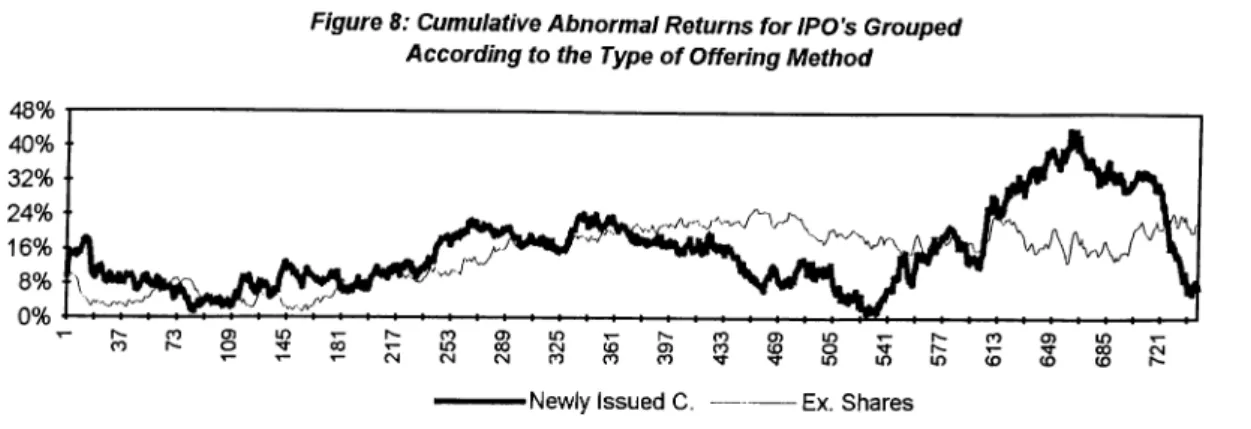
The first day return and cumulative abnormal return of IPO’s taking place through the sale of the existing shares of the current owners are higher than the returns of IPO’s taking place a capital increase as seen in Figure 7 . While the first day returns of two methods are significant as presented in Table 8, cumulative abnormal returns for 750 trading days are not significant.
Figure 7: CAR for IPO's Grouped According to Offering Method
I Newly Issued C. Ex. Shares
Considering the results of the tests for short and long term price behavior, it can be concluded that the new issues for two different offering methods are significantly
underpriced but in the long term a significant return characteristic of IPO’s based on the different type of offering method is not observed.
Figure 8: Cumulative Abnormal Returns for IPO's Grouped According to the Type o f Offering Method
The impact of the percentage of the shares offered to the public on pricing of IPO’s, as well as their long term performance are also investigated through grouping IPO’s according to the percentage of the shares offered to the public.
Table 9: Cumulative Abnormal Returns for IPO’s Grouped According to the Percentage of the Shares Offered to the Public
1 % of the shares n CAR(1) CAR(5) CAR(250) CAR(500) CAR(750)
>= 15% ( t-stat) 72 11.0% 2.80 12.7% 2.98 13.6% 1.44 10.1% 0.78 16.2% 0.89 < 15% ( t-stat) 15 7.0% 2.13 10.9% 2.17 20.5% 0.97 44.4% 1.48 36.3% 0.89
Average significant underpricing for 11.0% on the first day for the first group reaches a CAR of 16.2% after 750 days as shown in Figure 9. Average significant underpricing for 7.0% on the first day for the second group reaches a CAR of 36.3% after 750 days as seen in Figure 9. However, as presented Table in 9, the latter figures are not statistically significant for both groups.
Figure 9: CAR For IPO's Grouped According to the Percentage of Shares Offered to the Pubiic
l>= 15% m< 15%
Hence, the IPO’s in the first group are more underpriced with respect to the new issues in the second group. However there is no significant direct relation with the long term performance of IPO’s and the percentage of the shares offered to the public.
Figure 10: Cumulative Abnormal Returns for IPO's Grouped According to the Percentage o f the Shares Offered to the Public
VII. CONCLUSION
The present empirical study insights into underpricing mystery of IPO’s and the return characteristic and performance of IPO’s in the Turkish Stock Market in the short and long term is examined in this study. We would expect stronger anomalies if underpricing and poor performance of IPO’s were signs of market inefficiency. Accordingly, the examination of 87 IPO’s during 1990-95 in Turkish market showed that, on the average IPO’s are underpriced and investors taking a position in IPO’s during the offering date can enjoy short term return relative to the market.
In the longer term the speed of market adjustment to mispricing is further explored through calculating CAR measured over 750 trading days. However, the result does not exhibit any significant long term anomaly. In conclusion, the long term performance of IPO’s are not any better or worse than the average stock in the market. The most striking empirical findings in this study is initial underpricing phenomenon of new issues in an emerging market as it is in developed markets.
We also investigated the impact of the type of companies on the underpricing of new issues through grouping the companies in the sample in terms of private issues versus public companies. Initial and long term performance of the IPO’s of state- owned companies are better than the IPO’s of private companies due to Public Participation’s Administration (PPA) acting as a market maker for stocks in its portfolio.
In addition, a comparison of IPO’s in different years reveals that market conditions and institutional setting in capital market are significant factors in pricing of IPO’s. The present study report that the new issues during the 1990-1995 period except
1991 are underpriced however, no statistically significant medium and long term anomalies found within those groups (except IPO’s in 1993).
The differences in the abnormal returns within those groups provide some support for the institutional explanation for IPO anomalies since the institutional setting and conditions in the Turkish market is changing rapidly over the years and the settings and conditions during the studied time period are quite different from the setting in developed markets. Especially, it could be noted that during the 1990-95 period, the investment banking process was not very structured and there was the variation in investment banking procedures of the IPO’s.
For instance, there was less regulatory discipline regarding the allocation of shares among investors in an IPO and IPO’s were generally priced at a discount from average market multiples. Until the middle of the 90’s, underwriting risk has been increasingly incorporating into IPO pricing so that IPO’s were generally priced at a discount. On the other hand, in recent years, especially in 1997, underwriting banks and securities houses have been able to ignore underwriting risk in their pricing due to the increasing competition among underwriters so that IPO’s were generally priced at fair value, leading to weak secondary market performance.
Moreover, a comparison of the offering methods including offering through the sale of newly issued capital and offering through sale of existing shares and the impact of the percentage of the shares offered to the public on pricing of IPO’s, as well as their long term performance were also investigated. Considering the results of the tests, it can be concluded that there was no direct relation with the performance of IPO’s and the percentage of the shares offered to the public and the offering methods.
Considering the importance of the topic, further studies are needed to identify sources of variation in IPO’s. The recommended studies may be the reason of underpricing, underwriter price support, underwriter reputation and its impact on the pricing.