PATHWAY GRAPHS
a thesis
submitted to the department of computer engineering
and the institute of engineering and science
of bilkent university
in partial fulfillment of the requirements
for the degree of
master of science
By
G¨urcan G¨ule¸sir
September, 2003
I certify that I have read this thesis and that in my opinion it is fully adequate, in scope and in quality, as a thesis for the degree of Master of Science.
Assist. Prof. Dr. U˘gur Do˘grus¨oz (Supervisor)
I certify that I have read this thesis and that in my opinion it is fully adequate, in scope and in quality, as a thesis for the degree of Master of Science.
Prof. Dr. ¨Ozg¨ur Ulusoy
I certify that I have read this thesis and that in my opinion it is fully adequate, in scope and in quality, as a thesis for the degree of Master of Science.
Assist. Prof. Dr. U˘gur G¨ud¨ukbay
Approved for the Institute of Engineering and Science:
Prof. Dr. Mehmet B. Baray
Director of the Institute Engineering and Science
VIEWS OF CELLULAR PATHWAY GRAPHS
G¨urcan G¨ule¸sir
M.S. in Computer Engineering
Supervisor: Assist. Prof. Dr. U˘gur Do˘grus¨oz September, 2003
The enhancements in genomic studies have given birth to the necessity of advanced techniques for storing, integrating and analyzing the accumulated data regarding molecular level cellular processes. Since this data is huge and complex, advanced visualization and complexity management techniques need to be devel-oped to improve its understandability. In this thesis, we present a single subject - multiple view framework for manipulating complex pathway data, which is in the form of a directed graph.
The framework facilitates visualization of potentially huge pathway data in possibly varying forms and sizes. While maintaining the subject data (i.e., path-way graph) and its views, the presented framework coordinates all the views using an observer software pattern. It ensures the validity and consistency of subject data across all views. Support for replication of biological data, which is desired to reduce complexity (i.e., high degree ubique pathway objects), is another benefit of our framework.
Being a neatly modularized, isolated component of a functional pathway edi-tor, this framework is distinguished from any other single subject - multiple view graph editing environment by addressing the domain specific needs of pathway informatics.
Keywords: Bioinformatics, software engineering, cellular pathways, graph
visual-ization, multiple views, view coordination. iii
¨
OZET
H ¨
UCRESEL YOLAK C
¸ ˙IZGELER˙IN˙IN Y ¨
ONET˙IM˙I ˙IC
¸ ˙IN
C
¸ OKLU G ¨
OR ¨
UNT ¨
ULEME Y ¨
ONTEM˙I
G¨urcan G¨ule¸sir
Bilgisayar M¨uhendisli˘gi, Y¨uksek Lisans Tez Y¨oneticisi: Yard. Do¸c. Dr. U˘gur Do˘grus¨oz
Eyl¨ul, 2003
Gen ara¸stırmalarındaki geli¸smeler, molek¨uler seviyedeki h¨ucresel i¸slemlerin in-celenmesi sonucu elde edilen verinin saklanması, birle¸stirilmesi ve analiz edilmesi i¸cin ileri tekniklerin ihtiyacını do˘gurmu¸stur. S¨ozkonusu veri b¨uy¨uk ve karma¸sık oldu˘gundan dolayı, anla¸sılabilirli˘gini arttırmak i¸cin ileri g¨orselleme ve karma¸sıklık y¨onetimi tekniklerinin geli¸stirilmesine ihtiya¸c vardır. Bu tezde, y¨onl¨u ¸cizge halinde bulunan karma¸sık yolak verisini de˘gi¸stirmek i¸cin bir tek ¨ozne - ¸coklu g¨or¨unt¨u y¨ontemi sunuyoruz.
Sunulan y¨ontem de˘gi¸sen ¸sekillerde ve ebatlardaki potansiyel olarak b¨uy¨uk olan yolak verisinin g¨orsellenmesini sa˘glar. Bir taraftan ¨ozne ve g¨or¨unt¨uleri korurken, di˘ger yandan da izleyen yazılım desenini kullanarak b¨ut¨un g¨or¨unt¨uleri d¨uzenleme yetisine de sahiptir. Sunulan y¨ontem ¨ozne verisinin ¨uzerindeki g¨or¨unt¨ulerin do˘grulu˘gunu ve tutarlılı˘gını da garanti altına almaktadır. Karma¸sıklı˘gın (y¨uksek dereceli yolak nesneleri) azaltılması i¸cin ihtiya¸c duyulan biyolojik verinin yinelen-mesi de y¨ontemimizin ba¸ska bir faydasıdır.
C¸ alı¸san bir yolak de˘gi¸stiricisinin d¨uzg¨unce mod¨ullenmi¸s bir par¸cası olarak bu iskelet, yolak biyo-enformati˘ginin alana has ihtiya¸clarına kar¸sılık vermesi ile her-hangi bir tek ¨ozne - ¸coklu g¨or¨unt¨u y¨ontemine sahip ¸cizge de˘gi¸stirme ortamından ayrılmaktadır.
Anahtar s¨ozc¨ukler : Biyo-enformatik, h¨ucresel yolaklar, ¸cizge g¨or¨unt¨ulemesi, ¸coklu
g¨or¨unt¨uleme, g¨or¨unt¨u koordinasyonu, yazılım m¨uhendisli˘gi. iv
I would like to express my gratitude to my supervisor Assist. Prof. Dr. U˘gur Do˘grus¨oz for his instructive comments in the supervision of the thesis.
I would like to express my special thanks and gratitude to Prof. Dr. ¨Ozg¨ur Ulusoy and Assist. Prof. Dr. U˘gur G¨ud¨ukbay for showing keen interest to the subject matter and accepting to read and review the thesis.
And of course, without my teammates, it would be no more than a fantasy to accomplish this work. Emek, ¨Ozg¨un, Aslı and G¨urkan, thank you very much for your each and every contribution.
Contents
1 Introduction 1
1.1 Motivation . . . 1
1.2 Results . . . 2
1.3 Organization of the Thesis . . . 2
2 Definitions 3 2.1 Basic Definitions . . . 3
2.2 Compound Graphs and Graph Managers . . . 4
2.3 PATIKA Ontology . . . 6
2.4 Observer Design Pattern . . . 9
3 Related Work 11 3.1 Pathway Informatics . . . 11
3.2 Graph Visualization . . . 12
3.3 Multiple Views in Information Visualization . . . 12
4 Subject - View Mechanism 14
4.1 Subject Graph . . . 14
4.2 View Graphs . . . 16
4.3 Possible Usages . . . 16
4.4 Constraints . . . 19
4.4.1 Non-Ubique Graph Objects . . . 19
4.4.2 Ubique Graph Objects . . . 20
4.4.3 Subset Constraint of Mechanistic Graph Managers . . . 20
4.4.4 Intersection Constraint . . . 22
4.4.5 Abstraction View Management . . . 22
4.4.6 Invariant checks . . . 24 4.5 Topological Operations . . . 25 4.5.1 Insert . . . 25 4.5.2 Remove . . . 27 4.5.3 Example Session . . . 28 5 Conclusion 37 5.1 Future work . . . 38
A Class Structure and Implementation 43 A.1 Subject - View Mechanism . . . 43
CONTENTS viii
2.1 A compound graph CG, and its corresponding components: graph G and rooted tree T (reprinted from [13]). . . 5 2.2 An example illustrating the basics of PATIKA ontology, where
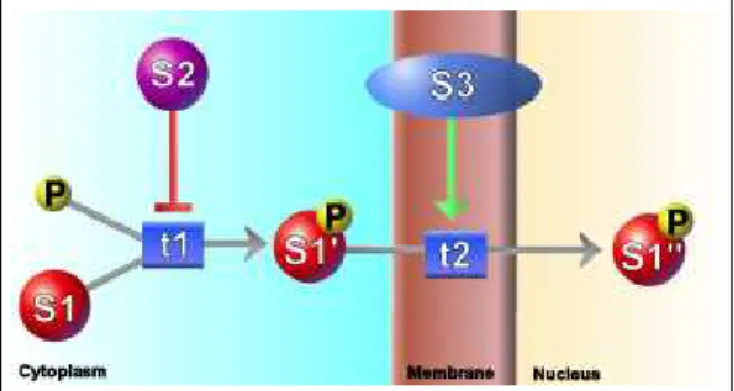
state, transitions, and interactions are represented with circles, rectangles, and lines, respectively. . . 7 2.3 Incomplete transition T1 inhibits transition t2 which produces
molecular complex C1. . . 8
4.1 A sample abstract subject pathway graph demonstrating the ele-ments of our ontology. States, transitions, incomplete states, in-complete transitions, complexes, homology states, homology tran-sitions and bioentities are represented with S, T, IS, IT, C, HS, HT, B, respectively. Note that T6 and S11 are in the intersection of IS1 and IT2. . . 15 4.2 A simple mechanistic graph created by a user. . . 17 4.3 Two different subset views of the sample mechanistic subject
graph, which is displayed in Figure 4.1. Only a subset of the subject pathway graph is displayed in both graph windows. . . 18
LIST OF FIGURES x
4.4 The ubique small molecule P (Phosphorus), which is quite abun-dant in cellular interactions, is replicated three times in the path-way graph. . . 21 4.5 Simple state S2 is in the intersection of two regular abstractions
RA1 and RA2. RA1 is visible in this view, whereas RA2 is hidden. By observing the holos around T2, S2, S3 and S4 we recognize that these nodes are members of RA2. . . 23 4.6 After the user hides RA1 and makes RA2 visible, now only S2,
which is in the intersection of RA1 and RA2, is visualized with holo. By observing this, we understand that S2 is a member of RA1. . . 24 4.7 Incomplete state IS1, simple transition T1 and a substrate edge
between them are created and propagated to all views. . . 29 4.8 Simple state S1 and S2 are created via View1 and View2,
respec-tively. Note that they are not propagated to other views. . . . . 30 4.9 Homology state HS1 and homology transition HT1 are created via
View1 and View2, respectively. Note that they are not propagated to other views. . . 31 4.10 IS1 in View2 is expanded and S3, T2, S4, a substrate and a product
edge are created in IS1. . . 32 4.11 IS1 in View1 is expanded. Note that the modifications in Figure
4.10 are reflected to View1 automatically, due to the abstraction constraint. . . 33 4.12 Homology state HS1 and its incident activation edge is inserted
into View1. Incomplete Transition IT1 is inserted into HS1 and an inhibition edge is inserted between IT1 and T1. Similarly, HT1 and S5 are inserted into View2 with inhibition and activation edges. These operations are not reflected to other views. . . 34
4.13 T1 is removed from View2 only. . . 35 4.14 T2 and S4 are removed from subject. . . 36
A.1 This package contains the fundamental classes of our framework. 44 A.2 This package contains the subject level implementation of PATIKA
ontology. . . 46 A.3 This package contains the view level implementation of PATIKA
Chapter 1
Introduction
Graphs are commonly used for representing biochemical pathways. Substances are connected by reactions in order to capture the intra-cellular phenomena. PATIKA project [10] aims collaboratively to collect such data at a central server, integrate it and provide its users with the efficient means to visualize, query, mod-ify it via a client program. The client program consist of a graph editor, which utilizes the Graph Editor Toolkit for Java (GET/J) of Tom Sawyer Software by some customization with respect to the domain specific needs of the application.
1.1
Motivation
Due to the accumulation of huge amount of data regarding the cellular pro-cesses, it becomes more than a necessity not only to utilize the state-of-the-art graph visualization techniques, but also to develop new ones in order to handle the inherent complexity and incompleteness of pathway data. GET/J provides a wide range of graph theoretic operations [14] such as zooming/panning, ex-pand/collapse, folding/grouping. However some biological concepts like ubiques, abstractions, coloring schemes and bioentity require a specialized form of a mul-tiple view framework, which generic graph editors lack. Efficient analysis of such biological phenomena is best possible by providing different types of views of the
same underlying pathway data. Consequently, proper coordination of different views is very crucial for the alignment of the views with the subject data.
1.2
Results
In this work, we have designed and partially implemented a neatly isolated com-ponent for the PATIKA software [1], that is easily maintainable and extendible. Our framework facilitates visualization of potentially huge pathway data in vary-ing forms and sizes. It also supports replication of pathway data (e.g., high degree ubique pathway objects) to reduce its visualization and layout complexity. The multiple window coordination mechanism is designed in such a way that biological invariants are satisfied and subject data across views remain valid and consistent. We also believe that this framework is going to improve user performance and enhance discovery of unforeseen interactions. Applying different coloring schemes on the same graph in different views enables the user to inspect the genomic data from different points of view.
1.3
Organization of the Thesis
In this thesis, we present a single subject - multiple view framework for visualizing and editing complex pathway data, which is in the form of a directed graph. In Chapter 2 we introduce some terms and definitions, since the rest of the thesis assumes solid understanding of these. The related work in our domain of interest is presented in Chapter 3. Chapter 4 describes the structure of our subject-view mechanism and clarifies its key design issues. Finally we conclude in Chapter 6.
Chapter 2
Definitions
The graph theory related definitions in this chapter are taken from [11].
2.1
Basic Definitions
A graph G is defined by two finite sets V and E, such that E ⊆ [V]2. The elements
of V are the nodes (or vertices) of G, and the elements of E are the edges of G. An edge e is given as (u,v ), where u ∈ V is the source node of e and v ∈ V is the
target node of e.
A path P (= x1x2x3...xi...xn−2xn−1xn) is defined as non-empty graph of n
vertices, such that all vertices in the sequence are distinct from each other and an edge exists between xi and xj , iff i = j − 1 where i = 1, 2, ..., n − 1 and
j = 2, 3, ..., n. Given a path P, by adding the edge (xn, x1) we obtain a cycle. A
graph is called acyclic if there are no cycles in it.
A non-empty graph G = (V,E) is called connected if for any pair of u ∈ V we have a path between u and v in G.
An acyclic graph is also named as forest, and a connected forest is called a tree.
A rooted tree T is defined by a node set V, an edge set E, and a node r, such that for every node u ∈ V − {r}, there is a unique path P from r, the root of the tree, to u.
2.2
Compound Graphs and Graph Managers
A compound graph [13] CG is defined over a graph G = (V, EG) and a rooted
tree T = (V, ET, r) with the same set of vertices (Figure 2.1). The vertex set V
may be divided into two subsets VB and VS, where the nodes belonging to VB
are the leaves of T and denote the base nodes base nodes of the graph and the nodes belonging to VS denote the subgraphs of the graph. An existing edge in
ET denotes a nesting relation between the source and target nodes of the edge.
For example, if e = (u, v) ∈ ET, this claims v is nested in u. Depending on the
context it may also be called an inclusion relation, where node u includes node
v.
Most of the following definitions, unless otherwise stated, are taken from [14]. A graph manager M = (S, F ) is a variant of compound graphs, defined by a graph set S = {G1, G2, ..., Gl} where Gi = (VGi, EGi) and a navigation forest
of rooted trees F = (VF, EF) = T
1
S
T2...
S
Tk. Each graph Gi ∈ S, each node
v ∈ VGi, and each edge e ∈ EGi is represented by a distinct node in VF. For each
node v ∈ VGi, there exists an edge (G
i, v) ∈ EF, representing ownership relations
in the graph manager. Then Gi is called the owner of v (or e); conversely v (or
e) is called a member of Gi.
A navigation link associates a member of a graph and another graph. Each such link is represented in the navigation forest by an edge (m, Gi) ∈ EF between
a member (a node or an edge) m and a graph Gi, where Gi is not the owner of
m. We say the graph member m navigates to the associated graph Gi, and Gi is
said to be the child graph of the parent member m. Conversely, the owner of the graph member m is called the parent graph of Gi.
CHAPTER 2. DEFINITIONS 5
Figure 2.1: A compound graph CG, and its corresponding components: graph G and rooted tree T (reprinted from [13]).
Another way of associating two different graphs in a graph manager M = (S, F ) is via the intergraph edges. Let u ∈ VGj be two nodes where G
i 6= Gj
and GiGj ∈ S. Then the edge (u, v) isa called an intergraph edge, representing a
relation between objects (nodes) that belong to different entities, graphs Gi and
Gj in this case. An intergraph edge e = (u, v) is owned by the lowest common
ancestor graph of the two respective owner graphs of end-nodes u and v in the navigation forest F.
A graph manager is distinguished from a compound graph by its capability of handling multiple graphs and intergraph edges.
2.3
PATIKA Ontology
Some of the following definitions are taken from [9], and some of them are newly introduced with respect to the latest PATIKA ontology.
A pathway is an abstraction of a certain biological phenomena and is the uppermost abstraction in PATIKA ontology. Its context can change from a single molecule-molecule interaction to a complete set of all the interactions in a cell. In PATIKA ontology a pathway is represented by a pathway graph, which is a compound graph [13] . For the sake of simplicity, we will first describe a simple pathway graph and extend our definition to a more complete, complex compound pathway graph.
A simple mechanistic pathway graph is defined by an interaction graph Gm =
(V, E) along with a number of constraints on the topology as discussed below. V is the union of a finite set of states Vs and a finite set of transitions Vt. E is a
union of interactions of four sets: substrate edges Es, product edges Ep, activator
edges Ea, and inhibitor edges Ei, each directed edge belonging to either Vt× Vs
(for product edges) or to Vs× Vt(for remaining interaction edge types). If a state
s is labelled as ubique then for any view v of s, d(v) = 1.
CHAPTER 2. DEFINITIONS 7
grouped under a biological entity or simply bioentity. A simple bioentity graph is defined by an interaction graph Gb = (Vb, Eb) such that Vb is a finite set of
bioentities; Eb is a union of protein-protein interaction edges Eppi, co-cluster edges
Ecc, genetic regulation edges Egr, literature edges El and derived mechanistic
edges Ed between bioentities belonging to [Vb]2.
Figure 2.2: An example illustrating the basics of PATIKA ontology, where state, transitions, and interactions are represented with circles, rectangles, and lines, respectively.
A more comprehensive ontology addressing molecular complexes as well as various types of abstractions can be defined with the notion of a compound graph. A compound pathway graph CG = (G, I) is a 2-tuple of a pathway graph G and a directed acyclic inclusion graph I where:
• G = Gm
S
Gb
• V (Gm) = Vm is the union of states Vs, transitions Vt, molecular complexes
Vc, and abstractions of five distinct types: regular, incomplete state,
in-complete transition, homology state and homology transition, respectively denoted by Var, Vas , Vat, Vahs, and Vaht.
• E(Gm) is the union of directed interaction edges of four distinct types:
substrate, product, activation, and inhibition, respectively denoted by Es,
Ep, Ea, and Ei, and undirected bind edges Eb, used to form molecular
• V (Gb) = Vb
• E(Gb) is the union of directed interaction edges of five distinct types:
protein-protein interaction, co-cluster, genetic regulation, literature, de-rived mechanistic edges respectively denoted by Eppi, Ecc, Egr, El, and
Ed such that Eppi, Ecc, Egr, El,Ed→ [Vb]2.
• V (I) = V (Gm)
• E(Im) is the union of inclusion edges Eic for defining molecular complexes,
and Eir, Eis, Eit, and Eih for various types of abstractions such that Eic→
Vc× Vs; Eir → Var× V ; Eis→ Vas× V ; Eit→ Vat× V ; Eihs → Vahs× Vs;
Eiht→ Vaht× Vs.
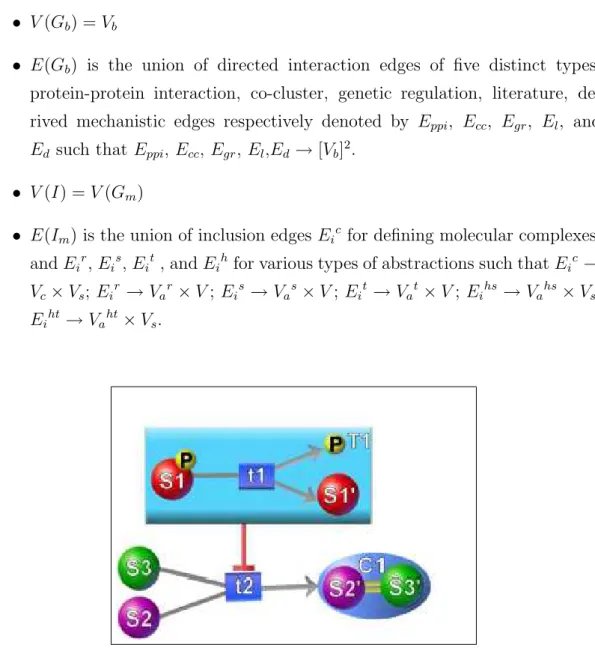
Figure 2.3: Incomplete transition T1 inhibits transition t2 which produces molec-ular complex C1.
In order for a compound pathway graph CG = (G, I) comply with our ontol-ogy, it needs to satisfy certain invariants as defined below:
• Molecular complexes cannot be nested; thus any directed path in I can
contain at most one edge in Eic. A state can be incident to a bind edge
in Eb, only if it has an incoming complex edge in Eic . Complexes are not
CHAPTER 2. DEFINITIONS 9
complex state has no associated bioentity, although its children in I have their own bioentities.
• Regular abstractions represent pure grouping; thus they are not allowed to
have incident edges in E(Gm). However, they may be nested for
represent-ing multiple levels of detail.
• Homology abstractions are not allowed to be nested; therefore, any directed
path in I can contain only one homology abstraction edge.
• A vertex in Vm is allowed to have any number of incoming abstraction edges
in E(I) since abstractions may overlap. Two overlapping abstractions do not necessarily define two vertex sets where one is a proper subset of the other.
For more information about PATIKA ontology you may refer to [10],[9].
2.4
Observer Design Pattern
As Gamma et al. stated in [12], observer design pattern is used to define one-to-many dependency between objects so that when one object changes state, all its dependents are notified and updated automatically. This design pattern is mostly applicable for the following cases:
• When an abstraction has two aspects, one dependent on the other.
En-capsulating these aspects in separate objects lets you vary and reuse them independently.
• When a change to one object requires changing others, and you don’t know
how many objects need to be changed.
• When an object should be able to notify other objects without making
assumptions about who these objects are. In other words, you don’t want these objects tightly coupled.
The subject participants of this pattern are known as subject and observer (view for our case).
Chapter 3
Related Work
3.1
Pathway Informatics
Human genome is expected to be extremely complex. Hundred thousands of molecules and factors constitute to a huge network of information [2], [19]. Know-ing the exact map of this network is of high value, since it potentially explains the mechanisms of life processes in addition to disease conditions. The knowl-edge about the cellular processes is increasing at a rapid growing pace, which enables us to understand and predict a cell’s behavior at a better extent. As a result, successful simulations and predictions of cellular events in different scopes have been reported [18], [23], [27], [31]. A conventional approach to modelling pathway information is based on pathway drawings composed of still images [5], [6], [7], [28]. Such drawings are often not reusable and cannot be integrated pro-grammatically, but they are easy to create. Signaling pathway databases aim to model complex signaling networks [3], [29], [32]. Due to the increasing complex-ity of the phenomena, efforts focus on decreasing modelling time and increasing modularity of the model. Therefore these databases have strong ontology. On the other hand they lack automated integration and visualization. BioJake [24] addresses such weaknesses by providing facilities for drawing pathways, but still lacking automated integration and layout. PATIKA project aims to describe an
ontology and design a computational tool, to provide researchers an integrated collaborative environment for modelling networks of cellular processes through integration of information on individual pathways [9].
3.2
Graph Visualization
The complexity of a graph can be measured by the amount of data to be visual-ized. In other words, number of nodes and edges can determine how complex a graph is. From visualization point of view, the graph drawing and editing tools aim to handle this complexity by some well-known techniques, so that they pro-vide user friendly means to edit a graph. Among many complexity management techniques in graph visualization, zooming/panning [15], fish-eye distortion [26], nesting , expanding/collapsing, folding, hiding and ghosting [14] are the promi-nent ones. D-ABDUCTOR [16] is a tool, which supports compound graphs and information hiding via expand and collapse operations. VCG [25] is capable of folding nodes and edges under certain cases and hide edges of specific types. Higres [17] is a visualization system for clustered graphs and has support for handling compound graphs. GET [14] is equipped with almost all of the above explained complexity management techniques.
3.3
Multiple Views in Information Visualization
A view basically represents a specific aspect of a complex data set for investigation of a single conceptual entity. Therefore multiple view systems are very common and useful in order to cope with the complexity of the underlying data [8], [21], [22]. North and Schneiderman [20] claim that multiple window coordinations offer many advantages such as unification of the desktop, improved user performance and discovery of unforeseen interactions. On the other hand such systems have always been challenging to design. Therefore Baldolando and Kuchinsky [4] re-cently proposed some useful guidelines for designing multiple view systems. They
CHAPTER 3. RELATED WORK 13
defined some rules such as diversity, complementarity, decomposition, parsimony, space/time resource optimization, self-evidence, consistency and attention man-agement. The first four guidelines provide the designer with rules for selection of multiple views, whereas the rest of the guidelines apply to the presentation and interaction design questions that arise in these systems.
Subject - View Mechanism
Broadly speaking, our subject-view mechanism consists of one underlying subject graph and its view graphs, which are subgraphs of the subject graph. The subject graph can only be manipulated via one view at a time and any manipulation propagates to any other views as necessary by utilizing the slightly modified version of the observer software pattern [12] as explained in the following sections.
4.1
Subject Graph
Our subject Gsub is a compound pathway graph as described earlier. Therefore
Gsub always has at least two components. Structurally, subject graph is exactly
the same as the huge graph “big picture” in the PATIKA database but typically a lot smaller in size, depending on the user’s current interest within the big picture. It serves as a “cache” between the database and the client, which can be manipulated either by queries or editions by the user. The user can define as many views as they want on this subject graph. Since Gsub is abstract (i.e.,
the nodes and edges do not have drawing or geometry information), there are no means to visualize it in the PATIKA editor. Therefore the user can create possibly different forms of views of it, via which they can analyze and manipulate the contents of Gsub.
CHAPTER 4. SUBJECT - VIEW MECHANISM 15
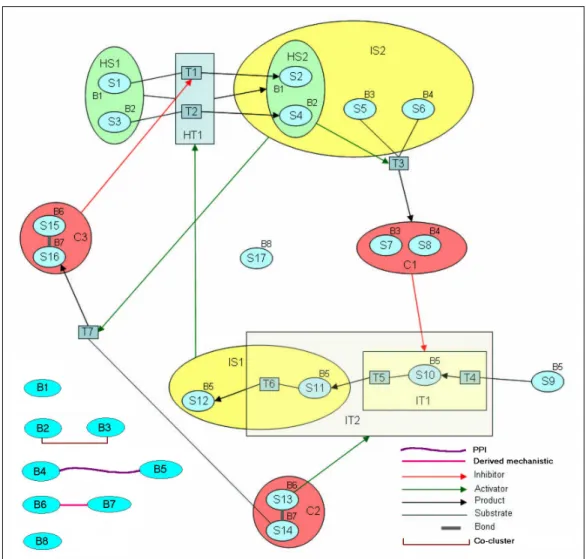
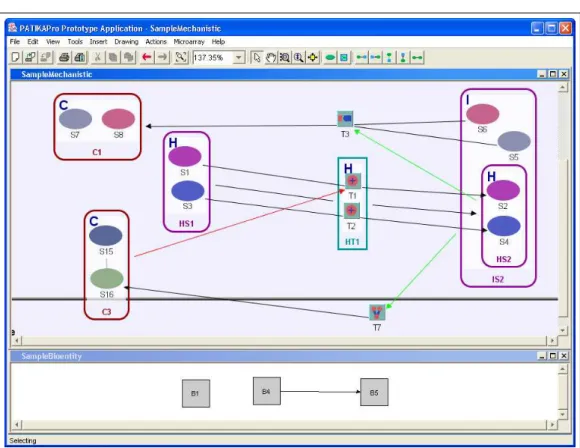
Figure 4.1: A sample abstract subject pathway graph demonstrating the elements of our ontology. States, transitions, incomplete states, incomplete transitions, complexes, homology states, homology transitions and bioentities are represented with S, T, IS, IT, C, HS, HT, B, respectively. Note that T6 and S11 are in the intersection of IS1 and IT2.
4.2
View Graphs
The view graph managers are - not necessarily proper - subsets of the subject graph regarding their contents. Every graph manager is associated with a graph window, in order to be displayed in GET/J. There are two kinds of view graph managers in our framework:
• Mechanistic Graph Manager
• Bioentity Graph Manager
As the names imply, a mechanistic graph manager displays a subset of the mechanistic part of the subject, whereas a bioentity graph manager displays a subset of the bioentity graph part.
4.3
Possible Usages
First of all, the user can open a blank view and create pathways of their own interest. They can create any type of node and edge using the user interface of the editor in order to populate the underlying subject data. We also provide the user with the facility to remove graph objects either from a view or from the subject data or from the database.
A typical user of this framework may simultaneously want to focus on different parts of the pathway data in the database. They can bring the data of their interest to the editor as the subject data by a regular PATIKA query. Thereafter the user can create two different types of views which reflect different parts of the subject data.
Another use case scenario would be as follows: The user draws two different pathways in two different views and then wants to investigate in a different view how they integrate with the big picture in the database. Therefore they open a blank view and retrieve complete data set from the subject, which includes both
CHAPTER 4. SUBJECT - VIEW MECHANISM 17
Figure 4.2: A simple mechanistic graph created by a user.
pathways. Upon this retrieval, they can make neighborhood queries in order to enlarge the graph with the data in the database.
Ubique state handling is also provided by our framework. As we already discussed, ubiques are special node types of degree one, which can be replicated an arbitrary number of times in a graph window. Apart from creating a new ubique state, the user can reuse existing ubique states by attempting to draw an edge from/to a ubique state. This attempt will be handled by the framework and the ubique state splits into two, so that the degree constraint is not violated.
Our multiple view framework enables the user to simultaneously investigate the same data with different coloring schemes as well. The user can color different views by bioentities, external data (such as microarray), functional relation (e.g., upstream of a state), field, tissue and phase.
Figure 4.3: Two different subset views of the sample mechanistic subject graph, which is displayed in Figure 4.1. Only a subset of the subject pathway graph is displayed in both graph windows.
CHAPTER 4. SUBJECT - VIEW MECHANISM 19
4.4
Constraints
In this section, we are going to clarify the constraints and invariants, which ensure the proper coordination of the subject and its views.
4.4.1
Non-Ubique Graph Objects
As we already mentioned, our framework addresses domain specific needs regard-ing multiple views. Most types of nodes in a mechanistic graph manager (i.e. graph window) appear at most once, since more replicas within a view would be biologically incorrect. Therefore, the following types of objects appear only once within each graph window:
• Simple states • Simple transitions • Regular abstractions • Incomplete states • Incomplete transitions • Homology states • Homology transitions • Complex molecules • Complex members • Substrate edges • Product edges • Inhibitor edges • Activator edges
• Bond edges
4.4.2
Ubique Graph Objects
For the time being, only simple states are allowed to be labelled as ubique ac-cording to our ontology. Such states (e.g. water molecule) participate in a huge amount of biochemical reactions, which results in very high degree states. This adds a very high complexity to the layout of the graph, consequently visualization naturally deteriorates. In order to manage this complexity, we split such states as many times as their degrees. For instance, if a ubique state has five degrees in the subject graph and a mechanistic graph manager is responsible for displaying each of the five edges, then in the view, user sees five distinct replicas of that ubique state, each of which has just one incident edge. This is a special case of multiple views, where a graph object have more than one view in the same graph window.
4.4.3
Subset Constraint of Mechanistic Graph Managers
As we already stated, all views are subsets of the subject in the PATIKA client. However, Mechanistic Graph Managers comply a stronger subset relationship, which we define here.
Depending on their type, complex molecules and abstractions represent a certain biological phenomena and although they include more than one graph object, semantically they are indivisible, atomic entities. Therefore, the following invariants must always be satisfied:
• An abstraction can be visualized in a mechanistic graph manager Gm if all
of its members are visualized in Gm.
• A complex molecule - can include only complex member molecules and
CHAPTER 4. SUBJECT - VIEW MECHANISM 21
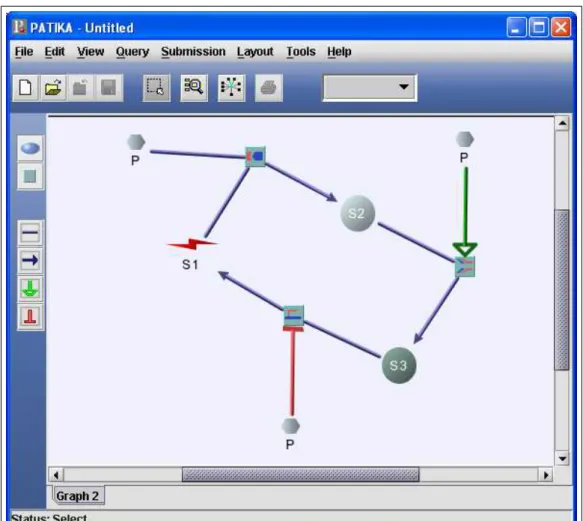
Figure 4.4: The ubique small molecule P (Phosphorus), which is quite abundant in cellular interactions, is replicated three times in the pathway graph.
a mechanistic graph manager Gm if and only if all its members are also
visualized in Gm.
• If an interaction’s source and target node are present in a specific graph
window, then the interaction must also be present in that graph window.
4.4.4
Intersection Constraint
In the mechanistic graph of the subject graph, there might be a node v such that v is included in more than one abstraction’s member list. For the sake of simplicity, let A1 and A2 be the two abstractions such that a state s ∈ A1, s ∈ A2 and
A1TA2 = {s}. Since a mechanistic graph manager’s inclusion graph is directed
and acyclic, it is not possible to visualize A1 and A2 at the same time in a graph window due to s. This can be considered as a shortcoming of GET/J regarding our needs. How we resolve this issue is going to be clear in the following chapter. This constraint applies for arbitrary number of abstractions and arbitrary number of nodes in their intersections.
4.4.5
Abstraction View Management
Two or more non-proper overlapping abstractions cannot be visualized within the same view due to the restrictions of a graph manager. In order to visualize the information related to such abstractions, we designed a “holo system”, which enables the currently not visualized (i.e., hidden) abstractions to be represented within the view. A holo is a simple bounding box or a circle around a node which belongs to a hidden abstraction. A holo inherits its color from the abstraction(s) it represents. Please refer to Figures 4.5 and 4.6 for the illustration of holos.
CHAPTER 4. SUBJECT - VIEW MECHANISM 23
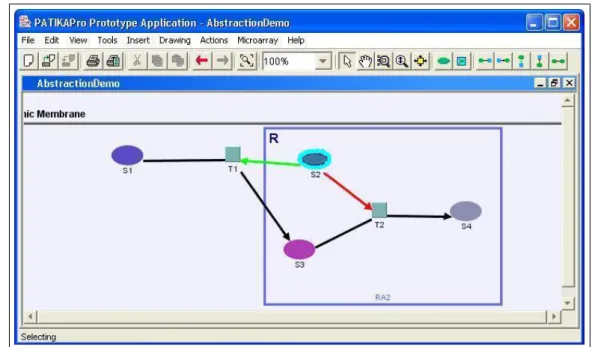
Figure 4.5: Simple state S2 is in the intersection of two regular abstractions RA1 and RA2. RA1 is visible in this view, whereas RA2 is hidden. By observing the holos around T2, S2, S3 and S4 we recognize that these nodes are members of RA2.
Figure 4.6: After the user hides RA1 and makes RA2 visible, now only S2, which is in the intersection of RA1 and RA2, is visualized with holo. By observing this, we understand that S2 is a member of RA1.
4.4.6
Invariant checks
In addition to the domain specific constraints above, we also care about some invariants of the framework regarding its data structures. They are basically the assumptions on which the running application counts. Therefore it is crucial to ensure these assumptions hold. They are checked by a checkInvariant method, that is implemented differently in each of the classes. Whenever they are called for an instance of a class, they determine whether all the invariants are satisfied by that instance and return a boolean value accordingly. Typically such checks are called before and after every topological operation. Here is an incomplete set of invariants we encountered:
• A subject must be associated with a subject manager.
• A view must be associated with a view manager.
CHAPTER 4. SUBJECT - VIEW MECHANISM 25
• A mechanistic graph manager can only have mechanistic nodes and edges.
• A bioentity graph manager can only have bioentity nodes and edges.
4.5
Topological Operations
4.5.1
Insert
Assumptions: There is no object that the user inserts, such that it exists in the
database but not in the subject. Newly created object is directly inserted into the subject graph and its view is created in the active graph window. Propagation to the other windows is optional. Insertion of a an object into an abstraction in a specific view, must propagate to other views containing the same abstraction, due to the invariant explained in Subset Constraint of Mechanistic Graph Managers section.
algorithm insert new node (node data, view graph, to all views) (1) create new subject patika node using node data
(2) insert subject patika node to subject patika graph (3) if to all views is true then
(4) for each view view graph
(5) call retrieve from subject(subject patika node, view graph) (6) if subject patika node has
visible owner abstraction in view graph then
(7) add subject patika node to visible owner abstraction (8) else
(9) call retrieve from subject(subject patika node, view graph) (10) if subject patika node has
visible owner abstraction in view graph then
algorithm retrieve from subject (subject patika node, view graph) (1) create a view view patika node of subject patika node
(2) set subject-view relation between view patika node and subject patika node (3) insert view patika node to view graph
(4) for each incident edge subject edge and
neighbor neighbor node of subject patika node (5) if neighbor node has a view in view graph then (6) create a view view edge of subject edge
(7) set subject-view relation between view edge and subject edge (8) insert view edge to view graph
4.5.1.1 Insert New Simple State
If the node to be inserted is a simple state, then an associated bioentity is needed. Considering the bioentity graph window, the cases are as follows:
• New Bioentity is created: A bioentity subject in the subject bioentity graph
is created and associated with the newly created node. Consequently, view of this new bioentity in the bioentity graph manager is automatically cre-ated as an isolcre-ated node
• The bioentity exists in the subject bioentity graph:
• The bioentity is associated with any node in the view: Nothing
signifi-cant happens in the bioentity graph other than the necessary associations between the newly created node and the bioentity.
4.5.1.2 Insert New Interaction
During creation of an interaction, if there is an associated bioentity graph man-ager with the current graph window, then the corresponding bioentiy nodes are connected by an edge if there is not any edge between them.
CHAPTER 4. SUBJECT - VIEW MECHANISM 27
4.5.1.3 Insert New Abstraction
The user either explicitly creates a new abstraction using a specific wizard or selects a set of nodes and they use GET 5.5 facility to define a new abstraction. This Abstraction is inserted to the subject and in the active view a pointer to this abstraction is kept.
4.5.1.4 Insert New Bioentity
If we keep one bioentity graph per mechanistic graph manager and then insert a new bioentity into the bioentity graph without an associated state, then the subset invariant is violated. In order to resolve this conflict we keep one bientity graph per subject and highlight the bioentities according to the active view in the editor. This solution assumes, that such a bioentity graph will not be too large to visualize.
4.5.1.5 Retrieve Existing Object
Sometimes it happens to be the case that a specific view graph manager does not have a graph object, which in fact exists in the subject graph and the user may want to see this object in the view. Therefore we also provided the user with the facility populate a view by retrieving an object from the subject graph to the current view or optionally to all existing views. In this case, new view(s) of the existing object is created and attached to the existing subject. Note that the interaction invariant enforces the automatic retrieval of the interactions if their source and target nodes are present in a specific view.
4.5.2
Remove
• The user may just remove an object from a graph window, then it remains
in the subject graph and also in the database. Only the existing view object is deleted and detached from its subject.
• If the user wants to delete a subject node, then the subject and all its views
are deleted from the client application but it still remains in the central the database.
• Removal of an object from database is an advanced issue, therefore it is a
concern of a biological expert. If a user believes that a node or and edge must be removed from the database, then they simply set the removed tag of the object to true. Upon a submission of the subject pathway graph, it is delivered to the associated expert and validated. Upon expert validation, the object can be removed from the database. You can refer to [10] for detailed information about user types and submission process.
4.5.3
Example Session
In this section we are going to illustrate an example session, which utilizes our framework.
CHAPTER 4. SUBJECT - VIEW MECHANISM 29
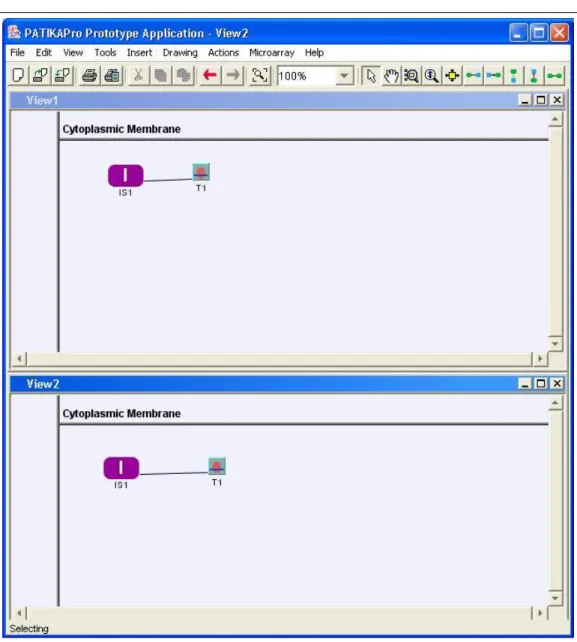
Figure 4.7: Incomplete state IS1, simple transition T1 and a substrate edge between them are created and propagated to all views.
Figure 4.8: Simple state S1 and S2 are created via View1 and View2, respectively. Note that they are not propagated to other views.
CHAPTER 4. SUBJECT - VIEW MECHANISM 31
Figure 4.9: Homology state HS1 and homology transition HT1 are created via View1 and View2, respectively. Note that they are not propagated to other views.
Figure 4.10: IS1 in View2 is expanded and S3, T2, S4, a substrate and a product edge are created in IS1.
CHAPTER 4. SUBJECT - VIEW MECHANISM 33
Figure 4.11: IS1 in View1 is expanded. Note that the modifications in Figure 4.10 are reflected to View1 automatically, due to the abstraction constraint.
Figure 4.12: Homology state HS1 and its incident activation edge is inserted into View1. Incomplete Transition IT1 is inserted into HS1 and an inhibition edge is inserted between IT1 and T1. Similarly, HT1 and S5 are inserted into View2 with inhibition and activation edges. These operations are not reflected to other views.
CHAPTER 4. SUBJECT - VIEW MECHANISM 35
Chapter 5
Conclusion
In this thesis, a single subject-multiple view framework for pathway graphs is presented. Due to the large amount of genomic data, we hope that this this framework will be extensively used in order to manage the complexity of pathway graphs. It will let the user focus on a subset of the pathway data of their own interest.
The window coordination mechanism is designed in such a way that biological invariants remain satisfied upon a modification in the subject pathway graph.
The framework promises to improve user performance and enhance discovery of unforeseen interactions. Applying different coloring schemes on the same graph in different views can enable the user to inspect the genomic data from different point of views. They should also be able to filter the data according to different fields, tissues and phases [9].
Being a neatly isolated component of PATIKA software [1] our framework can easily be plugged in and out, maintained, extended for future versions.
5.1
Future work
For the time being, all the topological operations regarding the subject graph and two kinds of view graphs: mechanistic graph and bioentity graph, are fully functional. The abstraction window, holo representation mechanism and ubique state handling have been designed but due to the time constraints they are not implemented yet.
Bibliography
[1] PATIKA project. Bilkent University, Center for Bioinformatics, Ankara, Turkey. http://www.patika.org.
[2] M.I. Arnone and E.H. Davidson. The hardwiring of development: or-ganization and function of genomic regulatory systems. Development,
124(10):1851–1864, 1997.
[3] G.D. Bader, I. Donaldson, C. Wolting, B.F. Ouellette, T. Pawson, and C.W. Hogue. BIND–The Biomolecular Interaction Network Database. Nucleic
Acids Research, 29(1):242–245, 2001.
[4] Michelle Q. Wang Baldonado, Allison Woodruff, and Allan Kuchinsky. Guidelines for using multiple views in information visualization. In Advanced
Visual Interfaces, pages 110–119, 2000.
[5] BBID. Biological biochemical image database, 2001. http://bbid.grc.nia.nih.gov.
[6] BioCarta. Charting pathways of life, 2001. http://www.biocarta.com. [7] BPC. Biochemical pathways chart, 2001.
[8] A. Buja, D. Cook, and D. Swayne. Interactive high-dimensional data visu-alization, 1996.
[9] E. Demir, O. Babur, U. Dogrusoz, A. Gursoy, A. Ayaz, G. Gulesir, G. Ni-sanci, and R. Cetin-Atalay. An ontology for collaborative construction and analysis of cellular pathways. To appear in Bioinformatics, 2003.
[10] E. Demir, O. Babur, U. Dogrusoz, A. Gursoy, G. Nisanci, R. Cetin-Atalay, and M. Ozturk. PATIKA: An integrated visual environment for collaborative construction and analysis of cellular pathways. Bioinformatics, 18(7):996– 1003, 2002.
[11] R. Diestel. Graph Theory. Springer - Verlag, New York, 2000.
[12] R. Johnson J. Vlissides E. Gamma, R. Helm. Design Patterns: Elements of
Reusable Object-Oriented Software. AddisonWesley: Reading, MA, 1994.
[13] K. Fukuda and T. Takagi. Knowledge representation of signal transduction pathways. Bioinformatics, 17(9):829–837, 2001.
[14] B. Gen¸c. A framework for complexty management in graph visualization. Master’s thesis, Department of Computer Engineering, Bilkent University, Ankara, Turkey, 2002.
[15] I. Herman, G. Melan¸con, and M. S. Marshall. Graph visualization and nav-igation in information visualization: A survey. IEEE Transactions on
Visu-alization and Computer Graphics, 6(1):24–43, 2000.
[16] K. Sugiyama and K. Misue. A Generic Compound Graph Visual-izer/Manipulator: D-ABDUCTOR. In F. J. Brandenburg, editor, Graph
Drawing (Proc. GD ’95), volume 1027 of Lecture Notes in Computer Sci-ence, pages 500–503. Springer-Verlag, 1995.
[17] Ivan A. Lisitsyn and Victor N. Kasyanov. Higres - Visualization system for clustered graphs and graph algorithms. In Jan Kratochv´ıl, editor, Graph
Drawing (Proc. GD ’99), volume 1731 of Lecture Notes in Computer Science,
pages 82–89. Springer-Verlag, 1999.
[18] H. H. McAdams and A. Arkin. Stochastic mechanisms in gene expression.
Proceedings of the National Academy of Sciences, 94(3):814–819, 1997.
[19] G.L. Miklos and G.M. Rubin. The role of the genome project in determining gene function: insights from model organisms. Cell, 86(4):521–529, 1996. [20] C. North and B. Schneiderman. A taxonomy of multiple window
BIBLIOGRAPHY 41
[21] C. North and B. Shneiderman. Snap-together visualization: A user interface for coodinating visualizations via relational schemata. In Advanced Visual
Interfaces, pages 128–135, 2000.
[22] Table Of. Linkwinds user’s guide the linked windows interactive data system (version 2.3).
[23] A. Regev, W. Silverman, and E. Shapiro. Representation and simulation of biochemical processes using the pi-calculus process algebra. In Pacific
Symposium on Biocomputing, volume 6, pages 459–470, 2001.
[24] W. B. Salamonsen, K. Y. C. Mok, P. Kolatkar, and S. Subbiah. BioJAKE: A tool for the creation, visualization and manipulation of metabolic pathways. In Pacific Symposium on Biocomputing, pages 392–400, Hawaii, January 1999.
[25] G. Sander. Graph Layout Through the VCG Tool. In R. Tamassia and I.G. Tollis, editors, Graph Drawing (Proc. GD ’94), volume 894 of Lecture Notes
in Computer Science, pages 194–295. Springer-Verlag, 1995.
[26] M. Sarkar and M. H. Brown. Graphical fisheye views. Communications of
the ACM, 37(12):73–84, 1994.
[27] J. C. Schaff and L. M. Loew. The virtual cell. In R. B. Altman, A. K. Dunker, L. Hunter, and T. E. Klein, editors, Pacific Symposium on Biocomputing, volume 4, pages 228–239, Singapore, 1999. World Scientific Press.
[28] SPAD. Signaling PAthway Database, 2001. http://www.grt.kyushu-u.ac.jp/spad/index.html.
[29] T. Takai-Igarashi and T. Kaminuma. A pathway finding system for the cell signaling networks database. In Silico Biology, 1:129–146, 1999.
[30] Graph Layout Toolkit and Graph Editor Toolkit User’s Guide and Ref-erence Manual. Tom Sawyer Software, Oakland, CA, USA, 1992-2002. http://www.tomsawyer.com.
[31] M. Tomita, K. Hashimoto, K. Takahashi, T. S. Shimizu, Y. Matsuzaki, F. Miyoshi, K. Saito, S. Tanida, K. Yugi, J. C. Venter, and C. A. Hutchison 3rd. ECELL: Software environment for wholecell simulation. Bioinformatics, 15(1):72–84, 1999.
[32] E. Wingender, X. Chen, R. Hehl, H. Karas, I. Liebich, V. Matys, T. Mein-hardt, M. Pr, I. Reuter, and F. Schacherer. TRANSFAC: An integrated system for gene expression regulation. Nucleic Acids Research, 28:316–319, 2000.
Appendix A
Class Structure and
Implementation
The current PATIKA project has more than 30 packages and approximately 350 classes. It is written in pure Java in an object-oriented fashion. In the following sections, we are going to describe how we composed our framework into this pack-age pool. We have chosen the term subject instead of observable and view instead of observer, because it complies better with the semantics of our application. As we did not use java/util/{observer,observable} interfaces, it also made sense to choose different terms to avoid confusion.
A.1
Subject - View Mechanism
The contents of client/editor/util package (Figure A.1) isolates the necessary classes for upgrading a regular graph object to an observer or observable.
The classes implementing subject and view interfaces are enforced to aggregate a view manager and subject manager, respectively. Designing classes instead of these interfaces wouldn’t work because the graph object classes have their own inheritance hierarchy starting from GET/J, and Java don’t support multiple
APPENDIX A. CLASS STRUCTURE AND IMPLEMENTATION 45
inheritance. Therefore we simply tried to isolate and modularize subject-view relation by one object composition.
As it is seen in Figure A.1, both subject and view managers have their own in-heritance hierarchy for the specific needs of their composing object. For instance, a subject graph composes a patika graph subject manager, which is specialized according to graph operations such as insertion and removal.
Every subject manager keeps a reference to its owner subject and list of refer-ences to view managers. On the other hand, every view manager keeps a reference to its owner view and to a specific subject manager. A subject and its views can communicate by navigating these links.
A.1.1
The sgraph Package
The contents of client/sgraph package (Figure A.2) define the subject level ele-ments of PATIKA ontology.
The root level classes in this hierarchy extend and customize abstract level GET/J classes [30] (e.g., SPatikaNode extends from TSNode), so that they can be utilized in the GET/J. Besides this, every instance of these classes implement subject interface and aggregate a specific subject manager.
Regarding the classes, there is a one-to-one correspondence between a subject and view. For instance, the views of an SComplex object can only be an arbitrary number of VComplex objects and vice versa. Associating different views with different subjects is not allowed via programmatic type checking and assertions.
A.1.2
The vgraph Package
The contents of client/editor/vgraph package (Figure A.3) define the view level elements of PATIKA ontology.
Figure A.2: This package contains the subject level implementation of PATIKA ontology.
APPENDIX A. CLASS STRUCTURE AND IMPLEMENTATION 47
Figure A.3: This package contains the view level implementation of PATIKA ontology.
The root level classes in this hierarchy extend and customize editor level GET/J classes [30] (e.g. VPatikaNode extends from TSENode), so that they can be utilized in the GET/J. Besides, every instance of these classes implement view interface and aggregate a specific view manager.
![Figure 2.1: A compound graph CG, and its corresponding components: graph G and rooted tree T (reprinted from [13]).](https://thumb-eu.123doks.com/thumbv2/9libnet/5757538.116387/16.892.188.774.256.948/figure-compound-graph-corresponding-components-graph-rooted-reprinted.webp)