FTIR Spectroscopic Characterization of NO
xSpecies Adsorbed on ZrO
2and ZrO
2-SO4 2-Margarita Kantcheva* and Erkan Z. CiftlikliDepartment of Chemistry, Bilkent UniVersity, 06533 Bilkent, Ankara, Turkey ReceiVed: September 20, 2001; In Final Form: January 7, 2002
The nature of the NOx species produced during the adsorption of NO at room temperature and during its coadsorption with oxygen on pure and sulfated zirconia has been investigated by means of in situ FTIR spectroscopy. The adsorption of NO on both samples occurs through disproportionation leading to the formation of nitrous acid; water molecules; nitro species; and anionic nitrosyls, NO-. A mechanism for the formation of these adsorption forms is proposed. The NO-species are stable on the surface of zirconia, whereas on the sulfated sample, they are readily oxidized by the SO42- groups. The process of NO disproportionation is favored by wet surfaces and occurs with participation of the tribridged (ZrO2) and terminal (ZrO2-SO42-) hydroxyl groups. Coadsorption of NO and O2on pure zirconia leads to the formation of various kinds of nitrate species. The presence of sulfate ions reduces the amount of surface nitrates and decreases their thermal stability. An analysis of the combination bands of the nitrate species shows that this spectral region can be used for structural identification of bidentate and bridged nitrates.
Introduction
Recent reports have shown that transition metal oxides supported on zirconia and sulfated zirconia are promising for the selective catalytic reduction (SCR) of NO with NH31,2and hydrocarbons.2-8Delahay et al.5,6demonstrated that the promo-tion of Cu/ZrO2(an effective catalyst in the SCR of NO with decane) by sulfate ions widens the temperature range of selectivity toward dinitrogen. To understand the effect of sulfation in the mechanism of NO reduction, it is important to obtain information on the nature and stability of the NOxspecies adsorbed on the surface of pure and sulfated zirconia. Infrared (IR) spectroscopy is one of the most powerful tools for the in situ characterization of adsorbed NOx species on catalytic materials.9However, only a few studies9have appeared employ-ing this technique for the identification of surface NOxspecies produced during the adsorption of NO and during its coadsorp-tion with oxygen on pure and sulfated zirconia.
In general, the interaction of NO with the surface of zirconia results in the formation of small amounts of NOx surface compounds. Some authors10-12 have reported that nitrosylic species cannot form on pure zirconia, whereas others13-15have observed coordination of NO to Zr4+sites. Mononitrosyl species have been found on sulfated zirconia.11The adsorption of NO on pure10-15and sulfated zirconia11at room temperature gives rise to bands in the nitrito-nitrato region. However, interpreta-tions of the bands in this region are quite contradictory. A typical example is the band at 1180-1190 cm-1, which has been assigned to nitrite10,13,15or nitrate12species. Greater amounts of NOx species (mainly nitrates and nitrites) on ZrO2 are observed when NO and O2are coadsorbed at room tempera-ture.12,15 In the identification of NO
x species adsorbed on zirconia, the use of bands in the combination region can be helpful.12The adsorption of NO12and NO/O
2coadsorption cause alterations in the hydroxyl groups of zirconia,12,15and formation of chelated or bridged species of the type (O2NO-H)δ- has
been proposed.15To the best of our knowledge, no IR data on the coadsorption of NO and O2on sulfated zirconia are available. In this study, FTIR spectroscopy has been used to identify and determine the thermal stability of surface NOxcompounds on pure and sulfated zirconia. An attempt is made at under-standing the processes leading to the formation of NO and NO/ O2adsorption forms.
Experimental Section
Sample Preparation. Zirconia was prepared by hydrolysis
of ZrCl4 (Merck, for synthesis) with a concentrated (25%) solution of ammonia. During the dissolution of ZrCl4in water (0.3 mol of ZrCl4/L) and addition of ammonia solution, the temperature was kept below 343 K. The precipitate was washed thoroughly with deionized water to remove the chloride ions, dried at 393 K for 12 h, and calcined for 4 h at 773 K. The BET surface area was 69 m2/g, and according to XRD, the substance was predominantly monoclinic (94%).
Sulfated zirconia was prepared by impregnation of the calcined material with a solution of (NH4)2SO4. The nominal content of the sulfate ions was 3.8 wt %. The sulfatation of zirconia led to an increase in the content of the tetragonal phase (10%). The BET surface area of this material was 83 m2/g.
Surface Area Measurements and X-ray Diffraction. The
BET surface areas of the samples (dehydrated at 523 K) were measured by nitrogen adsorption at 77 K using a MONOSORP apparatus from Quanto Chrome. XRD analysis was performed on a Rigaku Miniflex diffractometer with Ni-filtered Cu KR radiation under ambient conditions. The crystallographic phase composition was calculated using the method of Toraya et al.16 Infrared Spectroscopy. The FTIR spectra were recorded on
a Bomem MB 102 FTIR (Hartman & Braun) spectrometer equipped with a liquid-nitrogen-cooled MCT detector at a resolution of 4 cm-1(128 scans). A specially designed IR cell allowed registration of the spectra at ambient temperature and catalyst activation at higher temperatures. The cell was con-nected to a vacuum/adsorption apparatus. Self-supporting disks (0.044 g/cm2) were used for the FTIR studies. These specimens * To whom correspondence should be addressed. Phone: +90 (312) 290
2451. Fax: +90 (312) 266 4579. E-mail: [email protected].
10.1021/jp013593o CCC: $22.00 © 2002 American Chemical Society Published on Web 03/21/2002
Downloaded via BILKENT UNIV on January 1, 2019 at 19:08:08 (UTC).
were activated by heating for 1 h in a vacuum at 673 K and in oxygen (133 kPa) at the same temperature, followed by evacuation for 1 h at room temperature (standard activation). Z denotes the zirconia sample that was subject to the standard activation procedure, whereas the designation ZS is used for the sulfated material. The partially deuterioxylated sample was obtained by introduction to the activated zirconia of water vapor (173.3 Pa) containing 50% deuterium, followed by evacuation at room temperature for 15 min and heating in a vacuum for 1 h at 623 K. The sample treated in this way is denoted ZHD. The hydroxylated sample of zirconia (notation ZH) was prepared by the same procedure using water vapor with normal isotopic content. The spectra of the activated samples (taken at ambient temperature) were used as a background reference. The spectra of the samples that were subject to treatment at elevated temperatures were recorded after the IR cell had been cooled to room temperature. All of the spectra presented (except those in Figure 1) were obtained by subtraction of the corresponding background reference.
The computer peak fittings were performed using the minimum number of peaks and fixed peaks positions based on the original spectra. The sum of the squares of the deviations between the experimental points and fit values was less than 10-4.
The CO (99.95%, BOC, Ankara) used was passed through a trap cooled by liquid nitrogen before admission to the IR cell. The purity of NO gas was 99.9% (Air Products).
Results and Discussion
FTIR Spectra of the Activated Samples and Adsorbed CO.
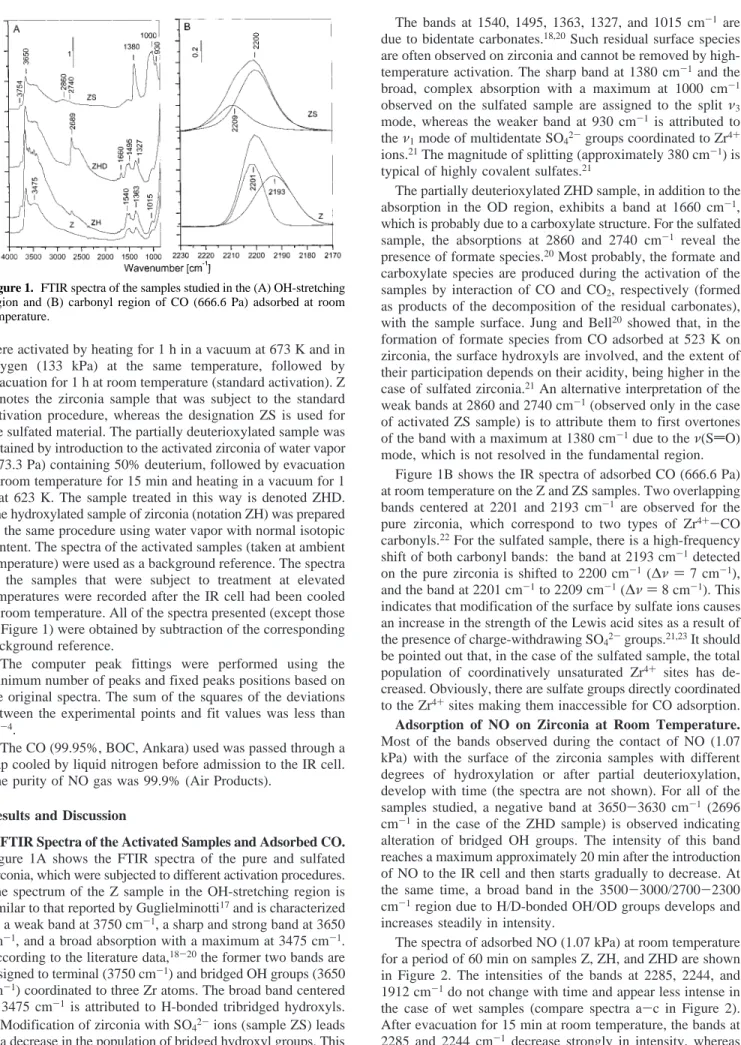
Figure 1A shows the FTIR spectra of the pure and sulfated zirconia, which were subjected to different activation procedures. The spectrum of the Z sample in the OH-stretching region is similar to that reported by Guglielminotti17and is characterized by a weak band at 3750 cm-1, a sharp and strong band at 3650 cm-1, and a broad absorption with a maximum at 3475 cm-1. According to the literature data,18-20the former two bands are assigned to terminal (3750 cm-1) and bridged OH groups (3650 cm-1) coordinated to three Zr atoms. The broad band centered at 3475 cm-1 is attributed to H-bonded tribridged hydroxyls. Modification of zirconia with SO42-ions (sample ZS) leads to a decrease in the population of bridged hydroxyl groups. This indicates that sulfate ions have replaced some of the three-coordinated OH groups.
The bands at 1540, 1495, 1363, 1327, and 1015 cm-1 are due to bidentate carbonates.18,20Such residual surface species are often observed on zirconia and cannot be removed by high-temperature activation. The sharp band at 1380 cm-1and the broad, complex absorption with a maximum at 1000 cm-1 observed on the sulfated sample are assigned to the split ν3 mode, whereas the weaker band at 930 cm-1 is attributed to theν1mode of multidentate SO42-groups coordinated to Zr4+ ions.21The magnitude of splitting (approximately 380 cm-1) is typical of highly covalent sulfates.21
The partially deuterioxylated ZHD sample, in addition to the absorption in the OD region, exhibits a band at 1660 cm-1, which is probably due to a carboxylate structure. For the sulfated sample, the absorptions at 2860 and 2740 cm-1 reveal the presence of formate species.20Most probably, the formate and carboxylate species are produced during the activation of the samples by interaction of CO and CO2, respectively (formed as products of the decomposition of the residual carbonates), with the sample surface. Jung and Bell20showed that, in the formation of formate species from CO adsorbed at 523 K on zirconia, the surface hydroxyls are involved, and the extent of their participation depends on their acidity, being higher in the case of sulfated zirconia.21An alternative interpretation of the weak bands at 2860 and 2740 cm-1(observed only in the case of activated ZS sample) is to attribute them to first overtones of the band with a maximum at 1380 cm-1due to theν(SdO) mode, which is not resolved in the fundamental region.
Figure 1B shows the IR spectra of adsorbed CO (666.6 Pa) at room temperature on the Z and ZS samples. Two overlapping bands centered at 2201 and 2193 cm-1 are observed for the pure zirconia, which correspond to two types of Zr4+-CO carbonyls.22For the sulfated sample, there is a high-frequency shift of both carbonyl bands: the band at 2193 cm-1detected on the pure zirconia is shifted to 2200 cm-1 (∆ν ) 7 cm-1), and the band at 2201 cm-1to 2209 cm-1(∆ν ) 8 cm-1). This indicates that modification of the surface by sulfate ions causes an increase in the strength of the Lewis acid sites as a result of the presence of charge-withdrawing SO42-groups.21,23It should be pointed out that, in the case of the sulfated sample, the total population of coordinatively unsaturated Zr4+ sites has de-creased. Obviously, there are sulfate groups directly coordinated to the Zr4+sites making them inaccessible for CO adsorption. Adsorption of NO on Zirconia at Room Temperature.
Most of the bands observed during the contact of NO (1.07 kPa) with the surface of the zirconia samples with different degrees of hydroxylation or after partial deuterioxylation, develop with time (the spectra are not shown). For all of the samples studied, a negative band at 3650-3630 cm-1 (2696 cm-1 in the case of the ZHD sample) is observed indicating alteration of bridged OH groups. The intensity of this band reaches a maximum approximately 20 min after the introduction of NO to the IR cell and then starts gradually to decrease. At the same time, a broad band in the 3500-3000/2700-2300 cm-1region due to H/D-bonded OH/OD groups develops and increases steadily in intensity.
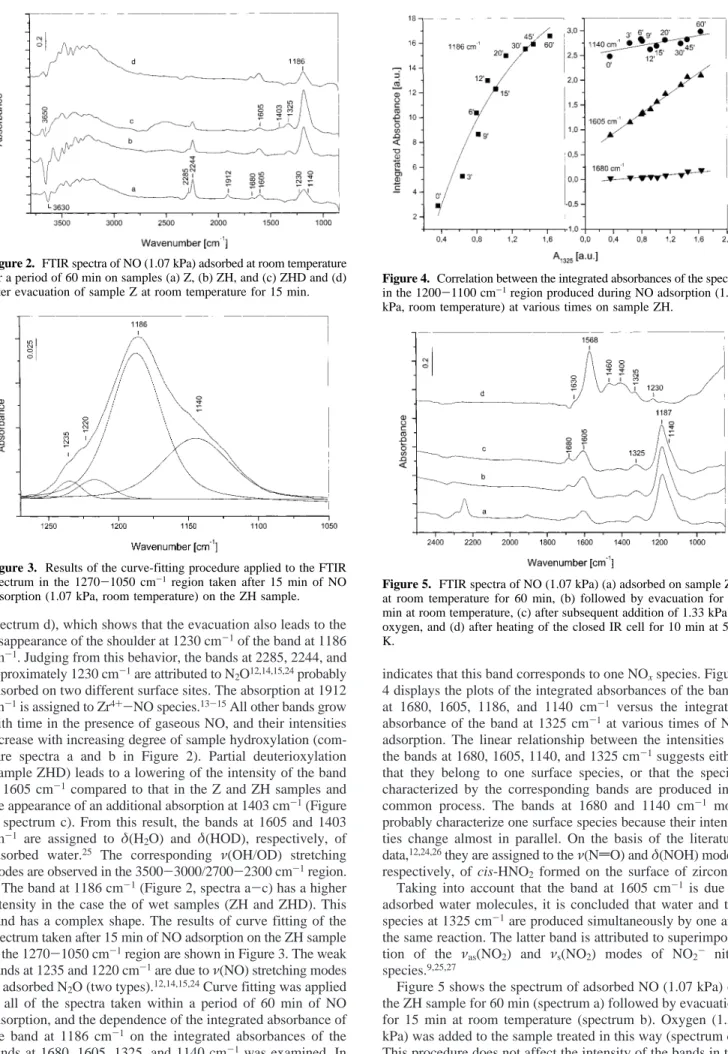
The spectra of adsorbed NO (1.07 kPa) at room temperature for a period of 60 min on samples Z, ZH, and ZHD are shown in Figure 2. The intensities of the bands at 2285, 2244, and 1912 cm-1do not change with time and appear less intense in the case of wet samples (compare spectra a-c in Figure 2). After evacuation for 15 min at room temperature, the bands at 2285 and 2244 cm-1 decrease strongly in intensity, whereas the band at 1912 cm-1 disappears from the spectrum. This behavior is illustrated in the spectrum of sample Z (Figure 2, Figure 1. FTIR spectra of the samples studied in the (A) OH-stretching
region and (B) carbonyl region of CO (666.6 Pa) adsorbed at room temperature.
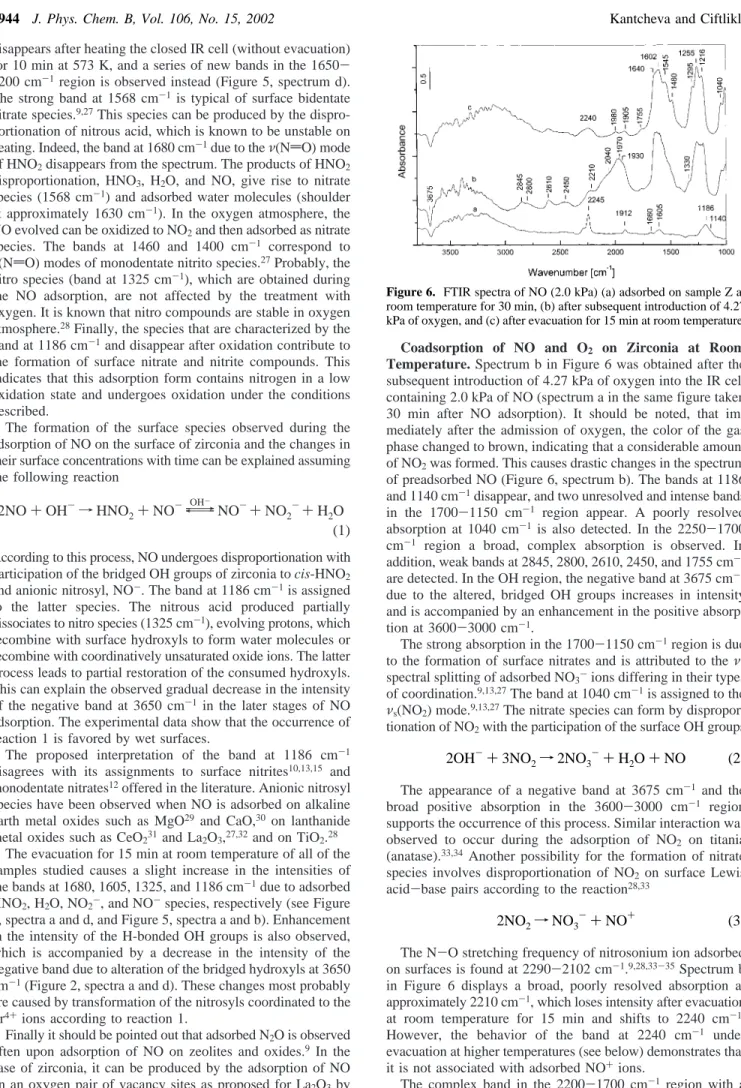
spectrum d), which shows that the evacuation also leads to the disappearance of the shoulder at 1230 cm-1of the band at 1186 cm-1. Judging from this behavior, the bands at 2285, 2244, and approximately 1230 cm-1are attributed to N2O12,14,15,24probably adsorbed on two different surface sites. The absorption at 1912 cm-1is assigned to Zr4+-NO species.13-15All other bands grow with time in the presence of gaseous NO, and their intensities increase with increasing degree of sample hydroxylation (com-pare spectra a and b in Figure 2). Partial deuterioxylation (sample ZHD) leads to a lowering of the intensity of the band at 1605 cm-1compared to that in the Z and ZH samples and the appearance of an additional absorption at 1403 cm-1(Figure 2, spectrum c). From this result, the bands at 1605 and 1403 cm-1 are assigned to δ(H2O) and δ(HOD), respectively, of adsorbed water.25 The corresponding ν(OH/OD) stretching modes are observed in the 3500-3000/2700-2300 cm-1region. The band at 1186 cm-1(Figure 2, spectra a-c) has a higher intensity in the case the of wet samples (ZH and ZHD). This band has a complex shape. The results of curve fitting of the spectrum taken after 15 min of NO adsorption on the ZH sample in the 1270-1050 cm-1region are shown in Figure 3. The weak bands at 1235 and 1220 cm-1are due toν(NO) stretching modes of adsorbed N2O (two types).12,14,15,24Curve fitting was applied to all of the spectra taken within a period of 60 min of NO adsorption, and the dependence of the integrated absorbance of the band at 1186 cm-1 on the integrated absorbances of the bands at 1680, 1605, 1325, and 1140 cm-1 was examined. In all of these cases, no linear correlation was found, which
indicates that this band corresponds to one NOxspecies. Figure 4 displays the plots of the integrated absorbances of the bands at 1680, 1605, 1186, and 1140 cm-1 versus the integrated absorbance of the band at 1325 cm-1at various times of NO adsorption. The linear relationship between the intensities of the bands at 1680, 1605, 1140, and 1325 cm-1suggests either that they belong to one surface species, or that the species characterized by the corresponding bands are produced in a common process. The bands at 1680 and 1140 cm-1 most probably characterize one surface species because their intensi-ties change almost in parallel. On the basis of the literature data,12,24,26they are assigned to theν(NdO) and δ(NOH) modes, respectively, of cis-HNO2 formed on the surface of zirconia. Taking into account that the band at 1605 cm-1 is due to adsorbed water molecules, it is concluded that water and the species at 1325 cm-1are produced simultaneously by one and the same reaction. The latter band is attributed to superimposi-tion of the νas(NO2) and νs(NO2) modes of NO2- nitro species.9,25,27
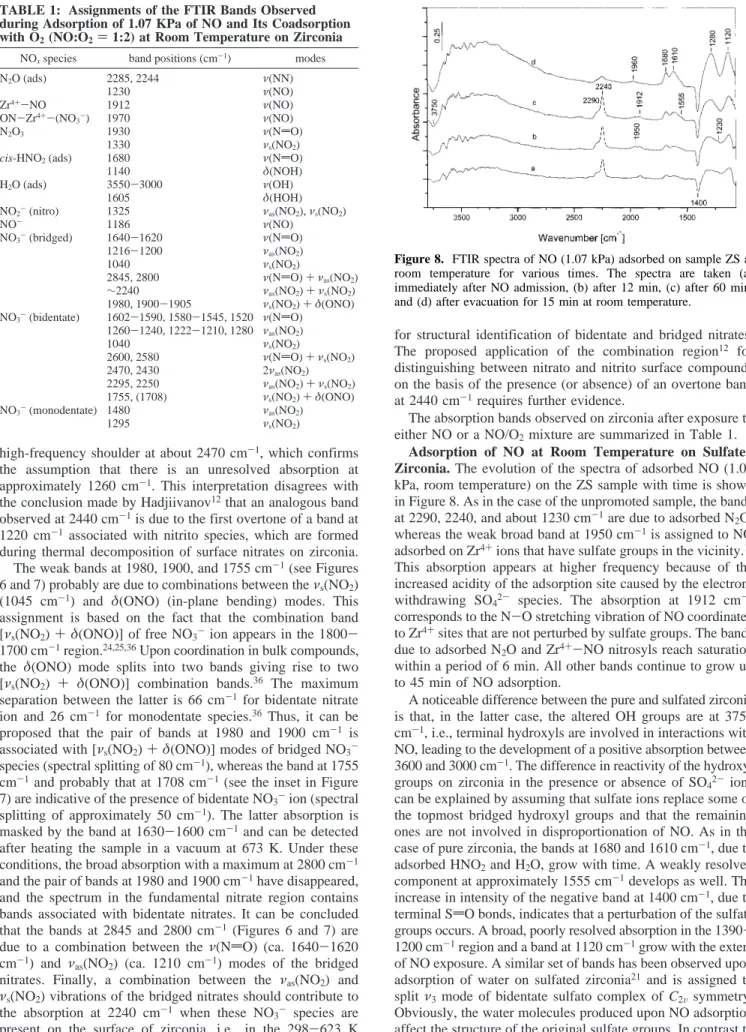
Figure 5 shows the spectrum of adsorbed NO (1.07 kPa) on the ZH sample for 60 min (spectrum a) followed by evacuation for 15 min at room temperature (spectrum b). Oxygen (1.33 kPa) was added to the sample treated in this way (spectrum c). This procedure does not affect the intensity of the bands in the 2500-1000 cm-1 region. However, the band at 1186 cm-1 Figure 2. FTIR spectra of NO (1.07 kPa) adsorbed at room temperature
for a period of 60 min on samples (a) Z, (b) ZH, and (c) ZHD and (d) after evacuation of sample Z at room temperature for 15 min.
Figure 3. Results of the curve-fitting procedure applied to the FTIR spectrum in the 1270-1050 cm-1region taken after 15 min of NO adsorption (1.07 kPa, room temperature) on the ZH sample.
Figure 4. Correlation between the integrated absorbances of the species in the 1200-1100 cm-1region produced during NO adsorption (1.07 kPa, room temperature) at various times on sample ZH.
Figure 5. FTIR spectra of NO (1.07 kPa) (a) adsorbed on sample ZH at room temperature for 60 min, (b) followed by evacuation for 15 min at room temperature, (c) after subsequent addition of 1.33 kPa of oxygen, and (d) after heating of the closed IR cell for 10 min at 573 K.
disappears after heating the closed IR cell (without evacuation) for 10 min at 573 K, and a series of new bands in the 1650-1200 cm-1 region is observed instead (Figure 5, spectrum d). The strong band at 1568 cm-1 is typical of surface bidentate nitrate species.9,27This species can be produced by the dispro-portionation of nitrous acid, which is known to be unstable on heating. Indeed, the band at 1680 cm-1due to theν(NdO) mode of HNO2disappears from the spectrum. The products of HNO2 disproportionation, HNO3, H2O, and NO, give rise to nitrate species (1568 cm-1) and adsorbed water molecules (shoulder at approximately 1630 cm-1). In the oxygen atmosphere, the NO evolved can be oxidized to NO2and then adsorbed as nitrate species. The bands at 1460 and 1400 cm-1 correspond to ν(NdO) modes of monodentate nitrito species.27Probably, the nitro species (band at 1325 cm-1), which are obtained during the NO adsorption, are not affected by the treatment with oxygen. It is known that nitro compounds are stable in oxygen atmosphere.28Finally, the species that are characterized by the band at 1186 cm-1and disappear after oxidation contribute to the formation of surface nitrate and nitrite compounds. This indicates that this adsorption form contains nitrogen in a low oxidation state and undergoes oxidation under the conditions described.
The formation of the surface species observed during the adsorption of NO on the surface of zirconia and the changes in their surface concentrations with time can be explained assuming the following reaction
According to this process, NO undergoes disproportionation with participation of the bridged OH groups of zirconia to cis-HNO2 and anionic nitrosyl, NO-. The band at 1186 cm-1is assigned to the latter species. The nitrous acid produced partially dissociates to nitro species (1325 cm-1), evolving protons, which recombine with surface hydroxyls to form water molecules or recombine with coordinatively unsaturated oxide ions. The latter process leads to partial restoration of the consumed hydroxyls. This can explain the observed gradual decrease in the intensity of the negative band at 3650 cm-1 in the later stages of NO adsorption. The experimental data show that the occurrence of reaction 1 is favored by wet surfaces.
The proposed interpretation of the band at 1186 cm-1 disagrees with its assignments to surface nitrites10,13,15 and monodentate nitrates12offered in the literature. Anionic nitrosyl species have been observed when NO is adsorbed on alkaline earth metal oxides such as MgO29 and CaO,30on lanthanide metal oxides such as CeO231and La2O3,27,32and on TiO2.28
The evacuation for 15 min at room temperature of all of the samples studied causes a slight increase in the intensities of the bands at 1680, 1605, 1325, and 1186 cm-1due to adsorbed HNO2, H2O, NO2-, and NO-species, respectively (see Figure 2, spectra a and d, and Figure 5, spectra a and b). Enhancement in the intensity of the H-bonded OH groups is also observed, which is accompanied by a decrease in the intensity of the negative band due to alteration of the bridged hydroxyls at 3650 cm-1(Figure 2, spectra a and d). These changes most probably are caused by transformation of the nitrosyls coordinated to the Zr4+ions according to reaction 1.
Finally it should be pointed out that adsorbed N2O is observed often upon adsorption of NO on zeolites and oxides.9In the case of zirconia, it can be produced by the adsorption of NO on an oxygen pair of vacancy sites as proposed for La2O3by Huang et al.27
Coadsorption of NO and O2 on Zirconia at Room
Temperature. Spectrum b in Figure 6 was obtained after the
subsequent introduction of 4.27 kPa of oxygen into the IR cell containing 2.0 kPa of NO (spectrum a in the same figure taken 30 min after NO adsorption). It should be noted, that im-mediately after the admission of oxygen, the color of the gas phase changed to brown, indicating that a considerable amount of NO2was formed. This causes drastic changes in the spectrum of preadsorbed NO (Figure 6, spectrum b). The bands at 1186 and 1140 cm-1disappear, and two unresolved and intense bands in the 1700-1150 cm-1 region appear. A poorly resolved absorption at 1040 cm-1 is also detected. In the 2250-1700 cm-1 region a broad, complex absorption is observed. In addition, weak bands at 2845, 2800, 2610, 2450, and 1755 cm-1 are detected. In the OH region, the negative band at 3675 cm-1 due to the altered, bridged OH groups increases in intensity and is accompanied by an enhancement in the positive absorp-tion at 3600-3000 cm-1.
The strong absorption in the 1700-1150 cm-1region is due to the formation of surface nitrates and is attributed to theν3 spectral splitting of adsorbed NO3-ions differing in their types of coordination.9,13,27The band at 1040 cm-1is assigned to the νs(NO2) mode.9,13,27The nitrate species can form by dispropor-tionation of NO2with the participation of the surface OH groups
The appearance of a negative band at 3675 cm-1 and the broad positive absorption in the 3600-3000 cm-1 region supports the occurrence of this process. Similar interaction was observed to occur during the adsorption of NO2 on titania (anatase).33,34Another possibility for the formation of nitrate species involves disproportionation of NO2on surface Lewis acid-base pairs according to the reaction28,33
The N-O stretching frequency of nitrosonium ion adsorbed on surfaces is found at 2290-2102 cm-1.9,28,33-35Spectrum b in Figure 6 displays a broad, poorly resolved absorption at approximately 2210 cm-1, which loses intensity after evacuation at room temperature for 15 min and shifts to 2240 cm-1. However, the behavior of the band at 2240 cm-1 under evacuation at higher temperatures (see below) demonstrates that it is not associated with adsorbed NO+ions.
The complex band in the 2200-1700 cm-1 region with a maximum at 1970 cm-1 (Figure 6, spectrum b) falls in the 2NO + OH-f HNO2+ NO-{\}OH
-NO-+ NO2-+ H2O (1)
Figure 6. FTIR spectra of NO (2.0 kPa) (a) adsorbed on sample Z at room temperature for 30 min, (b) after subsequent introduction of 4.27 kPa of oxygen, and (c) after evacuation for 15 min at room temperature.
2OH-+ 3NO2f 2NO3 -+ H
2O + NO (2)
spectral region typical for the coordination of NO on strong Lewis acid sites. The assignment of the feature at 1970 cm-1is made by taking into account the behavior of the weak bands at 1980 and 1905 cm-1that are observed after evacuation at room temperature. These bands resist high-temperature vacuum treat-ment (see below) and are not associated with nitrosylic species. The band at 1970 cm-1 appears in the spectrum when large amounts of surface nitrates are present. For this reason, in accordance with the literature data,12we assign this band to Zr4+-NO nitrosyls that have NO
3-species in their coordination sphere, i.e., to the complex (ON)-Zr4+-(NO
3-). The absorption at 1930 cm-1can be attributed to a second (ON)-Zr4+-(NO
3-) species or to adsorbed N2O3. Because evacuation causes simultaneous disappearance of the band positioned at ap-proximately 1330 cm-1, we prefer to assign the features at 1930 and 1330 cm-1toν(NdO) and νs(NO2) modes, respectively, of adsorbed N2O3. This species forms during NO and O2 coadsorption on various oxide systems and is removed easily by evacuation at room temperature.9 The N
2O3 molecule adsorbed on zeolites produces a ν(NdO) stretching vibration in the 1930-1880 cm-1region, theνas(NO2) modes appear at 1590-1550 cm-1, and the modes due toνs(NO2) are detected at 1305-1290 cm-1.9 The shoulder at 2040 cm-1, which disappears after evacuation at room temperature, is tentatively assigned to NO2δ+.
After removal of the gaseous phase by evacuation at room temperature, the bands in the nitrate region are better resolved (Figure 6, spectrum c). The changes in the two major band envelops in the 1700-1000 cm-1 region suggest that, most probably, some desorption/decomposition of the species has occurred. It can be seen that the bands at 2610 and 2450 cm-1 appear in the spectrum with reduced intensity. The bands at 2845 and 2800 cm-1 are covered by the absorption due to H-bonded OH groups, and their behavior under these conditions cannot be followed. In addition, two weak bands at 1980 and 1905 cm-1 are detected.
An attempt to assign the bands in the nitrate region was made by following the changes in the spectra obtained under vacuum treatment at elevated temperatures. Study of the thermal stability of the adsorption forms produced during interaction of zirconia with the NO/O2mixture (Figure 7) shows that the majority of species formed at room temperature are still present after heating in a vacuum for 10 min at 623 K. (The spectra were recorded after the IR cell had been cooled to room temperature). The changes in the shapes and intensities of the nitrate bands indicate that in the temperature range 298-398 K, rearrangement rather than decomposition of the NO3- species has occurred. For example, the band at about 1480 cm-1is not visible after heating at 398 K, but the intensities of the nitrate bands at 1635, 1580, and 1520 cm-1, together with that of the complex band at 1280-1200 cm-1, have increased. An increase in the intensities of the weak bands in the 3000-1700 cm-1region is also detected. Noticeable decomposition of the nitrate species begins at 623 K. After evacuation at 673 K, the absorption in the 3000-1700 cm-1 region becomes very weak, and the bands in the nitrate region appear with strongly reduced intensity. The negative band in the OH region shows that the hydroxyl groups are not completely restored and that some of them are lost during high-temperature evacuation. From the results of the thermal stability and the magnitude of theν3spectral splitting,9,13,27the nitrate bands can be assigned to bridged (1640-1620 and 1216-1200 cm-1), bidentate (1602-1590 and 1260-1240 cm-1, 1580-1545 and 1222-1210 cm-1, 1520 and 1280 cm-1), and monodentate (1480 and 1295 cm-1) species. The weak bands
at 1415 and 1330 cm-1, which are more visible after treatment at 623 K, are attributed to monodentate nitro compounds.27
The weak bands at 2845, 2800, 2610, 2450, 2240, 1980, 1905, and 1755 cm-1(Figures 6 and 7) are due to combination modes of the nitrates species.24These features are detected during NO/ O2 coadsorption, which results in the formation of a large amount of surface nitrate species. This assignment is supported by the experiments showing the thermal stability of nitrate species. The bands in the 3000-1700 cm-1region follow the behavior of the fundamental nitrate bands. Combination bands at 2610, 2580, and 2520 cm-1due to different kinds of nitrates on the surface of zirconia and the overtone band at 2444 cm-1 of nitrito species were also reported by Hadjiivanov.12
It is difficult to propose an unambiguous assignment for the combination bands of the species in the nitrate region because the fundamental bands below 1000 cm-1cannot be detected. We start with the spectrum obtained after evacuation for 10 min at 673 K, which is characterized by the lowest concentration of surface nitrates. The spectrum exhibits bands corresponding to theν3spectral splitting of two types of bidentate nitrates: 1590 [ν(NdO)] and 1222 cm-1 [νas(NO2)] and 1555 [ν(Nd O)] and 1222 cm-1[νas(NO2)]. Theνs(NO2) stretching vibration is at 1045 cm-1. From the inset in Figure 7, it can be seen that the band at 2600 cm-1with a shoulder at 2580 cm-1corresponds to a binary combination between theν(NdO) vibrations at 1590 and 1555 cm-1 and the νs(NO2) mode at 1045 cm-1. The combinations between the νas(NO2) mode at 1222 cm-1 and theνs(NO2) mode at 1045 cm-1give rise to the absorption with a maximum at 2250 cm-1. This band has a high-frequency shoulder positioned at about 2295 cm-1. This implies that the fundamental band at 1222 cm-1 should contain a weaker component at approximately 1260 cm-1, which is the contami-nant band of that at 1590 cm-1. The existence of an unresolved absorption in the region of the band at 1222 cm-1can explain the relatively high intensity of the latter relative to that of the bands at 1590 and 1555 cm-1. The band at 2430 cm-1is the first overtone of the band at 1222 cm-1. Again, this band has a Figure 7. FTIR spectra obtained after heating of sample Z containing preadsorbed NOxspecies for 15 min in a vacuum at various temper-atures. This spectrum (298 K) corresponds to spectrum c in Figure 6.
high-frequency shoulder at about 2470 cm-1, which confirms the assumption that there is an unresolved absorption at approximately 1260 cm-1. This interpretation disagrees with the conclusion made by Hadjiivanov12that an analogous band observed at 2440 cm-1is due to the first overtone of a band at 1220 cm-1 associated with nitrito species, which are formed during thermal decomposition of surface nitrates on zirconia. The weak bands at 1980, 1900, and 1755 cm-1(see Figures 6 and 7) probably are due to combinations between theνs(NO2) (1045 cm-1) and δ(ONO) (in-plane bending) modes. This assignment is based on the fact that the combination band [νs(NO2) +δ(ONO)] of free NO3-ion appears in the 1800-1700 cm-1region.24,25,36Upon coordination in bulk compounds, the δ(ONO) mode splits into two bands giving rise to two [νs(NO2) + δ(ONO)] combination bands.36 The maximum separation between the latter is 66 cm-1for bidentate nitrate ion and 26 cm-1 for monodentate species.36Thus, it can be proposed that the pair of bands at 1980 and 1900 cm-1 is associated with [νs(NO2) +δ(ONO)] modes of bridged NO3 -species (spectral splitting of 80 cm-1), whereas the band at 1755 cm-1 and probably that at 1708 cm-1(see the inset in Figure 7) are indicative of the presence of bidentate NO3-ion (spectral splitting of approximately 50 cm-1). The latter absorption is masked by the band at 1630-1600 cm-1and can be detected after heating the sample in a vacuum at 673 K. Under these conditions, the broad absorption with a maximum at 2800 cm-1 and the pair of bands at 1980 and 1900 cm-1have disappeared, and the spectrum in the fundamental nitrate region contains bands associated with bidentate nitrates. It can be concluded that the bands at 2845 and 2800 cm-1 (Figures 6 and 7) are due to a combination between theν(NdO) (ca. 1640-1620 cm-1) and νas(NO2) (ca. 1210 cm-1) modes of the bridged nitrates. Finally, a combination between the νas(NO2) and νs(NO2) vibrations of the bridged nitrates should contribute to the absorption at 2240 cm-1 when these NO3- species are present on the surface of zirconia, i.e., in the 298-623 K temperature range of evacuation (Figure 7). These considerations show that the combination region of the spectra can be used
for structural identification of bidentate and bridged nitrates. The proposed application of the combination region12 for distinguishing between nitrato and nitrito surface compounds on the basis of the presence (or absence) of an overtone band at 2440 cm-1requires further evidence.
The absorption bands observed on zirconia after exposure to either NO or a NO/O2mixture are summarized in Table 1.
Adsorption of NO at Room Temperature on Sulfated Zirconia. The evolution of the spectra of adsorbed NO (1.07
kPa, room temperature) on the ZS sample with time is shown in Figure 8. As in the case of the unpromoted sample, the bands at 2290, 2240, and about 1230 cm-1are due to adsorbed N2O, whereas the weak broad band at 1950 cm-1is assigned to NO adsorbed on Zr4+ions that have sulfate groups in the vicinity.11 This absorption appears at higher frequency because of the increased acidity of the adsorption site caused by the electron-withdrawing SO42- species. The absorption at 1912 cm-1 corresponds to the N-O stretching vibration of NO coordinated to Zr4+sites that are not perturbed by sulfate groups. The bands due to adsorbed N2O and Zr4+-NO nitrosyls reach saturation within a period of 6 min. All other bands continue to grow up to 45 min of NO adsorption.
A noticeable difference between the pure and sulfated zirconia is that, in the latter case, the altered OH groups are at 3750 cm-1, i.e., terminal hydroxyls are involved in interactions with NO, leading to the development of a positive absorption between 3600 and 3000 cm-1. The difference in reactivity of the hydroxyl groups on zirconia in the presence or absence of SO42- ions can be explained by assuming that sulfate ions replace some of the topmost bridged hydroxyl groups and that the remaining ones are not involved in disproportionation of NO. As in the case of pure zirconia, the bands at 1680 and 1610 cm-1, due to adsorbed HNO2and H2O, grow with time. A weakly resolved component at approximately 1555 cm-1develops as well. The increase in intensity of the negative band at 1400 cm-1, due to terminal SdO bonds, indicates that a perturbation of the sulfate groups occurs. A broad, poorly resolved absorption in the 1390-1200 cm-1region and a band at 1120 cm-1grow with the extent of NO exposure. A similar set of bands has been observed upon adsorption of water on sulfated zirconia21and is assigned to split ν3mode of bidentate sulfato complex of C2Vsymmetry. Obviously, the water molecules produced upon NO adsorption affect the structure of the original sulfate groups. In contrast to the adsorption of NO on pure zirconia, no band at 1186 cm-1 is detected.
TABLE 1: Assignments of the FTIR Bands Observed during Adsorption of 1.07 KPa of NO and Its Coadsorption with O2(NO:O2) 1:2) at Room Temperature on Zirconia
NOxspecies band positions (cm-1) modes
N2O (ads) 2285, 2244 ν(NN) 1230 ν(NO) Zr4+-NO 1912 ν(NO) ON-Zr4+-(NO 3-) 1970 ν(NO) N2O3 1930 ν(NdO) 1330 νs(NO2)
cis-HNO2(ads) 1680 ν(NdO)
1140 δ(NOH)
H2O (ads) 3550-3000 ν(OH)
1605 δ(HOH)
NO2-(nitro) 1325 νas(NO2),νs(NO2)
NO- 1186 ν(NO) NO3-(bridged) 1640-1620 ν(NdO) 1216-1200 νas(NO2) 1040 νs(NO2) 2845, 2800 ν(NdO) + νas(NO2) ∼2240 νas(NO2) +νs(NO2) 1980, 1900-1905 νs(NO2) +δ(ONO) NO3-(bidentate) 1602-1590, 1580-1545, 1520 ν(NdO) 1260-1240, 1222-1210, 1280 νas(NO2) 1040 νs(NO2) 2600, 2580 ν(NdO) + νs(NO2) 2470, 2430 2νas(NO2) 2295, 2250 νas(NO2) +νs(NO2) 1755, (1708) νs(NO2) +δ(ONO) NO3-(monodentate) 1480 νas(NO2) 1295 νs(NO2)
Figure 8. FTIR spectra of NO (1.07 kPa) adsorbed on sample ZS at room temperature for various times. The spectra are taken (a) immediately after NO admission, (b) after 12 min, (c) after 60 min, and (d) after evacuation for 15 min at room temperature.
Evacuation for 15 min at room temperature (Figure 8, spectrum d) leads to an increase in the intensity of both positive and negative bands in the 1700-1000 cm-1 region, which is accompanied by an enhancement of the intensities of the negative band at 3750 cm-1and the positive absorption in the region of the H-bonded OH groups. The bands due to adsorbed N2O (2290 and 2240 cm-1) appear with reduced intensity, and the absorption at 1912 cm-1due to Zr4+-NO species disappears. The band at 1950 cm-1 shifts to 1960 cm-1 and resists evacuation, which confirms that it is associated with NO adsorbed on strong Lewis acid sites.
It is difficult to propose a straightforward interpretation of the experimental results obtained during the adsorption of NO on sulfated zirconia, because of the existence of overlapping bands in the 1500-1000 cm-1region arising from simultaneous alteration of the sulfate groups and formation of NOxadsorbed species. The fact that adsorbed water and nitrous acid are detected implies that a process analogous to that described by reaction 1 occurs in the case of the ZS sample. However, no absorption that can be assigned to an anionic nitrosyl, NO-, is observed. It can be proposed that NO-species also form in this case but are oxidized fast by sulfate ions, for example, to NO3-and NO2-species according to the reactions
The vibrational modes of the free SO3-ion are below 1000 cm-1.25In bulk compounds,25if coordination occurs through the sulfur atom, theνas(S-O) mode shifts to 1100-1050 cm-1. In the case of O bonding, this mode splits into two and falls in the 900-850 cm-1region. Because of their poor quality, the spectra below 1050 cm-1are not informative, and the formation of coordinated SO32-species cannot be proven. However, the shoulder at approximately 1555 cm-1(Figure 8) can be assigned to nitrate species. In the case of NO adsorption on pure zirconia, this band is not observed (Figure 2), which can support the occurrence of reaction 4. The NO2-species (nitro and nitrito) exhibit characteristic bands in the 1400-1000 cm-1,27 but if formed, these bands cannot be observed because of overlap with the absorption due to perturbed sulfate groups.
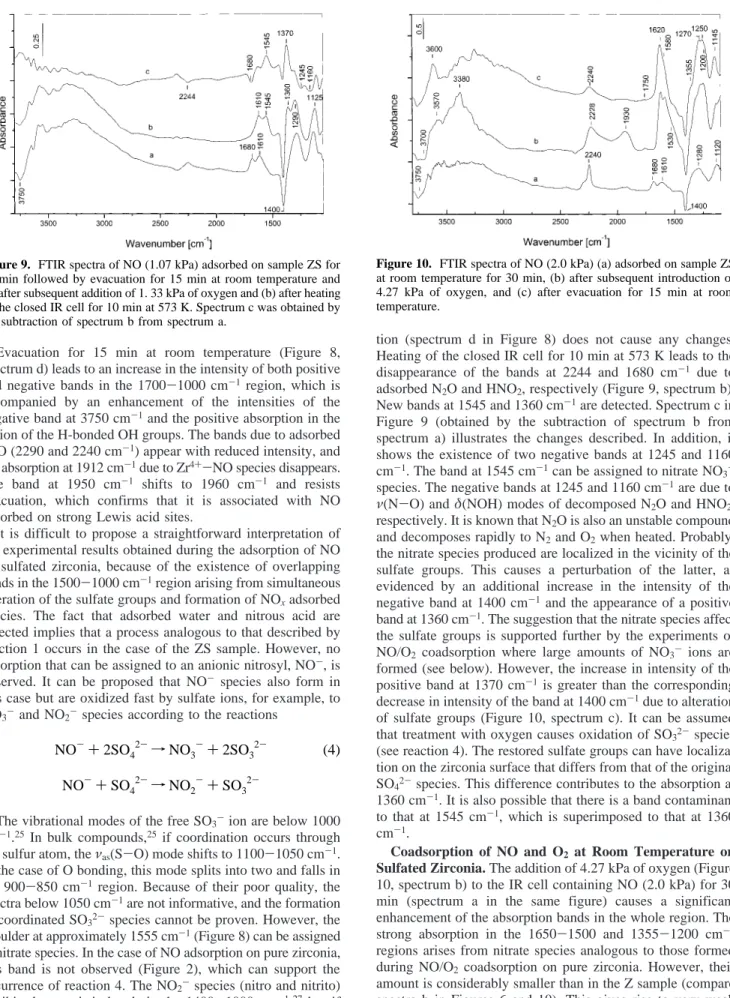
The addition of 1.33 kPa of oxygen (spectrum a in Figure 9) at room temperature to the sample evacuated after NO
adsorp-tion (spectrum d in Figure 8) does not cause any changes. Heating of the closed IR cell for 10 min at 573 K leads to the disappearance of the bands at 2244 and 1680 cm-1 due to adsorbed N2O and HNO2, respectively (Figure 9, spectrum b). New bands at 1545 and 1360 cm-1are detected. Spectrum c in Figure 9 (obtained by the subtraction of spectrum b from spectrum a) illustrates the changes described. In addition, it shows the existence of two negative bands at 1245 and 1160 cm-1. The band at 1545 cm-1can be assigned to nitrate NO3 -species. The negative bands at 1245 and 1160 cm-1are due to ν(N-O) and δ(NOH) modes of decomposed N2O and HNO2, respectively. It is known that N2O is also an unstable compound and decomposes rapidly to N2and O2when heated. Probably, the nitrate species produced are localized in the vicinity of the sulfate groups. This causes a perturbation of the latter, as evidenced by an additional increase in the intensity of the negative band at 1400 cm-1and the appearance of a positive band at 1360 cm-1. The suggestion that the nitrate species affect the sulfate groups is supported further by the experiments of NO/O2 coadsorption where large amounts of NO3- ions are formed (see below). However, the increase in intensity of the positive band at 1370 cm-1 is greater than the corresponding decrease in intensity of the band at 1400 cm-1due to alteration of sulfate groups (Figure 10, spectrum c). It can be assumed that treatment with oxygen causes oxidation of SO32-species (see reaction 4). The restored sulfate groups can have localiza-tion on the zirconia surface that differs from that of the original SO42-species. This difference contributes to the absorption at 1360 cm-1. It is also possible that there is a band contaminant to that at 1545 cm-1, which is superimposed to that at 1360 cm-1.
Coadsorption of NO and O2 at Room Temperature on
Sulfated Zirconia. The addition of 4.27 kPa of oxygen (Figure
10, spectrum b) to the IR cell containing NO (2.0 kPa) for 30 min (spectrum a in the same figure) causes a significant enhancement of the absorption bands in the whole region. The strong absorption in the 1650-1500 and 1355-1200 cm-1 regions arises from nitrate species analogous to those formed during NO/O2 coadsorption on pure zirconia. However, their amount is considerably smaller than in the Z sample (compare spectra b in Figures 6 and 10). This gives rise to very weak bands in the combination region of the nitrates.
Upon contact of the ZS sample with NO/O2mixture, the band at 1680 cm-1 due to adsorbed HNO2 disappears (Figure 10, spectrum b). The negative band in the OH-stretching region Figure 9. FTIR spectra of NO (1.07 kPa) adsorbed on sample ZS for
60 min followed by evacuation for 15 min at room temperature and (a) after subsequent addition of 1. 33 kPa of oxygen and (b) after heating of the closed IR cell for 10 min at 573 K. Spectrum c was obtained by the subtraction of spectrum b from spectrum a.
NO-+ 2SO42-f NO3-+ 2SO32- (4)
NO-+ SO42-f NO2
-+ SO3
2-Figure 10. FTIR spectra of NO (2.0 kPa) (a) adsorbed on sample ZS at room temperature for 30 min, (b) after subsequent introduction of 4.27 kPa of oxygen, and (c) after evacuation for 15 min at room temperature.
broadens, indicating that additional Zr4+-OH groups are involved in the adsorption process. Two strong bands with maxima at 3570 and 3380 cm-1 are detected, which are attributed to νas(OH) and νs(OH) modes, respectively, of adsorbed water molecules, produced according to the process already described for the Z sample (see reaction 2). Theδ(H2O) mode falls in the region of the strong nitrate band at 1620 cm-1. The intensity of the negative band at 1400 cm-1(due to altered SO42-groups during NO adsorption) has also increased. This can be explained by assuming a perturbation of some of the original sulfate groups caused by the NO3-species formed. The electronegative nitrate species affect the topmost SO42-groups through an induction effect, which causes a shift of the band due to the ν(SdO) mode to lower frequency (a positive absorption at approximately 1355 cm-1, more clearly visible in spectrum c obtained after evacuation).
The broad absorption with a maximum at 1930 cm-1(Figure 10, spectrum b) can be attributed to adsorbed N2O3as in the case of the Z sample. The band at 2240 cm-1 broadens and shifts to 2228 cm-1. It can be proposed that the latter absorption is due to the superimposition of bands associated with adsorbed N2O and combination modes of the nitrate species. After evacuation for 15 min at room temperature (Figure 10, spectrum c), a band positioned at 2240 cm-1 is detected again. This absorption is assigned to a residual amount of N2O and combination mode of NO3-species. The weak band at 1750 cm-1(Figure 10, spectra b and c) is also due to a combination mode. Evacuation causes the disappearance of the band at 1930 cm-1assigned to adsorbed N2O3. This is accompanied by the loss of intensity and narrowing of the complex band at 1650-1500 cm-1, which indicates that the low-frequency shoulder at about 1530 cm-1is associated with N2O3[νas(NO2) mode24]. The band at 1120 cm-1due to water-perturbed sulfate groups shifts to 1145 cm-1after addition of oxygen and does not change significantly in intensity after evacuation at room temperature. Theνs(NO2) mode of the nitrate species should appear between 1100 and 1000 cm-1 but is not observed because of the enhancement of the absorption in this region after the admission of oxygen.
Heating the sample at 363 K in a vacuum (Figure 11) results in a small decrease in intensity of the nitrate bands and the almost complete disappearance of the band at 2240 cm-1. As shown above, a similar absorption arises from a combination between the νas(NO2) mode of the nitrates (at approximately 1250 cm-1) and the corresponding vibrations due to theνs(NO2) mode. However, after evacuation at 363 K, the absorption at 1280-1250 cm-1 decreases in intensity by less than 50%, whereas the decrease in intensity of the band at 2240 cm-1 is approximately 10-fold (see the inset in Figure 11). This result confirms the suggestion that the absorption at 2240 cm-1is due mainly to strongly held N2O, which desorbs or decomposes after heating at 363 K. The intensities of the bands at 1280 and 1145 cm-1 and that of the negative band at 1400 cm-1 decrease, which indicates that restoration of the perturbed sulfate groups has occurred. Heating under a vacuum at 523 K causes a decrease in intensity of the band at 1620 cm-1, which is accompanied by the disappearance of the hydrogen-bonded OH groups in the 3500-2750 cm-1 region. This behavior is consistent with the suggestion that the band at 1620 cm-1 is due to nitrate species and adsorbed water molecules. It seems that the bands at 1280 and 1145 cm-1are not present after this treatment and the sulfate groups are almost completely restored. However, because of the appearance of negative bands at 1520, 1450, and 1330 cm-1(indicated by asterisks) corresponding to
residual carbonate species (see Figure 1, spectrum ZS) that undergo decomposition during the vacuum heat treatment, it is difficult to follow the behavior of the band at 1400 cm-1. Evacuation at 673 K causes complete desorption of the nitrate species and restoration of the original hydroxyl groups.
The inset in Figure 11 shows the combination region of the fundamental nitrate bands in the spectrum obtained after evacuation at 363 K. As illustrated above, the bands in the combination region can help in determining the type of coordination of surface nitrates. The presence of a relatively symmetric band at 2615 cm-1indicates that there is only one type of bidentate NO3-species with the fundamental band at 1580 cm-1[ν(NdO) mode]. Taking into account that the former band represents a sum of theν(NdO) and νs(NO2) modes of bidentate nitrates, the position of theirνs(NO2) vibration can be estimated as approximately 1040-1050 cm-1. The poorly resolved band at 1750 cm-1 also confirms the existence of bidentate nitrates. The pair of bands at 1964 and 1892 cm-1 supports the presence of bridged NO3-species (fundamental band at 1620 cm-1). The absorption at 2260 cm-1corresponds to a binary combination between theνas(NO2) mode at 1200 cm-1andνs(NO2) vibration (estimated at approximately 1080 cm-1) of the bridged nitrates. The band at 2118 cm-1probably is associated with a combination between the component at 1145 cm-1 of the split ν3mode and the ν1mode of the perturbed sulfate groups. The latter vibration is at approximately 990 cm-1,21and it was not observed by us. By using the estimated values ofνs(NO2) modes of the nitrate species, the band at 2190 cm-1could be interpreted as a sum between theνs(NO2) mode of nitrato and theν3component at 1145 cm-1of sulfato species. The first overtone of the band at 1250 cm-1 due to nitrato species should appear between 2500 and 2400 cm-1. However, the absorption in this region is very weak and obscured by the negative band due to ambient CO2 and, therefore, cannot be used in the assignment.
On the basis of these considerations, the nitrate species formed upon NO/O2coadsorption on the ZS sample are identified as Figure 11. FTIR spectra obtained after heating of sample ZS containing preadsorbed NOxspecies for 15 min in a vacuum at various temper-atures. This spectrum (298 K) corresponds spectrum c in Figure 10.
bridged (1620 and 1200 cm-1) and bidentate (1580 and 1250 cm-1) nitrates.
Table 2 illustrates the absorption bands observed during NO adsorption and its coadsorption with O2on sulfated zirconia. Conclusions
The adsorption of NO at room temperature on pure and sulfated zirconia occurs through disproportionation, leading to the formation of nitrous acid; water molecules; nitro species; and anionic nitrosyls, NO-. The latter species are stable on the surface of zirconia, whereas, on the sulfated sample, they are readily oxidized by the SO42- groups. The process of NO disproportionation is favored by wet surfaces and occurs with the participation of the hydroxyl groups of zirconia. These are tribridged OH groups for pure zirconia and terminal OH groups for sulfated sample. The anionic nitrosyls are stable in an oxygen atmosphere at room temperature but are oxidized at 573 K. If they are in contact with a NO/O2mixture at room temperature they transform into nitrato species.
The coadsorption of NO and O2on pure zirconia leads to the formation of monodentate, bidentate, and bridged nitrate species. On sulfated zirconia, no monodentate NO3-species are formed, and the total surface concentration of the NO3-ions is lower. In addition, the nitrate species obtained on the sulfated zirconia are thermally less stable than those on pure zirconia. Analysis of the combination bands of the nitrate species shows that this spectral region can be used for the structural identifica-tion of bidentate and bridged nitrates. Bridged nitrates produce combination bands at 2845-2800 cm-1and a pair of bands at 1980-1960 and 1900-1890 cm-1. Bidentate nitrates can be distinguished by the appearance of combination bands in the region of 2600 cm-1and a pair of bands at 1755 and 1700 cm-1.
Acknowledgment. This work was financially supported by
the Bilkent University, Research Development Grant for 2001,
and the Scientific and Technical Research Council of Turkey (TU¨ BITAK), Project TBAG-1706.
References and Notes
(1) Indovina, V.; Occhiuzzi, M.; Ciambelli, P.; Sannino, D.; Ghiotti, G.; Prinetto, F. Studies in Surface Science and Catalysis; Hightower, J. W., Delgass, N. W., Iglesia, E., Bell, A. T., Eds.; Elsevier Science Publishers: Amsterdam, 1996; Vol. 101, p 691.
(2) Pietrogiacomi, D.; Sannino, D.; Tuti, S.; Ciambelli, P.; Indovina, V.; Occhiuzzi, M.; Pepe, F. Appl. Catal. B 1999, 21, 141.
(3) Hamada, H.; Kintaichi, Y.; Tabata, M.; Sasaki, M.; Ito, T. Chem.
Lett. 1991, 2179.
(4) Pasel, J.; Speer, V.; Albrecht, C.; Richter, F.; Papp, H. Appl. Catal.
B 2000, 25, 105.
(5) Delahay, G.; Ensuque, E.; Coq, B.; Figue´ras, F. J. Catal. 1998,
175, 7.
(6) Figue´ras, F.; Coq, B.; Ensuque, E.; Tachon, D.; Delahay, G. Catal.
Today 1998, 42, 117.
(7) Chin, Ya-H.; Alvarez, W. E.; Resasco, D. E. Catal. Today 2000,
62, 159.
(8) Mennier, F. C.; Ukropec, R.; Stapleton, C.; Ross, J. R. H. Appl.
Catal. B 2001, 30, 163.
(9) Hadjiivanov, K. I. Catal. ReV.-Sci. Eng. 2000, 42, 71. (10) Miyata, H.; Konishi, S.; Ohno, T.; Hatayama, F. J. Chem. Soc.,
Faraday Trans. 1995, 91, 1557.
(11) Delahay, G.; Coq, B.; Ensuque, E.; Figue´ras, F. Langmuir 1997,
13, 5588.
(12) Hadjiivanov, K. Catal. Lett. 2000, 68, 157.
(13) Pozdnyakov, D.; Flimonov, V. Kinet. Katal. 1973, 14, 760. (14) Ghiotti, G.; Chiorino, A. Spectrochim. Acta 1993, 49A, 1345. (15) Ghiotti, G.; Prinetto, F. Res. Chem. Intermed. 1999, 25, 131. (16) Toraya, H.; Yashmura, M.; Simiyama, S. J. Am. Ceram. Soc. 1984,
67, C119.
(17) Guglielminotti, E. Langmuir 1990, 6, 1455.
(18) Morterra, C.; Aschieri, R.; Volante, M. Mater. Chem. Phys. 1988,
20, 539.
(19) Cerrato, G.; Bordiga, S.; Barbera, S.; Morterra, C. Appl. Surf. Sci.
1997, 115, 53.
(20) Jung, K. T.; Bell, A. T. J. Mol. Catal. A 2000, 163, 27. (21) Morterra, C.; Cerrato, G.; Pinna, F.; Signoretto, M. J. Phys. Chem.
1994, 98, 12373.
(22) Bolis, V.; Morterra, C.; Volante, M.; Orio, L.; Fubini, B. Langmuir
1990, 6, 695.
(23) Morterra, C.; Bolis, V.; Cerrato, G.; Magnacca, G. Surf. Sci. 1994,
307-309, 1206.
(24) Laane, J.; Ohlsen, J. R. Prog. Inorg. Chem. 1986, 28, 465. (25) Nakamoto, K. Infrared and Raman Spectra of Inorganic and
Coordination Compounds. Part B: Applications in Coordination, Orga-nometallic, and Bioinorganic Chemistry, 5th ed.; John Wiley & Sons: New
York, 1997.
(26) Latajka, Z.; Mielke, Z.; Olbert-Majkut, A.; Wieczorek, R.; Tokhadze, K. G. Phys. Chem. Chem. Phys. 1999, 1, 2441.
(27) Huang, S.-J.; Walters, A. B.; Vannice M. A. J. Catal. 2000, 192, 29.
(28) Hadjiivanov, K.; Knozinger, H. Phys. Chem. Chem. Phys. 2000,
2, 2803.
(29) Cerruti, L.; Modone, E.; Guglielminotti, E.; Borello, E. J. Chem.
Soc., Faraday Trans. 1 1974, 70, 729.
(30) Low, M. J. D.; Yang, R. T. J. Catal. 1974, 34, 479.
(31) Martinez-Arias, A.; Soria, J.; Conesa, J. S.; Seoane, X. L.; Arcoya, A.; Cataluna, R. J. Chem. Soc., Faraday Trans. 1995, 91, 1679.
(32) Klingenberg, B.; Vannice, M. A. Appl. Catal. B 1999, 21, 19. (33) Hadjiivanov, K.; Bushev, V.; Kantcheva, M.; Klissurski, D.
Langmuir 1994, 10, 464.
(34) Kantcheva, M. M.; Bushev, V. P.; Hadjiivanov, K. I. J. Chem. Soc.,
Faraday Trans. 1992, 88, 3087.
(35) Givan, A.; Loewenschuss, A. J. Chem. Phys. 1989, 90, 6135. (36) Lever, A. B. P.; Mantovani, E.; Ramaswamy, B. S. Can. J. Chem.
1971, 49, 1957. TABLE 2: Assignments of the FTIR Bands Observed
during Adsorption of 1.07 KPa of NO and Its Coadsorption with O2(NO:O2) 1:2) at Room Temperature on Sulfated Zirconia
NOxspecies band positions (cm-1) modes
N2O (ads) 2290, 2240 ν(NN) 1230 ν(NO) Zr4+-NO 1912 ν(NO) ON-Zr4+-(SO 42-) 1950-1960 ν(NO) N2O3 1930 ν(NdO) 1530 νas(NO2)
cis-HNO2(ads) 1680 ν(NdO)
H2O (ads) 3550-3000 ν(OH) 1610 δ(HOH) NO3-(bridged) 1620 ν(NdO) 1200 νas(NO2) 2260 νas(NO2) +νs(NO2) 1964, 1892 νs(NO2) +δ(ONO) NO3-(bidentate) 1580 ν(NdO) 1250 νas(NO2) 2615 ν(NdO) + νs(NO2) 1750 νs(NO2) +δ(ONO)