9
Silicon nanoparticles from
pulsed laser ablation
Canan Kurşungöz, Elif Uzcengiz Şimşek, and Bülend Ortaç
9.1
INTRODUCTION AND MOTIVATION
The research on silicon nanocrystals (SiNCs) has been considerably attractive for the scientist in the last decades due to the SiNCs’ significant size-dependent optical properties, and their potential for stimulated emission (Pavesi et al. 2000). The bright photoluminescence (PL) properties of SiNCs is mainly observed in visible regions of the spectrum (Wolkin et al. 1999). On the other hand, blue-luminescent SiNCs would provide a decrease in free carrier absorption and an increase in the stimulated emission (Švrček et al. 2006). These excellent properties and their biocompatible nature make SiNCs a promising candidate for applications such as light-emitting devices or energy sources, in biomedicine and photodynamic therapy (Walters et al. 2005; Stupca et al. 2007; Wang et al. 2008). Moreover, it was suggested that the production of SiNCs in colloidal suspension provides considerable advantages in optoelectronics applications due to the increased stimulated emission process (Luterova et al. 2016).
A number of chemical (Zhang et al. 2007; Rosso-Vasic et al. 2009) and physical
(Knipping et al. 2004; Khang and Lee 2010) methods were developed for the production of SiNCs. Chemical methods were much more favorable due to their potential for controlling both the particle size and surface properties (Intartaglia et al. 2011; Intartaglia et al. 2012a). These chemical methods included reduction reactions (Warner et al. 2005; Zhang et al. 2007; Rosso-Vasic et al. 2009), electro-chemical etching (Belomoin et al. 2002; Kůsová et al. 2010), gaseous phase decomposition of silane (Li et al. 2004; Mangolini et al. 2005). However, the use of chemical products and reducing agents in chemical methods results in by-product contamination in the nanocrystal solution, which would affect the downstream procedures (Warner et al. 2005; Kůsová et al. 2010). Furthermore, these methods are time consuming and costly since they consist of multistep procedures (Kabashin and Meunier 2006; Intartaglia et al. 2012a).
Pulsed laser ablation in liquids (PLAL) is a promising method for the production of pure colloidal nanoparticle solutions (Rioux et al. 2009; Intartaglia et al. 2011). PLAL offers a number of advantages
Contents
9.1 Introduction and Motivation 211
9.2 PLAL Mechanism and Setup 212
9.3 Effect of Laser Ablation Parameters on the Silicon Nanoparticle Generation 217
9.3.1 Pulse Energy Effect 217
9.3.2 Pulse Duration Effect 219
9.3.3 Liquid Environment Effect 219
9.4 Physical and Chemical Properties of Silicon Nanoparticles 221
9.5 Posttreatment Methods 223
9.6 Applications of Silicon Nanoparticles Produced by Pulsed Laser Ablation Method 223
9.7 Conclusion 224
Silicon nanoparticles from pulsed laser ablation 212 C lu st er s, na nop ar ti cl es, a nd q ua nt um d o ts
over other nanoparticle production methods. First, the colloidal nanoparticle solution is produced in a chemically pure environment since there is no need for any chemical precursors for the nanoparticles to be produced. Thus, at the end of the production, there are no residual byproducts or contamination which would affect the downstream application processes in the solution. Second, the PLAL method is a relatively simple one when compared to other nanoparticle production methods, since there is no require-ment for extreme temperature and pressure conditions. Moreover, it can be applied to the production of a number of different nanoparticles. Last but not least, PLAL is a versatile method allowing for further nanoscale functionalization as the nanoparticles are in a colloidal solution (Yang et al. 2008; Yang et al. 2009a; Intartaglia et al. 2011).
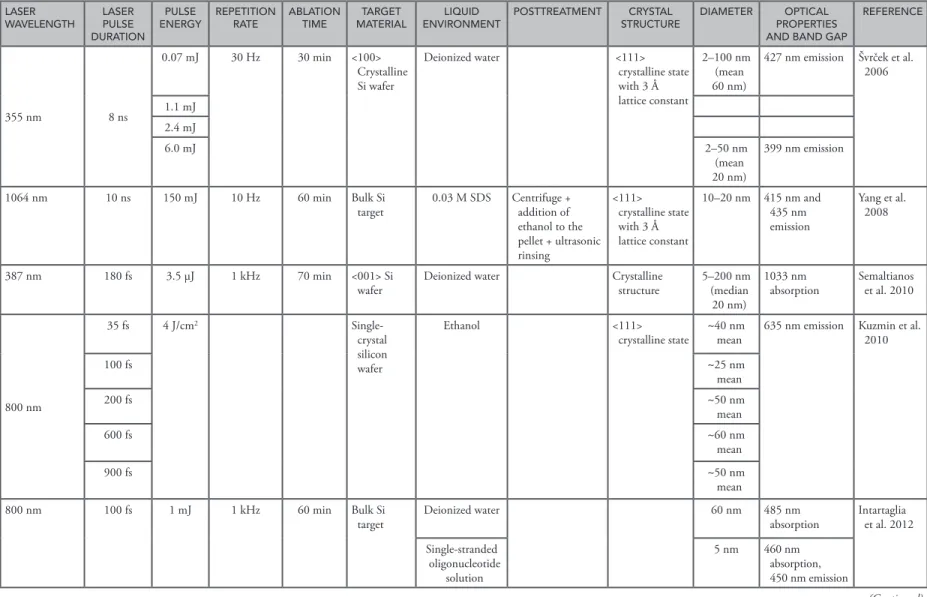
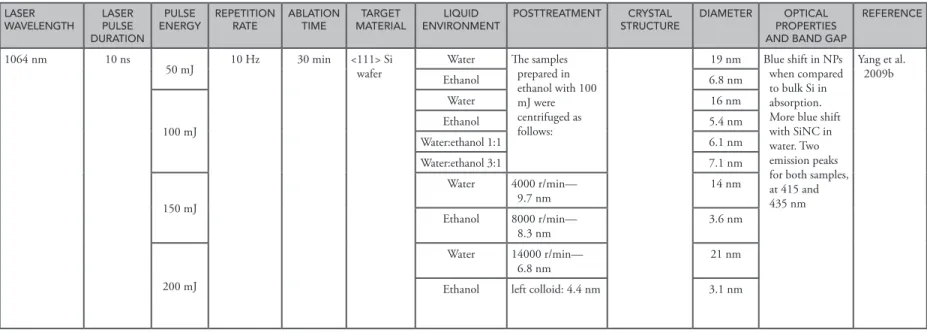
The (111) crystalline structure of SiNCs could be achieved by using different types of lasers with varying pulse energies and pulse durations. In general, 800 nm femtosecond lasers, 532, 1064, and 355 nm nanosecond (ns) lasers and also picosecond lasers are used in the PLAL process for SiNC production. Although different solvents, such as hexane, chloroform, ethanol, and a variety of sur-factants, are used for SiNC generation with PLAL, deionized water is the commonly preferred and successful solvent for this process. The laser parameters (wavelength, pulse duration, pulse energy, and repetition rate), the liquid environment, and ablation duration are the key parameters for the production of SiNC with PLAL mechanism. The overall literature search about these parameters and resulting SiNC features are summarized in Table 9.1.
In this chapter, the PLAL mechanism and a general setup will be introduced. The effects of laser ablation parameters (pulse energy, pulse duration, laser wavelength, and liquid environment) will be discussed in detail with a comprehensive literature search. The physical and chemical properties of produced SiNCs and the effect of posttreatment methods will be reviewed. The chapter will be concluded with the different applications of SiNCs produced with the PLAL mechanism.
9.2
PLAL MECHANISM AND SETUP
In the ablation of a solid target in a liquid environment, a series of processes are observed. First, the plasma plume is generated when the laser light reaches the solid target. Then, the generated plasma plume is trans-formed and condensed; it is strongly affected by the liquid confinement when considered in terms of its thermodynamic and kinetic properties.
The liquid confinement leads to the formation of a shock wave due to the adiabatic expansion of the laser-induced plasma at a supersonic velocity in the plasma plume. Due to the incoming laser pulse, the continuous material removal from the solid target takes place with vaporization. Then, extra pressure is produced in the plasma due to the shock wave, which is called plasma-induced pressure, and the temperature in the plasma increases. Thus, the thermodynamic state of the plasma changes to the state with higher temperature, higher pressure, and higher density, which allows the formation of the metastable phases (Yang 2007).
There are four types of chemical reactions observed in the laser-induced plasma and the interface between the liquid and the plasma during its transformation process. The first reaction takes place inside the plasma due to the high temperature and pressure state of the laser-induced, high-density plasma, and a new phase can form by these chemical reactions between the ablations from the target. The second chemical reaction again takes place inside the plasma. In this reaction, the liquid molecules at the interface are excited and evaporated due to the high temperature and high pressure in the plasma. Thus, a new plasma from the liquid molecules is generated at the interface, which is called plasma-induced plasma. The laser-induced plasma and plasma-induced plasma are mixed and the laser-induced plasma includes a number of species from the plasma-induced plasma inside. The species generated from the laser ablation of the target and the species formed due to the excitation of the liquid molecules are engaged in the chemical reactions in this part. The third chemical reaction takes place at the interface of the laser-induced plasma and the liquid due to the high temperature, pressure, and density. The fourth reaction is observed inside the liquid when the ablated species from the solid target is affected by the high pressure of the laser-induced plasma. In the chemical reactions where two species, namely the ones from the solid target and the ones from the confining liquid, are
9.2 P LA L m ec ha nis m a nd s etu p 213 Clu ste rs, nanop art icl es, and qua ntu m d ots
Table 9.1 Detailed summary of the literature indicating the effects of laser parameters and liquid environment on the SiNC produced by PLAL
LASER
WAVELENGTH LASER PULSE DURATION
PULSE
ENERGY REPETITION RATE ABLATION TIME MATERIALTARGET ENVIRONMENTLIQUID POSTTREATMENT STRUCTURECRYSTAL DIAMETER PROPERTIES OPTICAL AND BAND GAP
REFERENCE
800 nm 120 fs 0.1–1 mJ 1 kHz 30 min <100> Si
wafer Deionized water <111> crystalline state with 3.14
Å lattice constant. Amorphous structures
2.4 nm 1270 nm
emission (PL) Rioux et al. 2009
532 nm 10 mJ/
cm2 Single-crystal silicon
wafer
Water, hexane <10 nm 2.9 eV gap energy
in water 3.5 eV gap energy in hexane Umezu et al. 2007 800 nm 100 fs 0.40 mJ 1 kHz 60 min Bulk Si
target Deionized water <111> crystalline state
with 3.12 Å lattice constant 60 nm 1.21 eV Intartaglia et al. 2011 0.27 mJ 3.5 nm 1.56 eV 0.16 mJ 2.5 nm 1.67 eV
355 nm 40 ns 40 J/cm2 5 kHz Si wafer Chloroform Physiochemical
posttreatment (isopropanol/HF/ hexane 3:1:3 and ultrasonic posttreatment) Monocrystaline and polycrystalline. <111> crystalline state with 3.1 Å lattice constant 50 nm diameter decreased to 4 nm 500 nm emission (PL) Abderrafi et al. 2011 800 nm 110 fs 0.15 mJ 1 kHz Bulk Si
target Deionized water <111> crystalline state
with 3.12 Å lattice constant 1–8 nm (mean 5.5 nm) 460 nm absorption, 475 nm emission Intartaglia et al. 2012 0.4 mJ 10–120 nm (mean 65 nm) 485 nm absorption, 575 nm emission (Continued)
Sil ic on n an op ar tic les f rom p uls ed la se r a b la tion 214
Clusters, nanoparticles, and quantum dots
Table 9.1 (Continued) Detailed summary of the literature indicating the effects of laser parameters and liquid environment on the SiNC produced by PLAL
LASER
WAVELENGTH LASER PULSE DURATION
PULSE
ENERGY REPETITION RATE ABLATION TIME MATERIALTARGET ENVIRONMENTLIQUID POSTTREATMENT STRUCTURECRYSTAL DIAMETER PROPERTIES OPTICAL AND BAND GAP
REFERENCE 355 nm 8 ns 0.07 mJ 30 Hz 30 min <100> Crystalline Si wafer Deionized water <111> crystalline state with 3 Å lattice constant 2–100 nm (mean 60 nm)
427 nm emission Švrček et al. 2006 1.1 mJ 2.4 mJ 6.0 mJ 2–50 nm (mean 20 nm) 399 nm emission 1064 nm 10 ns 150 mJ 10 Hz 60 min Bulk Si
target 0.03 M SDS Centrifuge + addition of
ethanol to the pellet + ultrasonic rinsing <111> crystalline state with 3 Å lattice constant 10–20 nm 415 nm and 435 nm emission Yang et al. 2008 387 nm 180 fs 3.5 µJ 1 kHz 70 min <001> Si
wafer Deionized water Crystalline structure 5–200 nm (median
20 nm)
1033 nm
absorption Semaltianos et al. 2010
800 nm 35 fs 4 J/cm2 Single-crystal silicon wafer Ethanol <111>
crystalline state ~40 nm mean 635 nm emission Kuzmin et al. 2010
100 fs ~25 nm mean 200 fs ~50 nm mean 600 fs ~60 nm mean 900 fs ~50 nm mean 800 nm 100 fs 1 mJ 1 kHz 60 min Bulk Si
target Deionized water 60 nm 485 nm absorption Intartaglia et al. 2012
Single-stranded oligonucleotide solution 5 nm 460 nm absorption, 450 nm emission (Continued)
9.2 P LA L m ec ha nis m a nd s etu p 215 Clu ste rs, nanop art icl es, and qua ntu m d ots
Table 9.1 (Continued) Detailed summary of the literature indicating the effects of laser parameters and liquid environment on the SiNC produced by PLAL
LASER
WAVELENGTH LASER PULSE DURATION
PULSE
ENERGY REPETITION RATE ABLATION TIME MATERIALTARGET ENVIRONMENTLIQUID POSTTREATMENT STRUCTURECRYSTAL DIAMETER PROPERTIES OPTICAL AND BAND GAP
REFERENCE
1064 nm 10 ns
50 mJ 10 Hz 30 min <111> Si wafer Water The samples prepared in
ethanol with 100 mJ were centrifuged as follows: 19 nm Blue shift in NPs when compared to bulk Si in absorption. More blue shift with SiNC in water. Two emission peaks for both samples, at 415 and 435 nm Yang et al. 2009b Ethanol 6.8 nm 100 mJ Water 16 nm Ethanol 5.4 nm Water:ethanol 1:1 6.1 nm Water:ethanol 3:1 7.1 nm 150 mJ Water 4000 r/min— 9.7 nm 14 nm Ethanol 8000 r/min— 8.3 nm 3.6 nm 200 mJ Water 14000 r/min— 6.8 nm 21 nm
Silicon nanoparticles from pulsed laser ablation 216 C lu st er s, na nop ar ti cl es, a nd q ua nt um d o ts
involved, the generation of new materials in nanoscale by the combination of the target and the liquid takes place. Finally, the plasma plume cools down and condenses in the confining liquid in two dif-ferent ways. It can either condenses and deposits back on the target solid or condenses and become dispersed in the liquid by forming nanoscale materials (Yang 2007). When we explain the nanoscale material formation mechanism in detail, we should first assume the clusters and the surrounding plasma have the same temperature T, then isothermal nucleation time is given by
τ = π γ ∆µ 2 ( )( )2 mkT kT p Ts (9.1)
where m, k, T, γ, Ps(T), Δµ denote the mass of a single atom, the Boltzmann constant, the absolute
temperature, the surface energy density of the material, saturated vapor pressure of nuclei at the temperature of T, and atom chemical potential difference, respectively. When the nucleation time decreases, the pressure increases. However, the temperature and the nucleation time are adversely related to each other due to effect of the saturated vapor pressure of nuclei. Consequently, the diameter of nanomaterials could be expressed as
(
)
= 2τ − τ +2 *
d V d r (9.2)
where τd and r* are the laser pulse duration and the size of critical nuclei of diamond, respectively.
These theoretical calculations were also shown to be in good agreement with the experimental results (Yang et al. 1999; Yang 2007).
Yang et al. (2009b) also investigated the effect of a liquid environment and the laser energy on the structure of the produced SiNCs, specifically, and they proposed a mechanism for these effects similar to the nucleation and growth theory (Yang et al. 2009b). As mentioned above, the interaction between pulsed laser light and the target leads to an instant local high-temperature and high-pressure plasma plume at the interface of the target and the liquid environment. Then, such plasma will ultrasonically and adiabatically expand, resulting in the cooling of the plume region and formation of clusters. With the annihilation of the plasma, the adjacent formed clusters aggregate quickly into nanoparticles. They suggested that at low laser energies, the generation of Si atoms filled in the plasma plume is less and the pressure and temperature of the plasma plume is low. Hence, nucleation is relatively difficult. When the pressure and temperature of the plasma plume suddenly decrease, further nucleation becomes almost unattainable. The small number of nuclei formed uses the surrounding Si clusters, thus leading to large-sized nanoparticles. Under high laser energy, due to relatively high temperature and pressure of the formed plasma plume, nucleation takes place almost simultaneously all around the plume region. Therefore, a number of supplied Si atoms at high laser energy are shared by more nuclei, resulting in small-sized nanoparticles (Yang et al. 2009b).
Besides the effect of laser energy, the liquid environment is also important in the PLAL process. Different transparencies are suggested to directly affect the peak value of the pressure and tempera-ture of the plasma plume after laser irradiation. Moreover, different thermal conductivities of the liquids have an effect on the decay process of the temperature and pressure of the plume. Furthermore, various density and viscosity values have an impact on the expansion of the plasma plume. All these liquid parameters have an effect together on the nucleation and the following growth process of the nanoparticles. This is why different-sized SiNCs are obtained with different liquid environments (Yang et al. 2009b).
A general setup scheme for the generation of SiNC with PLAL mechanism is given in Figure 9.1. As shown in the figure, there are key parameters for PLAL to produce SiNCs successfully.
These parameters are the laser wavelength, laser pulse duration, pulse energy, repetition rate, ablation time, and liquid environment. The effect of those parameters on SiNC will be discussed in detail in the following section.
9.3 Effect of laser ablation parameters on the silicon nanoparticle generation 217 C lu st er s, na nop ar tic le s, a nd q ua nt um d o ts
Not only the solid targets in the liquids but also the powder targets, which are considered as colloids, can also be subjected to PLAL for the production of nanoscale materials. In this case, pulsed laser melting in liquid (PLML) and pulsed laser fragmentation in liquid (PLFL) processes are observed.
9.3
EFFECT OF LASER ABLATION PARAMETERS ON THE
SILICON NANOPARTICLE GENERATION
Laser parameters and liquid environment (solvents) are effective on the nanoparticle formation and the physical properties of nanoparticles such as size, shape, crystallinity, and so on. In this section, the effects of different laser pulse durations, pulse energies, laser wavelength, and the liquid environment will be discussed in terms of their effects on nanoparticle properties. The summary of the literature search men-tioned below in this section is given as a summary in Table 9.1.
9.3.1 PULSE ENERGY EFFECT
Rioux et al. demonstrated the production of SiNCs by ablating an Si wafer for 30 minutes with a femtosec-ond laser operating at 0.1–1 mJ pulse energy and 1kHz repetition rate, with 120 fs pulse duration and an 800 nm laser wavelength. SiNCs were produced in deionized water and they had a 2.4 nm average diameter with crystalline structure. Amorphous SiNCs were also observed. When the laser energy increased, they showed that the average diameter of the nanoparticles increased together with an increase in the size disper-sion (Rioux et al. 2009). Similarly, in another study conducted using an 800 nm femtosecond laser operat-ing at 100 fs pulse duration and 1kHz repetition rate, increasoperat-ing laser energies (0.16, 0.27, and 0.40 mJ) were used to control the nanoparticle size. SiNCs were produced by ablating a bulk Si target for 60 minutes in deionized water. It was revealed that by decreasing the laser energy, smaller SiNCs were obtained. The average diameter of SiNCs were determined as 60 nm, 3.5 nm, and 2.5 nm for the laser energies 0.40 mJ, 0.27 mJ, and 0.16 mJ, respectively (Figure 9.2) (Intartaglia et al. 2011).
The ablation of a bulk Si target in deionized water by using a laser operating at 800 nm laser wave-length, 110 fs pulse duration, and 1kHz repetition rate was also shown. In this study, two different laser pulse energies were used. While 0.15 mJ laser pulse energy resulted in SiNCs with 5.5 nm average size, 0.4 mJ laser energy led to SiNCs having 65 nm average diameter (Intartaglia et al. 2012). Besides femtosecond lasers, the effect of laser energy was also analyzed in studies conducted by using nanosecond lasers. The laser operating at 355 nm wavelength, 8 ns pulse duration, and 30 Hz repeti-tion rate was utilized to obtain SiNCs by ablating a bulk Si wafer in deionized water for 30 minutes. It was revealed that SiNCs with 60 nm average diameter were obtained with 0.07 mJ laser energy, but 6 mJ laser energy resulted in SiNCs with 20 nm average diameter (Švrček et al. 2006). Moreover, by using deionized water and ethanol as the liquid media, an Si wafer was ablated for 30 minutes with a
Laser source Lens Si wafer Solvent Mirror Key parameters: • Wavelength • Pulse duration • Pulse energy • Repetition rate • Ablation time
Figure 9.1 A representative PLAL setup for the formation of SiNC. The laser light is transferred with mirror(s) to the solvent in which an Si wafer target is placed. By focusing the laser light with the lens on the target, the abla-tion process takes place and SiNCs are formed.
Silicon nanoparticles from pulsed laser ablation 218 C lu st er s, na nop ar ti cl es, a nd q ua nt um d o ts
nanosecond laser having the wavelength of 1064 nm, 10 ns pulse duration, and 10 Hz repetition rate. Higher laser energies resulted in much smaller SiNCs in both water and ethanol, which was demon-strated as a good liquid environment for the production of smaller and more stable SiNCs (Figure 9.3) (Yang et al. 2009b). Although there is tendency to produce smaller SiNCs by using lower energy with a femtosecond laser and higher energy with a nanosecond laser, the effect of the laser repetition rate should be taken into account and further studies should be performed to make a better interpretation.
(a)
(b)
100 nm 100 nm 10 nm
30 50 mJ/pulseMean size: 19 nm
Size (nm) Frequency (%) 20 10 10 20 30 40 50 60 70 80 0 Size (nm) 50 mJ/pulse Mean size: 6.8 nm 25 Frequency (%) 20 10 15 5 0 3 6 9 12 15 18 100 nm 100 nm 20 nm 100 mJ/pulse Mean size: 5.4 nm Frequency (%) 0 10 20 30 40 Size (nm) 2 4 6 8 10 12 10 20 30 40 50 Size (nm) 60 100 mJ/pulse Mean size: 16 nm 30 40 Frequency (%) 20 10 0
Figure 9.3 TEM results and the size distribution of the SiNCs produced in water (left) and in ethanol (right)
at different laser fluences: (a) 50 and (b) 100. (Continued)
50 40 30 Count (a.u.) 20 10 0 20 40 60 80 100 120 140 160 180 200 Nanoparticles diameter (nm) (a) (b) (c) N : 150 φ = 60 nm (0.6) 100 80 60 Count (a.u.) 40 20 0 1 2 3 4 5 6 7 8 Nanoparticles diameter (nm) 100 nm 10 nm 10 nm N : 550 φ = 3.3 nm (1.7) 350 300 250 Count (a.u.) 200 100 50 150 8 7 6 5 4 3 2 1 0 Nanoparticles diameter (nm) N : 1000 φ = 2.3 nm (1.2) Nanoparticle Gaussian distribution Nanoparticle
Gaussian distribution NanoparticleGaussian distribution
Figure 9.2 TEM and STEM analyses of the obtained solution by femtosecond laser ablation using different pulse energies: (a) 0.40 mJ TEM image, (b) 0.27 mJ, and (c) 0.16 mJ STEM images. (From Intartaglia, R., et al.,
9.3 Effect of laser ablation parameters on the silicon nanoparticle generation 219 C lu st er s, na nop ar tic le s, a nd q ua nt um d o ts
9.3.2 PULSE DURATION EFFECT
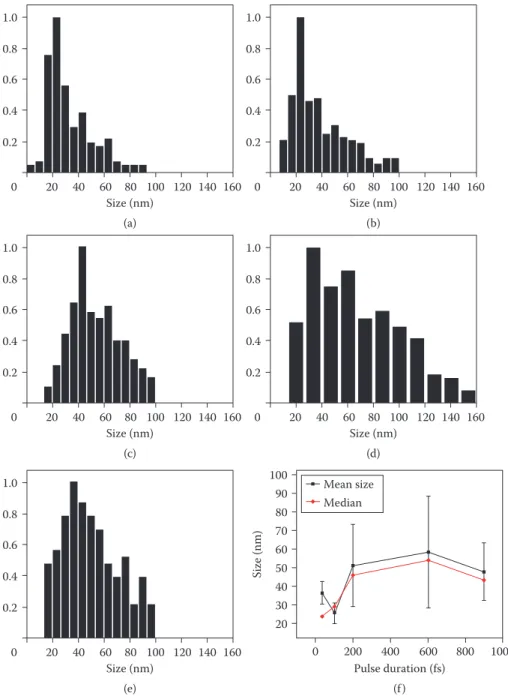
When we consider the effect of laser pulse duration, Kuzmin et al. investigated the effect of laser pulse duration by using an 800 nm femtosecond laser in the range of 35, 100, 200, 600, and 900 fs pulse duration. The laser had 4J/cm2 fluence and the ablation was performed in ethanol. It was revealed that
40 nm, 25 nm, 50 nm, 60 nm, and 50 nm average nanoparticle sizes were obtained by starting from the lowest pulse duration to the longest pulse duration, respectively (Figure 9.4). The authors concluded that the average diameter of SiNCs and the overall size distribution decreases when the laser pulse duration decreases. They suggested that SiNCs interact with the white light continuum due to low pulse duration and this results in smaller SiNCs at lower pulse durations (Kuzmin et al. 2010).
9.3.3 LIQUID ENVIRONMENT EFFECT
The liquid environment in which SiNCs are produced has a great importance on the size of the nanopar-ticles. Yang et al. produced SiNCs in both ethanol and deionized water by using the same laser parameters with the PLAL technique, and they showed that the average diameter of SiNCs was smaller in ethanol when compared to water (Yang et al. 2009). Moreover, the same group demonstrated the effect of a surfac-tant, namely 0.03 M sodium dodecyl sulfate (SDS), on SiNC size and it was indicated that the average size of SiNCs was similar to that of the nanoparticles in water (Yang et al. 2008). Another study showed that SiNCs produced in single-stranded oligonucleotide solution, as a surfactant, had an average size of 5 nm but the ones produced in deionized water by using the same parameters had 60 nm average size (Intartaglia et al. 2012). SiNCs were produced in water and a polymer matrix (a mixture of ethylpolysilicate ethanol and ethyl acetate) by using a nanosecond laser system by the PLAL method. It was demonstrated that SiNCs produced in deionized water were much smaller when compared to the ones in polymer (Švrček and Kondo 2009). Mansour et al. produced SiNCs with average size 3.5 nm by PLAL by using dimethyl sulf-oxide (DMSO) as the liquid medium (Mansour et al. 2012). These studies indicate that the liquid medium is quite important for the size of SiNCs, and the other suitable solvents for the production of SiNCs should be investigated in detail. 50 nm 50 nm (c) (d) 200 mJ/pulse mean size: 3.1 nm Size (nm) Frequency (%) 10 20 30 40 50 0 2 4 6 8 10 20 30 40 50 60 70 80 Size (nm) 200 mJ/pulse mean size: 21 nm 30 Frequency (%) 20 10 0 70 nm 50 nm 150 mJ/pulse Mean size: 3.6 nm Size (nm) Frequency (%) 10 20 30 40 0 2 4 6 8 10 Size (nm) 150 mJ/pulse Mean size: 14 nm 30 40 Frequency (%) 20 10 10 20 30 40 50 60 0
Figure 9.3 (Continued) TEM results and the size distribution of the SiNCs produced in water (left) and in ethanol (right) at different laser fluences: (c) 150 and (d) 200 mJ/pulse (From Yang, S., et al., J. Phys. Chem. C, 113, 19091–19095, 2009b. With permission.).
Silicon nanoparticles from pulsed laser ablation 220 C lu st er s, na nop ar ti cl es, a nd q ua nt um d o ts
In conclusion, the laser parameters such as the laser pulse duration and the pulse energy, and the liquid environment are significant determinants for the production of SiNCs by the PLAL method. We can sum-marize that there is a tendency to produce smaller SiNCs by using lower energy with a femtosecond laser and higher energy with a nanosecond laser but we believe this issue needs further investigation. Moreover, the average diameter of SiNCs and the overall size distribution decreases with lower laser pulse durations and the liquid medium is quite important for the size of SiNCs.
0 20 40 60 80 100 Size (nm) (a) (f) Size (nm) Pulse duration (fs) 120 140 160 0 200 400 600 800 1000 0.2 0.4 0.6 0.8 1.0 20 30 40 50 60 70 80 90 100 Mean size Median 0 20 40 60 80 100 Size (nm) (b) 120 140 160 0.2 0.4 0.6 0.8 1.0 0 20 40 60 80 100 Size (nm) (c) 120 140 160 0.2 0.4 0.6 0.8 1.0 0 20 40 60 80 100 Size (nm) (e) 120 140 160 0.2 0.4 0.6 0.8 1.0 0 20 40 60 80 100 Size (nm) (d) 120 140 160 0.2 0.4 0.6 0.8 1.0
Figure 9.4 Size distribution calculated from TEM images of SiNCs obtained by laser ablation in ethanol. Pulse duration of (a) 35, (b) 100, (c) 200, (d) 600, and (e) 900 fs. Dependence on the laser pulse duration of the nanoparticle (NP) mean size with the vertical bars being the full width at half-maximum of the corresponding distribution functions and NP median (f). (From Kuzmin, P.G., et al., J. Phys. Chem. C, 114, 15266–15273, 2010. With permission.)
9.4 Physical and chemical properties of silicon nanoparticles 221 C lu st er s, na nop ar tic le s, a nd q ua nt um d o ts
9.4
PHYSICAL AND CHEMICAL PROPERTIES OF
SILICON NANOPARTICLES
The physical and chemical properties of silicon nanoparticles produced by the pulsed laser ablation method will be discussed in detail by introducing different characterization methods to explore the dif-ferent characteristics of the nanoparticles. SiNCs are characterized in terms of their physical and chemi-cal properties after they are produced by the pulsed laser ablation method. The physichemi-cal properties such as size, crystal structure, absorption, material content, and PL of nanocrystals are examined by certain characterization methods. The methods used for determining physical properties are scanning electron microscope (SEM) images, transmission electron microscope (TEM) or high-resolution TEM (HRTEM) images, selected area electron diffraction (SAED), photoluminescence emission (PLE) spectrum, absorp-tion spectrum, Fourier transform infrared (FTIR), and Raman shift (spectroscopy). The size of the SiNCs is highly related with the parameters of the pulsed laser, type of liquid environment, and ablation time. These effects are mentioned in the “Effect of laser ablation parameters on the silicon nanoparticle generation,” (Section 9.3). The size of SiNCs is determined by SEM for tens of nanometer ranges. For the smaller NCs, TEM or a high-resolution transmission microscope are generally used for several ang-strom (Å) ranges. The diameter of the SiNCs could be approximately in the range of 2–200 nm. The size diameter of SiNCs produced by the PLAL method are shown in Table 9.1 (Literature details). SiNCs are produced in the liquid environment by laser ablation. The silicon volume fraction, ϕV inside the liquid that is ablated inside is calculated by following Equation (9.3) (Mansour et al. 2012):
f = + V V V V s s L (9.3)
where Vs is the volume of the particles, VL is the volume of the liquid. The size and presence of the SiNCs are also determined by Raman spectroscopy. The Raman spectrum represents a sharp peak around at 520 cm−1 which has the asymmetricity toward the lower frequency side which proves the presence of the SiNCs in the sample (Rioux et al. 2009). The size of the SiNCs and the size dis-tribution are evaluated by deconvoluting the Raman spectrum. The functions which are used for devolution are Lorentzian, and the phonon confinement method (Richter et al. 1981; dos Santos and Torriani 1993), and Gaussian distribution function. The peak at 520 cm−1 represents the bulk Si which has a crystalline size larger than 9 nm; the peak in the 510–520 cm−1 range is coming from the small Si crystallites such as Si nanoparticles, and the 480 cm−1 peak stands for an amorphous Si (Mchedlidze et al. 2008). SiNCs are produced using the Si wafer targets having <100> or <001> states and the crystalline structure is investigated by HRTEM. The crystalline structure of nanosized mate-rial displays (111) lattice sets with an interplanary spacing of approximately 3–3.14 Å, which is a char-acteristic property of Si bulk (ablated target material) (see Table 9.1). The FTIR method is used to find the presence of SiNCs, and 1080 cm−1 shows the Si–O vibration modes in the FTIR spectra (Umezu et al. 2007). The optical properties of SiNCs are determined by absorption spectra. The absorption spectra cover a large and continuous band between 200 and 800 nm and have a typical shoulder with minima at around 400 nm (Intartaglia et al. 2012). The peaks at 485 nm and 460 nm in the absorption spectra confirm the successful production of small-sized SiNCs (Intartaglia et al. 2011). The pulsed laser influence affects the PL intensity; as the laser influence increases, the PL intensity increases, and a blue shift of PL is observed as shown in Figure 9.5 (Švrček et al. 2006).
The band gap energy of the Si bulk is Eo = 1.12 eV. Silicon bulk and nanoparticles have different band gap energies due to the quantum confinement effect. The band gap of SiNCs can be found as a function of the particle diameter, d, using the PL experimental results and the linear combination of atomic orbitals technique calculations in Equation 9.4 (Delerue et al. 1993; Ledoux et al. 2000; Meier et al. 2007):
= 0+æèç3.731.39öø÷
E E
d
Silicon nanoparticles from pulsed laser ablation 222 C lu st er s, na nop ar ti cl es, a nd q ua nt um d o ts
Bulk silicon has indirect band gap and it is reported that silicon nanoparticles produced by PLA method or other methods have an indirect band gap (Makino et al. 2005; Meier et al. 2007; Umezu et al. 2007). The band gap energy of the nanoparticles are calculated by the following Equation (9.5) (Semaltianos et al. 2010):
Eg
(
)
( )
α ω ∝ ω−1 ω − 2 (9.5)
α is the absorption coefficient, ћ is Planck constant, ω is angular frequency, and Eg is the band gap
energy. Equation 9.5 is valid for indirect band gap semiconductors. In Figure 9.6a, the linear fitting is rep-resented which exposes Eg = 1.2 eV, implying a blue shift of 0.08 eV from the band gap of Si bulk and it has
an indirect band gap. The Si nanoparticle size can be determined using Equation 9.5. For example, given Eg
and Eo values above, the size is calculated as d≈15.8 nm.
The intrinsic character of SiNCs having indirect band gap limits efficient applications. There are theoretical studies that explain the band structure can be altered by controlling the atomic arrangement in Si nanostructures (Tomańek and Schluter 1987; Delley and Steigmeier 1993; Zhou et al. 2003). SiNCs having face-centered cubic crystal structure have been produced by the PLA method with a microsecond pulse width, and light emission in the visible range was obtained (Du et al. 2007). The PLE graph is
6 8×10⁶ 4 2 0 1.0 1.2 1.4 1.6 Energy (eV) 1.8 2.0 3.6 a.u. (α ω) 1/2 (arb.unit s) 3.9 4.2 4.5 Energy (eV) PLE (a) (b) Curve A Curve B
Linear fit of curve A
4.8 5.1 5.4
Figure 9.6 PLE measurements of SiNCs which have (a) indirect band gap (from Semaltianos, N.G., et al.,
J. Nanopart. Res., 12(2), 573–580, 2010) and (b) direct band gap (from Du, X.W., et al., J. Appl. Phys., 102, 013518–
013518-4, 2007. With permission.). 6 4 2 0 2.4 2.7 6 mJ/pulse 2.4 mJ/pulse 1.1 mJ/pulse 0.07 mJ/pulse 3.0 3.3 Energy (eV) PL (a .u.) 3.6
Figure 9.5 (a) Photoluminescence spectra of SiNCs in water prepared by laser ablation of silicon wafer in deion-ized water with different laser fluences and aged for 6 months. (From Švrček, V., et al., Appl. Phys. Lett., 89, 213113, 2006. With permission.)
9.6 Applications of silicon nanoparticles produced by pulsed laser ablation method 223 C lu st er s, na nop ar tic le s, a nd q ua nt um d o ts
shown in Figure 9.6b. If the PLE of SiNCs is fitted to Equation 9.6, it represents direct band gap semi-conductor (Kux and Chorin 1996):
(
)
(
α ν ∝ ν −h)
2 h Eg (9.6)
Only curve A represents a linear behavior in Figure 9.6b, thus Equation 9.6 is fitted to curve A, and the band gap energy is calculated as 4.6 eV. The band gap energy is higher than the PL emission peak, 2.6 eV, which proposes that excitation and emission have different routes.
In relation to redox behavior, which is an important chemical property, it is reported that SiNCs represent reductive properties to noble metal ions (Yang et al. 2009b). SiNCs display reductive properties to Au3+ ions because of the overall positive redox potential for the metal ions—SiNCs system, whereas Si
microsized powders do not exhibit such reductive behavior.
9.5
POSTTREATMENT METHODS
It is quite important to obtain the silicon nanoparticles with sizes under the quantum confinement limits to display their unique properties. Thus, to obtain much smaller silicon nanoparticles, post-treatment methods are also applied and these methods will be introduced in this section. In order to obtain smaller nanoparticles, ultrasonic chemical posttreatment in HF after producing larger-sized nanoparticles by using ns pulsed laser ablation is applied (Alkis et al. 2012). The posttreatment can also be applied by a chemical-free process which has two stages: first, the particles in the range of 5–100 nm produced by the PLA method; and second, chemical-free ultrasonic and filtering posttreatment is applied to obtain smaller-sized particles in the range of 1–5.5 nm (Alkis et al. 2012). It is possible to obtain smaller SiNCs after posttreatment. The size of the nanocrystals affects the optical properties. When silicon crystallite becomes small in diameter for D≤10 nm, the Raman phonon band becomes larger and shifts down. The Raman shift is related with the crystallite size in the quantitative phonon confinement model in Equation 9.7 (Mafuné et al. 2001):
D
∆ν = −52.3 0.543 1.586 (9.7) where Δν (cm−1) is the shift of the Raman peak of SiNCs compared to bulk Si, D (nm) is the diameter of
the SiNCs. For example, if the Raman shift is observed as 2 cm−1, then such a shift stands for 4.3 nm size
of SiNCs (Abderrafi et al. 2011).
9.6
APPLICATIONS OF SILICON NANOPARTICLES PRODUCED
BY PULSED LASER ABLATION METHOD
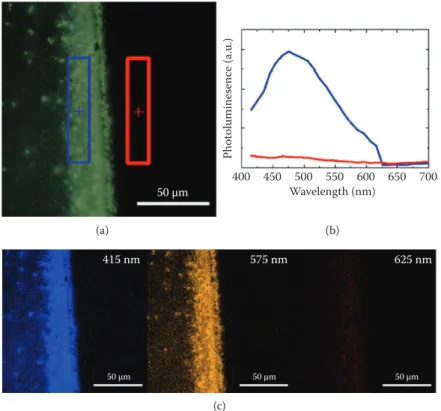
In the past decades, SiNCs have attracted attention in various application areas due to their unique elec-trical, optical, and chemical properties (Hirschman et al. 1996; Bruchez et al. 1998). Due to the quantum confinement effect, SiNCs can emit blue light (Švrček et al. 2006; Yang et al. 2008) which can be used in biomedical tagging, silicon-based full color display, and flash memories (Ding et al. 2002; Larson et al. 2003; Wang et al. 2004). SiNCs confocal microscopy studies confirm the possible use of biocompatible SiNCs for imaging applications. SiNCs having a diameter size less than 10 nm have been identified by fluorescence imaging microscopy technique (Figure 9.7) (Intartaglia et al. 2012). SiNCs are a very good candidate for fluorescence imaging of biological samples since they are biocompatible.
Reductive SiNCs have shown possible applications in pollution remediation on heavy metal ions and in wastewater or soil which are coming from industrial waste, and these are toxic to bacteria, plants, and humans (Browning 1969; Smith and Lec 1972; Brauer and Wetterhahn 1991).
Silicon nanoparticles from pulsed laser ablation 224 C lu st er s, na nop ar ti cl es, a nd q ua nt um d o ts
9.7
CONCLUSION
The PLAL mechanism was shown to be a suitable method for SiNCs generation. The effects of laser ablation parameters (pulse energy, pulse duration, laser wavelength, and liquid environment) were discussed in detail with a comprehensive literature search throughout the chapter. One can easily manipulate the physical and chemical properties of produced SiNCs by altering the laser parameters and liquid environment. Moreover, the posttreatment approach was reviewed to obtain much smaller SiNCs with superior quantum confinement effects. Finally, various applications of SiNCs produced by PLAL were discussed in detail.
REFERENCES
Abderrafi, K., G. Raul, M. B. Gongalsky, I. Suarez, R. Abarques, V. S. Chirvony, V. Y. Timoshenko, R. Ibanez, and J. P. Martínez-Pastor. 2011. Silicon Nanocrystals Produced by Nanosecond Laser Ablation in an Organic Liquid.
Journal of Physical Chemistry C 115: 5147–51. doi:10.1021/jp109400v.
Alkis, S., A. K. Okyay, and B. Ortaç. 2012. Post-Treatment of Silicon Nanocrystals Produced by Ultra-Short Pulsed Laser Ablation in Liquid: Toward Blue Luminescent Nanocrystal Generation. Journal of Physical Chemistry C 116 (5): 3432–6. doi:10.1021/jp211521k.
Belomoin, G., J. Therrien, A. Smith, S. Rao, R. Twesten, S. Chaieb, M. H. Nayfeh, L. Wagner, and L. Mitas. 2002. Observation of a Magic Discrete Family of Ultrabright Si Nanoparticles. Applied Physics Letters 80 (5): 841–3. doi:10.1063/1.1435802.
Brauer, S. L., and K. E. Wetterhahn. 1991. Chromium(VI) Forms a Thiolate Complex with Glutathione. Journal of
American Chemical Society 113 (8): 3001–7. doi:10.1021/ja00008a031.
Browning, Y. E. 1969. Chromium. In Toxicity of Industrial Metals, 2nd ed., Browning, Y.E. (editor), Butterworths, London, UK, pp. 119–31.
Bruchez, M., Jr., M. Moronne, P. Gin, S. Weiss, and A. P. Alivisatos. 1998. Semiconductor Nanocrystals as Fluorescent Biological Labels. Science 281 (5385): 2013–16. doi:10.1126/science.281.5385.2013.
400 450 500 550 600 Wavelength (nm) (a) (b) Photoluminesence (a .u.) 650 700 50 μm (c) 575 nm 415 nm 625 nm 50 μm 50 μm 50 μm
Figure 9.7 Fluorescence imaging microscopy of silicon nanoparticles prepared via the PLAL method in the low energy regime. (a) Spectral image acquired on the ring border and (b) the PL spectra relative to two different regions of inter-est. Color of the PL spectra corresponds to the color used in the covered area in the optical image; (c) Selection of channels centered at three different wavelengths. (From Intartaglia, R., et al., Opt. Mater. Exp., 2(5), 510, 2012.)
225 C lu st er s, na nop ar tic le s, a nd q ua nt um d o ts References
Delerue, C., G. Allan, and M. Lannoo. 1993. Theoretical Aspects of the Luminescence of Porous Silicon. Physical Review B 48 (15): 11024–36. doi:10.1103/PhysRevB.48.11024.
Delley, B., and E. F. Steigmeier. 1993. Quantum Confinement in Si Nanocrystals. Physical Review B 47 (3): 1397–400. doi:10.1103/PhysRevB.47.1397.
Ding, Z., B. M. Quinn, S. K. Haram, L. E. Pell, B. A. Korgel, and A. J. Bard. 2002. Electrochemistry and Electrogenerated Chemiluminescence from Silicon Nanocrystal Quantum Dots. Science (New York, N.Y) 296 (5571): 1293–7. doi:10.1126/science.1069336.
dos Santos, D. R., and I. L. Torriani. 1993. Crystallite Size Determination in Μc-Ge Films by X-Ray Diffraction and Raman Line Profile Analysis. Solid State Communications 85 (4): 307–10. doi:10.1016/0038-1098(93)90021-E.
Du, X. W., W. J. Qin, Y. W. Lu, X. Han, Y. S. Fu, and S. L. Hu. 2007. Face-Centered-Cubic Si Nanocrystals Prepared by Microsecond Pulsed Laser Ablation. Journal of Applied Physics 102 (1), 013518–013518-4. doi:10.1063/1.2752785. Hirschman, K. D., L. Tsybeskov, S. P. Duttagupta, and P. M. Fauchet. 1996. Silicon-Based Visible Light-Emitting
Devices Integrated into Microelectronic Circuits. Nature 384 (6607): 338–41. doi:10.1038/384338a0. Intartaglia, R., K. Bagga, F. Brandi, G. Das, A. Genovese, E. Di Fabrizio, and A. Diaspro. 2011. Optical Properties
of Femtosecond Laser-Synthesized Silicon Nanoparticles in Deionized Water. Journal of Physical Chemistry C 115 (12): 5102–7. doi:10.1021/jp109351t.
Intartaglia, R., K. Bagga, M. Scotto, A. Diaspro, and F. Brandi. 2012. Luminescent Silicon Nanoparticles Prepared by Ultra Short Pulsed Laser Ablation in Liquid for Imaging Applications. Optical Materials Express 2 (5): 510. doi:10.1364/OME.2.000510.
Intartaglia, R., A. Barchanski, K. Bagga, A. Genovese, G. Das, P. Wagener, E. D. Fabrizio, A. Diaspro, F. Brandi, and S. Barcikowski. 2012. Bioconjugated Silicon Quantum Dots from One-Step Green Synthesis. Nanoscale 4 (4): 1271. doi:10.1039/c2nr11763k.
Kabashin, A. V., and Meunier, M. 2006. Laser ablation-based synthesis of functionalized colloidal nanomaterials in biocompatible solutions. Journal of Photochemistry and Photobiology A: Chemistry, 182(3): 330–4.
Khang, Y., and J. Lee. 2010. Synthesis of Si Nanoparticles with Narrow Size Distribution by Pulsed Laser Ablation.
Journal of Nanoparticle Research 12 (4): 1349–54. doi:10.1007/s11051-009-9669-z.
Knipping, J., Wiggers, H., Rellinghaus, B., Roth, P., Konjhodzic, D., and Meier, C. 2004. Synthesis of high purity silicon nanoparticles in a low pressure microwave reactor. Journal of nanoscience and nanotechnology, 4(8): 1039-44.
Kůsová, K., O. Cibulka, K. Dohnalová, I. Pelant, J. Valenta, A. Fǔcíková, K. Žídek, et al. 2010. Brightly Luminescent Organically Capped Silicon Nanocrystals Fabricated at Room Temperature and Atmospheric Pressure. ACS Nano 4 (8): 4495–504. doi:10.1021/nn1005182.
Kux, A., and M. B. Chorin. 1996. Red, Green and Blue Luminescence in Porous Silicon Excitation Spectra. Thin Solid
Films 276: 272–5.
Kuzmin, P. G., G. A. Shafeev, V. V. Bukin, S. V. Garnov, C. Farcau, R. Carles, B. Warot-Fontrose, V. Guieu, and G. Viau. (2010). Silicon Nanoparticles Produced by Femtosecond Laser Ablation in Ethanol: Size Control, Structural Characterization, and Optical Properties. The Journal of Physical Chemistry C 114(36): 15266–73. Larson, D. R., W. R. Zipfel, R. M. Williams, S. W. Clark, M. P. Bruchez, F. W. Wise, and W. W. Webb. 2003.
Water-Soluble Quantum Dots for Multiphoton Fluorescence Imaging in Vivo. Science (New York, NY) 300 (5624): 1434–6. doi:10.1126/science.1083780.
Ledoux, G., O. Guillois, D. Porterat, C. Reynaud, F. Huisken, B. Kohn, and V. Paillard. 2000. Photoluminescence Properties of Silicon Nanocrystals as a Function of Their Size. Physical Review B 62 (23): 15942–51. doi:10.1103/ PhysRevB.62.15942.
Li, X., Y. He, and M. T. Swihart. 2004. Surface Functionalization of Silicon Nanoparticles Produced by Laser-Driven Pyrolysis of Silane Followed by HF-HNO 3 Etching. Langmuir 20 (11): 4720–7. doi:10.1021/la036219j. Luterova, K., K. Dohnalova, V. Svrcek, I. Pelant, J.-P. Likforman, O. Cregut, P. Gilliot, and B. Hönerlage. 2016.
Optical Gain in Porous Silicon Grains Embedded in Sol-Gel Derived SiO2 Matrix under Femtosecond Excitation. Applied Physics Letters 84 (17): 3280–2.
Mafuné, F., J. Kohno, and Y. Takeda. 2001. Formation of Gold Nanoparticles by Laser Ablation in Aqueous Solution of Surfactant. The Journal of Physical Chemistry B 105 (22): 5114–20. http://pubs.acs.org/doi/abs/10.1021/jp0037091. Makino, T., M. Inada, I. Umezu, and A. Sugimura. 2005. Structural and Optical Properties of Surface-Hydrogenated
Silicon Nanocrystallites Prepared by Reactive Pulsed Laser Ablation. Journal of Physics D: Applied Physics 38 (18): 3507–11. doi:10.1088/0022-3727/38/18/028.
Mangolini, L., E. Thimsen, and U. Kortshagen. 2005. High-Yield Plasma Synthesis of Luminescent Silicon Nanocrystals. Nano Letters 5 (4): 655–9. doi:10.1021/nl050066y.
Mansour, N., A. Momeni, R. Karimzadeh, and M. Amini. 2012. Blue-Green Luminescent Silicon Nanocrystals Fabricated by Nanosecond Pulsed Laser Ablation in Dimethyl Sulfoxide. Optical Materials Express 2 (6): 740–8. doi:10.1364/OME.2.000740.
Silicon nanoparticles from pulsed laser ablation 226 C lu st er s, na nop ar ti cl es, a nd q ua nt um d o ts
Mchedlidze, T., T. Arguirov, S. Kouteva-Arguirova, M. Kittler, R. Rölver, B. Berghoff, D. Bätzner, and B. Spangenberg. 2008. Light-Induced Solid-to-Solid Phase Transformation in Si Nanolayers of Si-SiO2 Multiple Quantum Wells.
Physical Review B 77: 2–5. doi:10.1103/PhysRevB.77.161304.
Meier, C., A. Gondorf, S. Lüttjohann, A. Lorke, and H. Wiggers. 2007. Silicon Nanoparticles: Absorption, Emission, and the Nature of the Electronic Bandgap. Journal of Applied Physics 101 (10): 103112. doi:10.1063/1.2720095. Pavesi, L., L. D. Negro, C. Mazzoleni, G. Franzò, and F. Priolo. 2000. Optical Gain in Silicon Nanocrystals. Nature
408 (6811): 440–4. doi:10.1038/35044012.
Richter, H., Z. P. Wang, and L. Ley. 1981. The One Phonon Raman Spectrum in Microcrystalline Silicon. Solid State
Communications 39 (5): 625–9. doi:10.1016/0038-1098(81)90337-9.
Rioux, D., M. Laferrière, A. Douplik, D. Shah, L. Lilge, A. V. Kabashin, and M. M. Meunier. 2009. Silicon
Nanoparticles Produced by Femtosecond Laser Ablation in Water as Novel Contamination-Free Photosensitizers.
Journal of Biomedical Optics 14 (2): 021010. doi:10.1117/1.3086608.
Rosso-Vasic, M., E. Spruijt, Z. Popovic, K. Overgaag, B. van Lagen, B. Grandidier, D. Vanmaekelbergh, D. Dominguez-Gutierrez, L. De Cola, and H. Zuilhof. 2009. Amine-Terminated Silicon Nanoparticles: Synthesis, Optical Properties and Their Use in Bioimaging. Journal of Materials Chemistry 19 (33): 5926–33. doi:10.1039/b902671a.
Semaltianos, N. G., S. Logothetidis, W. Perrie, S. Romani, R. J. Potter, S. P. Edwardson, P. French, M. Sharp, G. Dearden, and K. G. Watkins. 2010. Silicon Nanoparticles Generated by Femtosecond Laser Ablation in a Liquid Environment. Journal of Nanoparticle Research 12 (2): 573–80. doi:10.1007/s11051-009-9625-y. Smith, R. G., and Lec, D. H. K. 1972. Chromium in Metallic Contaminants and Human Health. Academic Press,
New York.
Stupca, M., M. Alsalhi, T. Al Saud, A. Almuhanna, and M. H. Nayfeh. 2007. Enhancement of Polycrystalline Silicon Solar Cells Using Ultrathin Films of Silicon Nanoparticle. Applied Physics Letters 91 (6): 1–4. doi:10.1063/1.2766958.
Švrček, V., and M. Kondo. 2009. Blue Luminescent Silicon Nanocrystals Prepared by Short Pulsed Laser Ablation in Liquid Media. Applied Surface Science 255 (24): 9643–6. doi:10.1016/j.apsusc.2009.04.126.
Švrček, V., T. Sasaki, Y. Shimizu, and N. Koshizaki. 2006. Blue Luminescent Silicon Nanocrystals Prepared by Ns Pulsed Laser Ablation in Water. Applied Physics Letters 89 (21): 213113. doi:10.1063/1.2397014.
Tomańek, D., and M. A. Schluter. 1987. Structure and Bonding of Small Semiconductor Clusters. Physical Review B 36 (2): 1208–17. doi:10.1103/PhysRevB.36.1208.
Umezu, I., H. Minami, H. Senoo, and A. Sugimura. 2007. Synthesis of Photoluminescent Colloidal Silicon Nanoparticles by Pulsed Laser Ablation in Liquids. Journal of Physics: Conference Series 59 (1): 392–5. doi:10.1088/1742-6596/59/1/083.
Walters, R. J., G. I. Bourianoff, and H. A. Atwater. 2005. Field-Effect Electroluminescence in Silicon Nanocrystals.
Nature Materials 4 (2): 143–6. doi:10.1038/nmat1307.
Wang, G., S. T. Yau, K. Mantey, and M. H. Nayfeh. 2008. Fluorescent Si Nanoparticle-Based Electrode for Sensing Biomedical Substances. Optics Communications 281 (7): 1765–70. doi:10.1016/j.optcom.2007.07.070. Wang, L., V. Reipa, and J. Blasic. 2004. Silicon Nanoparticles as a Luminescent Label to DNA. Bioconjugate Chemistry
15 (2): 409–12. doi:10.1021/bc030047k.
Warner, J. H., H. Rubinsztein-Dunlop, and R. D. Tilley. 2005. Surface Morphology Dependent Photoluminescence from Colloidal Silicon Nanocrystals. Journal of Physical Chemistry B 109 (41): 19064–7. doi:10.1021/jp054565z. Wolkin, M., J. Jorne, P. Fauchet, G. Allan, and C. Delerue. 1999. Electronic States and Luminescence in Porous Silicon
Quantum Dots: The Role of Oxygen. Physical Review Letters 82: 197–200. doi:10.1103/PhysRevLett.82.197. Yang, G. W. 2007. Laser Ablation in Liquids: Applications in the Synthesis of Nanocrystals. Progress in Materials Science
52 (4): 648–98. doi:10.1016/j.pmatsci.2006.10.016.
Yang, G.-W., J.-B Wang, and Q.-X. Liu. 1999. Preparation of Nano-Crystalline Diamonds Using Pulsed Laser Induced Reactive Quenching. Journal of Physics: Condensed Matter 10 (35): 7923–7. doi:10.1088/0953-8984/10/35/024. Yang, S., W. Cai, G. Liu, H. Zeng, and P. Liu. 2009a. Optical Study of Redox Behavior of Silicon Induced by Laser
Ablation in Liquid. Journal of Physical Chemistry C 113 (16): 6480–4. doi:10.1021/jp810787d.
Yang, S., W. Cai, H. Zeng, and Z. Li. 2008. Polycrystalline Si Nanoparticles and Their Strong Aging Enhancement of Blue Photoluminescence. Journal of Applied Physics 104 (2): 023516. doi:10.1063/1.2957053.
Yang, S., W. Cai, H. Zhang, X. Xu, and H. Zeng. 2009b. Size and Structure Control of Si Nanoparticles by Laser Ablation in Different Liquid Media and Further Centrifugation Classification. The Journal of Physical Chemistry C 113 (44): 19091–5. doi:10.1021/jp907285f.
Zhang, X., D. Neiner, S. Wang, A. Y. Louie, and S. M. Kauzlarich. 2007. A New Solution Route to Hydrogen-Terminated Silicon Nanoparticles: Synthesis, Functionalization and Water Stability. Nanotechnology 18 (9): 095601. doi:10.1088/0957-4484/18/9/095601.
Zhou, Z., L. Brus, and R. Friesner. 2003. Electronic Structure and Luminescence of 1 . 1- and 1 . 4-Nm Silicon Nanocrystals : Oxide Shell versus Hydrogen Passivation. Nano Letters 3 (2): 163–7. doi:10.1021/nl025890q.