Nanotechnology
PAPER
Force and time-dependent self-assembly,
disruption and recovery of supramolecular peptide
amphiphile nanofibers
To cite this article: F Begum Dikecoglu et al 2018 Nanotechnology 29 285701
View the article online for updates and enhancements.
Related content
Self-assembled peptide nanostructures for functional materials
Melis Sardan Ekiz, Goksu Cinar, Mohammad Aref Khalily et al.
-RGD-bearing peptide-amphiphile-hydroxyapatite nanocomposite bone scaffold: an in vitro study
Soner Çakmak, Anl Sera Çakmak and Meneme Gümüdereliolu
-A hybrid biomimetic scaffold of electrospun PCL and self-assembled PAs
Ajay Tambralli, Bryan Blakeney, Joel Anderson et al.
-Force and time-dependent self-assembly,
disruption and recovery of supramolecular
peptide amphiphile nano
fibers
F Begum Dikecoglu
1,2, Ahmet E Topal
1, Alper D Ozkan
1, E Deniz Tekin
3,
Ayse B Tekinay
1,6, Mustafa O Guler
4,6and Aykutlu Dana
1,5,61
Institute of Materials Science and Nanotechnology and National Nanotechnology Research Center (UNAM), Bilkent University, Ankara, 06800, Turkey
2
Institute of Biophysics, Johannes Kepler University Linz, Gruberstrasse 40, A-4020 Linz, Austria
3
University of Turkish Aeronautical Association, Faculty of Engineering, Ankara, 06790, Turkey
4
Institute for Molecular Engineering, University of Chicago, Chicago, IL 60637, United States of America
5
E. L. Ginzton Laboratory, Stanford University, CA 94305, United States of America E-mail:[email protected],[email protected]@stanford.edu
Received 13 February 2018, revised 2 April 2018 Accepted for publication 17 April 2018
Published 10 May 2018 Abstract
Biological feedback mechanisms exert precise control over the initiation and termination of molecular self-assembly in response to environmental stimuli, while minimizing the formation and propagation of defects through self-repair processes. Peptide amphiphile(PA) molecules can self-assemble at physiological conditions to form supramolecular nanostructures that structurally and functionally resemble the nanofibrous proteins of the extracellular matrix, and their ability to reconfigure themselves in response to external stimuli is crucial for the design of intelligent biomaterials systems. Here, we investigated real-time self-assembly, deformation, and recovery of PA nanofibers in aqueous solution by using a force-stabilizing double-pass scanning atomic force microscopy imaging method to disrupt the self-assembled peptide nanofibers in a force-dependent manner. We demonstrate that nanofiber damage occurs at tip-sample interaction forces exceeding 1 nN, and the damagedfibers subsequently recover when the tip pressure is reduced. Nanofiber ends occasionally fail to reconnect following breakage and continue to grow as two individual nanofibers. Energy minimization calculations of nanofibers with increasing cross-sectional ellipticity(corresponding to varying levels of tip-induced fiber deformation) support our observations, with high-ellipticity nanofibers exhibiting lower stability compared to their non-deformed counterparts. Consequently, tip-mediated mechanical forces can provide an effective means of altering nanofiber integrity and visualizing the self-recovery of PA assemblies. Supplementary material for this article is availableonline
Keywords: atomic force microscopy, self-assembly, recovery, peptide amphiphile, nanofibers, biomaterials
(Some figures may appear in colour only in the online journal) 1. Introduction
Self-assembly allows the building of complex, tunable, adaptable and highly sophisticated biomolecules in a broad
range of three-dimensional (3D) configurations through bot-tom-up fabrication involving noncovalent interactions (i.e. hydrogen bonding, hydrophobic, electrostatic and van der Waals interactions) [1–3]. Self-assembly is a process of organization through which disordered components of a system spontaneously associate to form well-defined Nanotechnology 29(2018) 285701 (12pp) https://doi.org/10.1088/1361-6528/aabeb4
6
architectures, and occurs ubiquitously in nature at all scales, including molecules and living cells [4, 5]. Peptide amphi-philes (PAs) are versatile self-assembling biomaterials that form a variety of supramolecular 1D nanostructures, with a predilection for cylindrical nanofibers. PAs are amphiphilic molecules that contain a hydrophobic alkyl tail linked to a hydrophilic amino acid sequence, the latter of which can be tailored for specific biomedical applications [3, 6, 7]. Non-covalent interactions between these regions stimulate the formation of high-aspect-ratio nanostructures under certain environmental conditions (i.e. pH, ionic strength and temperature), with β-sheet secondary structures typically predominating in the resulting superstructure. Since the self-assembly process in PA molecules is governed by indi-vidually weak noncovalent interactions, PA nanostructures are highly dynamic and prone to partial disassembly and reassembly. As such, PA assemblies may be disrupted in response to external factors and subsequently repaired through self-healing processes[1,8,9]. In contrast, polymers cannot undergo reassembly without the addition of catalysts [10], and the ability of the PA networks to self-assemble and self-repair through noncovalent interactions contributes greatly to their potential as biomedical materials. Owing to their dynamic composition, self-assembled PA nanofibers are also outstanding candidates for investigating the self-assem-bly and self-recovery mechanisms that occur in biological systems.
Due to their relevance to neurodegenerative disorders, the self-assembly and disassembly of amyloid fibers and similar peptide nanostructures have been widely studied in the literature. Liang et al developed models for the formation of mature amyloid fibers from preliminary aggregates through time-lapse fluorescence imaging [11]. Nucleation of a silk-elastin-like peptide amyloid was directly observed using time-lapse atomic force microscopy(AFM) in more recent studies, where the assembly process was accelerated under nano-mechanical stimulus and the growth direction of amyloid fibers was influenced by the direction of AFM tip scanning [12–14]. In addition, a mechanical manipulation method based on AFM was used to divide self-assembled GAV-9 peptide nanofilaments into fragments that were subsequently repaired in situ[15]. Very recently, Karsai et al conducted a detailed work on the formation and assembly mechanisms of amyloid fibrils under mechanical perturbation using time-dependent and high-resolution AFM imaging, where fibrils were fragmented in multiple directions by increased force loads during scanning, and the repair of sectionedfibrils was followed in five-minute scan intervals [16]. Watanabe-Nakayama et al also investigated fibril formation and elon-gation in an amyloidβ-protein fragment (A β1-42), and found that environmental variables such as buffer salts can stimulate the formation of either straight or helical assemblies due to changes in thefibril extension process [17]. Similar studies on the effectiveness of environmental conditions in altering the self-assembly of protein structures have been performed by Dai et al, who showed that higher NaCl and MgCl2 salt concentrations stimulate the formation of vertically stacked GAV-9 peptide layers, and by Roeters et al, who reported that
the structure of alpha-synuclein fibrils was strongly influ-enced by the ionic strength of the buffer environ-ment[18,19].
The ability of scaffolds to recover from damage is crucial for their applications in regenerative medicine, as these materials must actively repair and replace the fibrillar extra-cellular matrix elements that are lost in major injuries and degenerative disorders. As such, a number of self-healing peptide hydrogels have previously been designed for appli-cations in tissue regeneration [1, 20–25]. Yokoi et al demonstrated the kinetics of the reassembly process in an ionic self-complementary peptide nanofiber hydrogel, RADA16-I, with both experimental and simulation studies [8]. Sano et al synthesized mechanically stable and tough PEG cross-linked F-actin gels that exhibited self-repairing ability through polymerization and depolymerization under repeated shear stress [26]. Recently, Clarke et al showed using traditional rheology measurements that self-assembled polyglutamic acid peptide hydrogels exhibited the capacity for self-renewal when mixed with polymers, highlighting the potential of such systems for use in tissue engineering and biomedical applications [21]. In addition, the self-assembly mechanism of PA molecules[2,6,27–34] and their reconfi-guration in response to external stimuli(i.e. pH, temperature, ionic strength) [35–37] have been extensively studied due to their relevance to the design of advanced functional materials, and nanoscale assembly behavior of the PA molecules has been investigated under various environmental conditions through molecular dynamics(MD) simulations [38–42].
In this study, we use AFM to investigate the changes that occur during the charge neutralization-mediated self-assem-bly of a two-PA system in aqueous environment. The system used for this purpose consists of two oppositely charged PA molecules that co-assemble in the presence of each other and were previously utilized in a range of biomedical applications, including local drug delivery[43], controlled release [44], and osteoinduction of mesenchymal stem cells [45]. Nanofiber nucleation occurred on mica through the deposition of small aggregates from the peptide solution and proceeded through nanofiber formation and limited branching, possibly follow-ing the trajectories formed by the atomic steps on the mica surface[15,46–48]. Nanofiber disruption could be performed by increasing the force applied by the AFM tip, and the nanofiber was observed to break at forces over 1 nN. Nano-fiber disassembly was followed by a repair process that occurred from both ends of the damaged nanofibers, which occasionally failed to reconnect and developed as two indi-vidual nanofibers. Energy minimization (EM) simulations showed that nanofibers could tolerate a limited amount of force-mediated pressure (as measured by cross-sectional ellipticity), but disruptions in the nanofiber backbone were observed at higher deformation values. We demonstrate that oppositely charged co-assembled PA nanofibers can serve as effective models for the study of the self-assembly process at the nanoscale, and that tip-mediated mechanical forces can be used in situ to facilitate the deformation and show the time-dependent self-recovery of nanofiber systems.
2. Methods
All protected amino acids, lauric acid, Rink amide MBHA resin and 2-(1H-benzotriazol-1-yl)-1,1,3,3-tetramethyluronium hexafluorophosphate (HBTU) were purchased from Nova-biochem. Other chemicals used for peptide synthesis, including dichloromethane(DCM), dimethylformamide (DMF), acetoni-trile, piperidine, acetic anhydride, N,N-diisopropylethylamine (DIEA), and trifluoroacetic acid (TFA) were purchased from Fisher, Merck, Alfa Aesar or Sigma-Aldrich. All chemicals and solvents used in this study were analytical grade. Muscovite mica sheets and pyramidal silicon nitride(SiNi) AFM probes used for AFM experiments were purchased from Electron Microscopy Sciences and NanoandMore.
Two oppositely charged PAs, E3PA (Lauryl-Val-Val-Ala-Gly-Glu-Glu-Glu) and K3PA (Lauryl-Val-Val-Ala-Gly-Lys-Lys-Lys-Am), were synthesized using Fmoc solid phase peptide synthesis method. Rink amide MBHA resin was used as the solid support for the synthesis of K3PA, while Fmoc-Glu(OtBu)-Wang resin was used for E3PA. Both PA molecules were synthesized at a 0.50 mmol scale. Amino acid couplings were performed by adding 2 equivalents of fluorenylmethyloxycarbonyl (Fmoc) pro-tected amino acids, 1.95 equivalents O-benzotriazole-N,N, N′,N′-tetramethyluronium-hexafluorophosphate (HBTU) and 3 equivalents of N,N-DIEA to 1 equivalent mol of resin and shaking for at least 2 h in each cycle. Fmoc protecting groups on amino acids were removed at the end of each coupling step with 20% piperidine/DMF for 20 min. Lauric acid served as the source of the lauryl group and its cou-pling mechanism was similar to amino acid coucou-pling. A 10% acetic anhydride−DMF solution was used to acetylate the unreacted amine groups after each coupling step. Cleavage of protecting groups and peptide molecules from the solid support was carried out by a TFA cleavage cocktail (95% TFA, 2.5% water, 2.5% triisopropylsilane) for 2 h. Excess TFA and DCM from the peptide solution were removed by rotary evaporation. The rest of the peptide solution in the round-bottom flask was precipitated in die-thyl ether at −20 °C overnight. The precipitate was col-lected by centrifugation and dissolved in ultrapure water. This solution was frozen at−80 °C, lyophilized and stored at−20 °C.
The purity of the peptides was assessed with liquid chromatography and mass spectrometry (LC-MS) using an Agilent 6530 quadrupole time-of-flight mass spectrometer equipped with an electrospray ionization source and a reverse-phase analytical high-performance LC system. 1 mg ml−1 K3PA in water was analyzed at pH 7 using a Phenomenex Luna 3μ C8 100 Å column (50×3.0 mm) in a gradient of water(0.1% formic acid) and acetonitrile (0.1% formic acid). 1 mg ml−1E3PA in water was analyzed at pH 7
using a Phenomenex Gemini 3μ C8 110 Å column
(50×4.6 mm) in a gradient of water (0.1% NH4OH) and acetonitrile(0.1% NH4OH).
Stock solutions of E3PA and K3PA were prepared separately at 1%(w/v) concentration by dissolving in water, and the pH of the individual solutions was adjusted to 7.4
using 1 M NaOH. All stock solutions were diluted with water to 25μM concentration for AFM measurements. Solutions were sonicated for at least 15 min for the disassembly of peptide aggregates prior to their mixing. Shortly after, 300μl of negatively charged E3PA solution was mixed with 400μl of positively charged K3PA solution at a 3:4 volumetric ratio to promote self-assembly on freshly cleaved muscovite mica surfaces(25×25 μm size and 0.26–0.31 mm thickness) [49]. Contact mode imaging was used for the imaging of PA nanofibers using silicon nitride cantilevers with a nominal stiffness of k=0.06±0.03 N m−1 (Budget Sensors, Inno-vative Solutions Bulgaria Ltd). Prior to the mechanical ana-lysis of peptide nanofibers, spring constants of the cantilevers were measured using the thermal method and found to be ca. 0.04 N m−1.
A commercial atomic force microscope (MFP3D, Asy-lum Research) was used for all AFM experiments. A novel double-pass method was implemented using an auxiliary data acquisition system to stabilize thermal drifts in the cantilever deflection (figure S2 is available online at stacks.iop.org/ NANO/29/285701/mmedia). In this DC-stabilized imaging method, a double-pass scheme is used to first measure the baseline of cantilever deflection while the tip is 1 μm away from the surface, and this baseline is subtracted from the deflection signal before input to the feedback system during topography acquisition. Using the developed method and cantilevers with spring constants in the 0.04 N m−1 range, stable contact mode imaging in fluid can be achieved with force set points of 100 pN over prolonged durations. Force maps were taken at a resolution of 32×32 in 2×2 μm areas using a force–distance of 1 μm and scan rate of 2 Hz. Time-lapse images of nanofiber formation were also taken in 5×5 μm areas at a scan rate of 5 Hz, with each image being acquired in roughly 1 min. Similarly, disassembly and recovery images were measured in 1×1 μm areas and at a scan rate of 1.95 Hz, with each image being acquired in roughly 4 min. In order to analyze the force–distance mea-surements, custom programs (Matlab and IGOR Pro Soft-ware) was used to process the obtained data. All images were acquired at a resolution of 512×256 points and lines, respectively.
Secondary structures of individual PAs and their mixture were determined with circular dichroism (CD) method by using a JASCO J-815 CD spectrometer at room temperature. 1% (w/v) stock solution (11 mM) of E3PA and K3PA were diluted to 1 mM and mixed at a 3:4 volume ratio for charge neutralization. The sample was aged overnight and diluted to 0.33 mM for measurement. Individual PA samples were also measured at the same concentration. Samples were measured in quartz cuvettes with 1 mm path length. CD spectra were obtained from 300 to 190 nm at a 0.1 nm data pitch, 100 nm min−1 scanning speed, 1 nm band width and 4 s digital integration time. An average of three measurements were taken for each sample.
Nile Red assay was conducted to determine the minimum concentration at which the self-assembly process occurs in E3PA, K3PA and E3PA/K3PA samples. Nile Red is a dye that shows a blue shift in its emission spectrum in hydrophobic
environment, such as that provided by the core of self-assembled nanofibers. 6.4 μl of Nile Red in ethanol (78.12 μM) was added onto 2 ml of each PA solution (E3PA, K3PA, and E3PA/K3PA) at different concentrations (0.24–1000 μM) and aged for 24 h at room temperature. Nile Red concentration was held constant at 250 nM in the final mixture. Measurements were conducted using a Cary Eclipse fluorescence spectrophotometer with samples in 10 mm quartz cells. Fluorescence emission spectra were recorded from 550 to 750 nm with an excitation wavelength of 550 nm. Blue shifts were determined by subtracting the maximum emission wavelength of Nile Red in the sample from the emission wavelength of Nile Red in water. Shifts in λmax were plotted against different concentrations to observe the lowest aggregation concentrations for each group, where a sharp transition in concentration-dependent blue shift results was assumed to indicate the threshold of critical aggrega-tion[50].
Samples were prepared for transmission electron micro-scopy (TEM) imaging by mixing 1 mM E3PA and K3PA solutions at a 3:4 ratio, casting the mixture on a carbon-coated copper grid, and incubating for 5 min. The excess sample was removed at the end of the incubation period, and the grid was washed with deionized water. The sample was then stained with 3μl of 2% (w/v) aqueous uranyl acetate, washed with water, and air-dried. Imaging was performed with a FEI Tecnai G2 F30 transmission electron microscope.
Scanning electron microscopy (SEM) was used to observe co-assembled PA nanofiber networks. A 1% (w/v) concentration (11 mM) of PA sample was cast on a clean silicon wafer surface. The water content of the sample was replaced with increasing concentrations of ethanol (20%, 40%, 60% and 80%) for 20 min per cycle to avoid fiber collapse during dehydration, and the samples were subse-quently transferred to 100% ethanol for at least 2 h. Ethanol was removed by a Tousimis Autosamdri-815B CPD to pre-serve the network structures, and the sample was sputter-coated with 6 nm Au Pd−1 prior to imaging. A FEI Quanta 200 FEG scanning electron microscope with an ETD detector was used for the visualization of resulting networks.
EM simulations were carried out with Gromacs 5.11 [51]. and representative snapshots were created using the Visual MD software[52]. Model nanofibers used simulation studies were constructed using two oppositely charged PA molecules; E3PA(Lauryl-Val-Val-Ala-Gly-Glu-Glu-Glu) and K3PA (Lauryl-Val-Val-Ala-Gly-Lys-Lys-Lys-Am). A single layer of 10 PA molecules was initially formed by arranging 5 E3PA and 5 K3PA molecules in a circular configuration, with 36° between each PA molecule. In addition, individual PA molecules were tilted at a 90° angle with respect to this planar axis, and their alkyl tails were pointed inwards at each layer to emulate the hydrophobic clustering effect that is observed under experimental conditions (figure 4(a)). 19 copies of these single layers were stacked on top of each other, and each layer was rotated at an angle of 18° with respect to the previous. Then, the plane where the PAs were located was also tilted by 60° to obtain a cone-like cylindrical system.
This model was used in accordance to preliminary
simulations showing that fibers formed in this manner were more stable than fibers formed without tilting the PA mole-cules and the plane[38,40]. In addition, the radius of the fiber formed in this configuration is closer to fiber diameters observed under AFM imaging(ca. 4.5 nm). A new parameter, called modified eccentricity, was also defined to model the deformation of the peptide nanofibers under the AFM tip. A parameter, called ellipticity, was also used to model the deformation of the peptide nanofibers under the AFM tip. This parameter, which denotes a circular cross-section at zero, was changed from 0.01 to 0.25 in 0.05 steps (figure 4(b)). Following the initial generation of PA fibers, each structure was placed in a rhombic dodecahedron unit cell under a minimum image convention, in which the nanofiber was placed at the center of the box at a distance 1.0 nm from the sides. The box was thenfilled with SPC-type water molecules [53] and 95 Na+ions were added to neutralize the system’s total charge. A 1000 step EM was then applied to each sol-vated, electro-neutral system using the steepest-descent algorithm to identify the stability of PA nanofibers under varying ellipticity values.
3. Results and discussion
3.1. Supramolecular assembly of PAs in solution
Two oppositely charged PA molecules (E3PA and K3PA) were designed as in figure 1(a) and synthesized using the Fmoc solid phase peptide synthesis method(figure S1) [54]. The PA molecules used in this study are composed of a hydrophobic alkyl tail that is conjugated to aβ-sheet forming pattern (–VVAG–) and either positively- or negatively charged amino acid residues(–EEE or –KKK). This config-uration triggers the co-assembly of PA molecules into cylindrical micellar structures through noncovalent interac-tions (i.e. electrostatic interactions, hydrogen bonding and hydrophobic interactions) in aqueous conditions. The mor-phological properties of co-assembled PA nanofibers were observed by SEM and TEM (figures 1(b), (c)). CD spectroscopy was used to investigate the secondary structures of E3PA, K3PA and mixed E3PA/K3PA systems(figure1(d)). The CD spectra of the E3PA/K3PA mixture revealed positive and negative signals at around 200 and 220 nm, respectively, corresponding to a twisted β-sheet conformation, while unmixed PA molecules showed negative peaks at ca. 195 nm, which is consistent with the random coil structure[55,56]. To investigate the differences in the aggregation behavior of mixed and unmixed E3PA and K3PA, critical aggregation concentrations of individual PA molecules and their mixture were determined using a Nile Red assay (figure 1(e)). For E3PA and K3PA, micelle formation was only observed at a concentration of∼100 μM and ∼200 μM, respectively, while the co-assembled E3PA/K3PA system could form micelles at a concentration of ∼4 μM. The PA concentrations used for AFM experiments was above the experimental critical aggregation concentration of the E3PA/K3PA mixture.
3.2. Co-assembly of oppositely charged PA molecules
The mechanism of nanofiber formation by oppositely charged PA nanostructures was investigated in real-time using time-lapsed imaging on a mica surface in aqueous environment. Frames representing nanofiber growth, mea-sured over 10 min at a scanning rate of 1 frame per min, are shown in figure 2(a). We initially observed smaller aggre-gates [11] formed dynamically on the surface, which sub-sequently acted as nucleation points and eventually facilitated the development of mature nanofibers. The growth rate of the nanofibers over time is shown in figure2(b) and was calculated based on the average growth of ten fibers traced from each image in figure 2(a). The elongation rate for each individual peptide nanofiber ranges from 60 to 140 nm min−1. Growth of nanofibers continued until the surface was covered in a static nanofiber network (figure 2(c), supporting movie 1). Detailed investigation suggests that nanofiber growth occurs through ‘advancing fronts’ at either end of each nanofiber, and that branching growth, potentially facilitated by defects on nanofiber sur-faces, is more prominent during earlier stages of nanofiber formation. Nanofibers were incapable of extending over one another and following contact between the advancing front of one nanofiber and the body of another, the elongation process either stopped or continued in parallel with the encountered fiber (figure 2(d)). Bundles formed by fiber-fiber contacts, rather than branching, therefore appears to drive the maturation of the nanofiber structure.
It is likely that the negatively charged mica surface assists in fiber extension through electrostatic interactions with the positively charged lysine residue of K3PA, which prevents the developing fiber from leaving the surface and extending over anotherfiber. The charge of the mica surface was observed to strongly influence the assembly behavior of individual PA molecules (K3PA and E3PA), which have greater surface charges compared to the co-assembled system: positively charged K3PA molecules form surface nanofibers significantly faster than the charge-neutralized E3PA/K3PA (figure S7), while the negatively charged E3PA molecules do not show anyfiber formation on mica surfaces within ca. 3 h (figure S8). As such, time-lapsed images of K3PA molecules were acquired within 1 h to prevent excessive surface cov-erage, while the E3PA/K3PA system could be monitored for more than 2.5 h to observe the nucleation and growth mechanisms of peptide nanofibers in detail. A concentration of 25μM was chosen for the imaging of the E3PA/K3PA system, as even the positively charged K3PA molecules were slow to form nanofiber networks under 5 μM concentration (supporting movie 2).
In addition to surface effects, the movement of the AFM tip can also modulate fiber formation by attracting peptide monomers through electrostatic interactions, physically dragging small assemblies over the surface, or creating disruptions in existing nanofibers that can serve as extension points for subsequent growth phases. Indeed, areas that were imaged extensively were observed to exhibit much denser nanofiber networks than the surrounding regions (figure S3),
Figure 1.(a) Chemical representations of K3PA and E3PA molecules. SEM(b) and TEM (c) images of co-assembled E3PA/K3PA
nanofibers. (d) CD spectra showing the secondary structures of E3PA, K3PA, and E3PA/K3PA.(e) Nile Red assay of E3PA, K3PA, and
and other studies have previously shown that the AFM tip can be used to pattern self-assembled peptidefiber structures [12, 14]. Nevertheless, the lack of large-scale fiber dis-placements suggests that the mature peptide fibers adhere strongly to the mica surface through charge interactions, and that tip-induced lateral movements are limited to small dislocations.
A histogram of nanofiber diameters was also produced using Hough transform analysis(see supporting information), and the average nanofiber diameter was found to be ca. 5 nm (figure3), which is slightly lower than what is observed under TEM (ca. 8 nm, figure S6). This diameter difference can be
attributed to the sample preparation technique, as the staining and drying processes used for TEM imaging influence the morphology of peptide nanofibers. In addition, the effective diameter of the nanofibers could be increased through the affinity of peptide molecules (especially the positively charged K3PA) to the mica surface, and the AFM tip can further change fiber diameters by compressing these struc-tures during scanning. As the latter condition is more repre-sentative of the native structure of the nanofibers, conical nanofibers with diameters of 4.5 nm (figure4(a)) were used as the starting structure in EM simulations to maintain a dia-meter consistent with AFM observations.
Figure 2.(a) Representative deflection AFM images showing the nucleation and growth of PA nanofibers, measured under time-lapse
imaging over a 10 min period(images are frames of supporting movie 1). (b) Fiber elongation rate, as derived from each frame of the time-lapse image series. The error bars represent the average of ten distinguishablefibers, tracked on each frame from (a). (c) PA nanofibers nucleated and grown in situ.(d) Representation of the formation mechanism of a net-like fiber network, zoomed in from the dashed square region of(c). The periodic structure observed in some nanofibers is an imaging artifact; CD and TEM analyses confirm that the peptide nanofibers do not exhibit helical structures. Black arrows show the cessation of fiber elongation at points where the advancing front of one fiber meets the body of another.
3.3. EM simulations of nanofibers
As shown infigure4(b), the potential energy of the nanofiber tends to increase with increasing ellipticity. Beyond the value 0.25, the potential energy of the system was found to increase dramatically and eventually reach positive values, indicating nanofiber disassembly. The initial structures were prepared with ellipticity values up to 0.50 but results above 0.25 were not reported as the system disintegrates completely above this threshold, with positive potential energy values and the absence of any stable fiber morphology. Consequently, the stress applied by the AFM tip appears to locally disrupt nanofiber morphology during imaging, with lower forces being tolerable by the fiber and higher forces resulting in permanent damage until the applied force is removed. Dis-ruptions created by the passage of the tip can later act as nucleation points for nanofiber growth, as damaged nanofiber ends were found in experimental studies to serve as growth zones at lower applied forces.
3.4. Disruption of peptide nanofibers under loading force
A DC-stabilized double-pass scanning method was used for contact mode imaging. Briefly, a custom-designed auxiliary electronic/software system was used to record a baseline deflection by lifting the cantilever away from the surface and subtracting the baseline value from deflection signal during contact mode imaging, stabilizing the applied normal force of the AFM tip(as calculated by Hooke’s law) during time-lapse imaging(figure S2(a)). The deflection set point, which cor-responds to the applied normal force exerted by the AFM tip, can be controlled precisely through this DC-stabilized system (figure S2(b)), allowing the investigation of fiber disruption under varying pressure. Fiber deformation could be directly induced by gradually increasing the perpendicular tip-mediated force applied to thefibers.
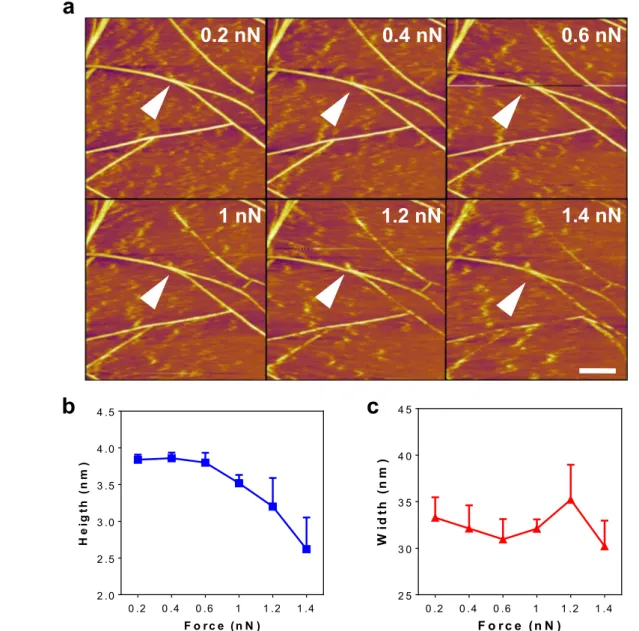
Deformation was particularly evident at forces above 1 nN, which significantly lowered the average diameter of individual peptide fibers (figure 5(a), supporting movie 3). Changes in the height and width profiles of a single nanofiber, shown with white arrow in figure 5(a), in response to increasing deflection set point are shown in figures5(b), (c).
Nanofiber breakage under tip-mediated forces was also investigated through the analysis of force–displacement data. Under an applied force of 2 nN, mica surfaces were found to exhibit linear force–displacement curves, while the disruption in peptide nanofiber integrity could be observed through a small jump in displacement during tip approach, during which thefiber is presumably damaged or pushed out from under the tip surface (figure S4(e)) shows the force–displacement analysis for a single nanofiber. Comparisons of force– displacement curves of multiple nanofibers, as well as the adhesion map associated with figure S4(b) can be seen in figures S4(c), (f). Displacement derivative analysis calculated from figure S4(e) suggests that fiber breakage occurs at around 0.7 nN(figure S4(g)), which is slightly lower than our experimental observations(1 nN).
Instead of disrupting their structural integrity, it is also possible that the force applied by the AFM tip mediates the lateral displacement of individual nanofibers. However, visi-ble gaps are created in previously intactfibers following AFM scanning, suggesting that the tip is capable of damagingfiber integrity rather than (or in addition to) merely pushing the fibers aside. In addition, the fibers can adhere well to the mica surface(partly due to their charge, as previously mentioned), and no large movements that could be attributed to fiber displacement can be observed under AFM imaging. Never-theless,fiber displacement should be considered as a potential response to AFM-mediated forces, and tip-induced lateral forces may have prevented damaged fiber ends from recon-necting with one another, facilitating their development through two parallel lines.
Young’s modulus values of individual peptide nanofibers were also measured to determine the mechanical stability of the self-assembled networks. A total of 130 force curves were manually chosen from three force maps and the approach curves were fitted with JKR contact mechanics model. The nanofibers were easily distinguishable due to their clear contrast on the adhesion map, as they had lower adhesion forces when compared to mica substrate. Therefore, the adhesion map was used to select only the regions covered by peptide nanofibers, and the underlying mica surface was excluded from mechanical analysis. A representative single force curvefit is shown in figure S4(a), and the mean Young’s
Figure 3.Hough transform analysis forfiber thickness. (a) General appearance of a mature PA nanofiber network in the absence of tip-mediated disruptions. Scale bar: 1μm. (b) ρ–θ graph of the same image following Hough transformation. (c) Histogram of nanofiber thickness as derived from the transformed data, showing that the averagefiber thickness is ca. 5 nm.
modulus of the peptide nanofibers was found to be ca. 33 MPa (inset, figure S4(a)). However, the elasticity histo-gram associated with the nanofibers exhibited a broad dis-tribution, which may suggest that more developed (mature) fibers exhibit higher Young’s moduli than single, non-bun-dled strands. The distribution of adhesion forces was also calculated from 1024 data points infigure S4(c) by selecting the nanofiber regions corresponding to darker pixels (i.e. points of lower adhesion), and the mean adhesion force value was found to be ca. 0.4 nN for peptide nanofibers on mica (figure S4(d)).
3.5. Recovery mechanism of the nanofibers
Following the tip-mediated disruption offiber integrity, lower tip forces were observed to allow the nanofiber networks to re-extend from fractured ends. An applied force of 2 nN was used to create large defects in thefiber structure, which could be readily observed under AFM imaging(figure6(a)). When this force was decreased to 1.2 nN, partial healing of the nanofiber matrix was facilitated. However, fiber reconnec-tions were not yet established during early stages of recovery, possibly due to the fact that 1.2 nN is still strong enough to
Figure 4.Modeling nanofiber deformation under tip-mediated forces. (a) Layer and nanofiber formation schematics used for theoretical
studies. Diameter and length of the nanofiber is around 5 nm and 12 nm, respectively. The length of an individual PA molecule is approximately 3.8 nm.(b) Nanofiber deformation and the corresponding disruption in fiber integrity at higher tip forces, as modeled by increasing ellipticity values. Potential energy values increase greatly after a ellipticity of 0.25 and are not shown here.
disrupt fiber integrity (supporting movie 3). Extended ima-ging at lower (0.2 nN) forces revealed that fragmented nanofibers frequently failed to reconnect, and that fragment ends instead served as growth zones for further extension, developing in parallel with one another to form a bundle (figures6(a), (b)). The movement of the sample during ima-ging may be responsible for this effect, as slight disruptions in fiber locations (or lateral pushing by the AFM tip) may have prevented the growing nanofiber ends from rejoining. How-ever, no differences were present between the diameters of individual nanofibers before and after the recovery process, suggesting that any losses in material integrity following disruption and recovery are attributable to the splitting of existingfibers rather than the alteration of fiber morphology itself.
While AFM imaging was previously used to study the self-healing process in amyloid-like peptide structures on mica [15, 19], the recovery of PA networks has not been
previously investigated by AFM. Our results demonstrate that the PA nanofibers exhibit a recovery mechanism similar to that observed in amyloid-like fibrils. Moreover, the devel-opment of mature PA nanofibers from smaller aggregates (supporting movie 1) is visually very similar to the nucleation and growth of amyloid fibrils, as shown by Watanabe-Nakayama et al using high-speed AFM imaging of amyloid β1–42fibrils [17]. Electrostatic interactions also play important roles in PA nanofiber formation, and lysine residues present in the structure of K3PA might have increased the affinity of the PAs to the negatively charged mica surface, as our group previously reported that oligonucleotide-bearing K-PA molecules aggregated extensively on mica and formed cylindrical nanofibers [57]. Similarly, Karsai et al suggested that lysine residues were responsible for directing the oriented growth offibrils in amyloid β25–35, due to the interaction of the Lys28 residue with K+ ion binding sites present on the mica substrate[48].
Figure 5.(a) Fiber deformation in response to gradually increasing normal forces of the tip. (b), (c) Height and width profile of a single
nanofiber (shown with white arrow) undergoing tip-mediated disruption, calculated using five regions across the length of the fiber. Scale bar: 200 nm.
4. Conclusions
Here we demonstrated a real-time observation of PA nano fi-ber formation, disruption and recovery by using AFM. The PA nanofibers were found to experience tip-induced disrup-tion at forces greater than 0.7–1 nN, with greater forces resulting in more extensive damage. It is interesting to note that Karsai et al have previously demonstrated the incision of a chimeric mucin 1-Q11 peptide through shear forces medi-ated by contact mode imaging, while we have observed that by changing the compressive force to above 1 nN, the AFM tip is able to locally disrupt peptide fibers in an analogous fashion[16]. Following the reduction of tip forces below this threshold, nanofibers could recover under time scales com-parable to their initial formation; however, nanofiber ends frequently failed to reconnect and instead extended into two distinct nanofibers during the recovery process. While this ‘incomplete’ pattern of recovery may impair the mechanical stability of the peptide scaffold following repeated stress-repair cycles, defects created in this manner may also favor the biodegradation of the material through infiltrating cells or allow the slow release of a drug cargo in biological applications.
EM results broadly agree with our experimental obser-vations and suggest thatfiber deformation (as induced e.g. by AFM tip forces) is sufficient to disrupt the structural integrity of the peptide nanofiber, causing fiber disassembly over a threshold value corresponding to an ellipticity of ca. 0.25. Overall, we observe that, during contact imaging of the nanofibers, the force set point must be kept below 0.7 nN for our model system to ensure minimal disruption, and that similar threshold values are likely to apply for other nanofiber
systems. In addition, we suggest that drift stabilized AFM can be used as an effective tool for the study of self-assembled nanofiber formation and their self-recovery at the nanoscale.
Acknowledgments
We thank Z Erdogan for her assistance in LC-MS, and S Hamsici for the fluorescence spectroscopy measurements of peptide nanostructures. ABT acknowledges the Science Academy Distinguished Young Scientist Award Program (BAGEP) support. The numerical calculations reported in this paper were fully/partially performed at TUBITAK ULAK-BIM, High Performance and Grid Computing Center (TRUBA resources).
ORCID iDs
Ahmet E Topal https://orcid.org/0000-0001-9951-0171 Ayse B Tekinay https://orcid.org/0000-0002-4453-814X Mustafa O Guler https://orcid.org/0000-0003-1168-202X
References
[1] Stephanopoulos N, Ortony J H and Stupp S I 2013 Self-assembly for the synthesis of functional biomaterials Acta Mater.61 912–30
[2] Stendahl J C, Rao M S, Guler M O and Stupp S I 2006 Intermolecular forces in the self-assembly of peptide amphiphile nanofibers Adv. Funct. Mater.16 499–508 Figure 6.(a) Deformation and healing of PA nanofibers under varying forces. (b) The self-healing process could be observed within ∼40 min
[3] Dehsorkhi A, Castelletto V and Hamley I W 2014 Self-assembling amphiphilic peptides J. Pept. Sci.20 453–67 [4] Mendes A C, Baran E T, Reis R L and Azevedo H S 2013
Self-assembly in nature: using the principles of nature to create complex nanobiomaterials WIREs Nanomed.
Nanobiotechnol.5 582–612
[5] Whitesides G M and Grzybowski B 2002 Self-assembly at all scales Science295 2418–21
[6] Cui H, Webber M J and Stupp S I 2010 Self-assembly of peptide amphiphiles: from molecules to nanostructures to biomaterials Biopolymers94 1–18
[7] Hartgerink J D, Beniash E and Stupp S I 2001 Self-assembly and mineralization of peptide-amphiphile nanofibers Science
294 1684–8
[8] Yokoi H, Kinoshita T and Zhang S 2005 Dynamic reassembly of peptide RADA16 nanofiber scaffold Proc. Natl Acad. Sci. USA102 8414–9
[9] Löwik D W P M, Leunissen E H P, van den Heuvel M, Hansen M B and van Hest J C M 2010 Stimulus responsive peptide based materials Chem. Soc. Rev.39 3394
[10] Hauser C A E and Zhang S 2010 Designer self-assembling peptide nanofiber biological materials Chem. Soc. Rev.39
2780–90
[11] Liang Y, Lynn D G and Berland K M 2010 Direct observation of nucleation and growth in amyloid self-assembly J. Am. Chem. Soc.132 6306–8
[12] Chang J, Peng X-F, Hijji K, Cappello J, Ghandehari H, Solares S D and Seog J 2011 Nanomechanical stimulus accelerates and directs the self-assembly of silk-elastin-like nanofibers J. Am. Chem. Soc.133 1745–7
[13] Varongchayakul N, Johnson S, Quabili T, Cappello J, Ghandehari H, Solares S D J, Hwang W and Seog J 2013 Direct observation of amyloid nucleation under
nanomechanical stretching ACS Nano7 7734–43 [14] Johnson S, Ko Y K, Varongchayakul N, Lee S, Cappello J,
Ghandehari H, Lee S B, Solares S D and Seog J 2012 Directed patterning of the self-assembled silk-elastin-like nanofibers using a nanomechanical stimulus Chem. Commun.48 10654
[15] Zhang F-C, Zhang F, Su H-N, Li H, Zhang Y and Hu J 2010 Mechanical manipulation assisted self-assembly to achieve defect repair and guided epitaxial growth of individual peptide nanofilaments ACS Nano4 5791–6
[16] Karsai A, Slack T J, Malekan H, Khoury F, Lin W F, Tran V, Cox D, Toney M, Chen X and Liu G Y 2016 Local mechanical perturbation provides an effective means to regulate the growth and assembly of functional peptide fibrils Small12 6407–15
[17] Watanabe-Nakayama T, Ono K, Itami M, Takahashi R, Teplow D B and Yamada M 2016 High-speed atomic force microscopy reveals structural dynamics of amyloidβ1-42 aggregates Proc. Natl Acad. Sci. USA113 5835–40 [18] Roeters S J, Iyer A, Pletikapić G, Kogan V,
Subramaniam V and Woutersen S 2017 Evidence for intramolecular antiparallel beta-sheet structure in alpha-synucleinfibrils from a combination of two-dimensional infrared spectroscopy and atomic force microscopy Sci. Rep.
7 41051
[19] Dai B, Kang S -g., Huynh T, Lei H, Castelli M, Hu J, Zhang Y and Zhou R 2013 Salts drive controllable multilayered upright assembly of amyloid-like peptides at mica/water interface Proc. Natl Acad. Sci.110 8543–8
[20] Inostroza-Brito K E et al 2015 Co-assembly, spatiotemporal control and morphogenesis of a hybrid protein–peptide system Nat. Chem.7 897–904
[21] Clarke D E, Pashuck E T, Bertazzo S, Weaver J V M and Stevens M M 2017 Self-healing, self-assembledβ-sheet peptide–poly(γ-glutamic acid) hybrid hydrogels J. Am. Chem. Soc.139 7250–5
[22] Deng C C, Brooks W L A, Abboud K A and Sumerlin B S 2015 Boronic acid-based hydrogels undergo self-healing at neutral and acidic pH ACS Macro Lett.4 220–4
[23] Webber M J, Appel E A, Meijer E W and Langer R 2015 Supramolecular biomaterials Nat. Mater.15 13–26 [24] Strandman S and Zhu X X 2016 Self-healing supramolecular
hydrogels based on reversible physical interactions Gels
2 16
[25] Hartgerink J D, Beniash E and Stupp S I 2002 Peptide-amphiphile nanofibers: a versatile scaffold for the preparation of self-assembling materials Proc. Natl Acad. Sci.99 5133–8
[26] Sano K I, Kawamura R, Tominaga T, Oda N, Ijiro K and Osada Y 2011 Self-repairingfilamentous actin hydrogel with hierarchical structure Biomacromolecules12 4173–7 [27] Paramonov S E, Jun H W and Hartgerink J D 2006
Self-assembly of peptide-amphiphile nanofibers: the roles of hydrogen bonding and amphiphilic packing J. Am. Chem. Soc.128 7291–8
[28] Behanna H A, Donners J J J M, Gordon A C and Stupp S I 2005 Coassembly of amphiphiles with opposite peptide polarities into nanofibers J. Am. Chem. Soc.127 1193–200 [29] Hamley I W, Dehsorkhi A and Castelletto V 2013 Coassembly
in binary mixtures of peptide amphiphiles containing oppositely charged residues Langmuir29 5050–9
[30] Gao C, Li H, Li Y, Kewalramani S, Palmer L C, Dravid V P, Stupp S I, Olvera de la Cruz M and Bedzyk M J 2017 Electrostatic control of polymorphism in charged amphiphile assemblies J. Phys. Chem. B121 1623–8
[31] Korevaar P A, Newcomb C J, Meijer E W and Stupp S I 2014 Pathway selection in peptide amphiphile assembly J. Am. Chem. Soc.136 8540–3
[32] Liao H-S, Lin J, Liu Y, Huang P, Jin A and Chen X 2016 Self-assembly mechanisms of nanofibers from peptide
amphiphiles in solution and on substrate surfaces Nanoscale
8 14814–20
[33] Jiang H, Guler M O and Stupp S I 2007 The internal structure of self-assembled peptide amphiphiles nanofibers Soft Matter3 454
[34] Pashuck E T, Cui H and Stupp S I 2010 Tuning supramolecular rigidity of peptidefibers through molecular structure J. Am. Chem. Soc.132 6041–6
[35] Tantakitti F et al 2016 Energy landscapes and functions of supramolecular systems Nat. Mater.15 469–76 [36] Zhang S, Greenfield M A, Mata A, Palmer L C, Bitton R,
Mantei J R, Aparicio C, Olvera M, Cruz D and Stupp S I 2011 NIH public access Nat. Mater.9 594–601
[37] Miravet J F, Escuder B, Segarra-Maset M D, Marta T-S, Ian H W and Dehsorkhi Ashkan C V 2013 Soft matter nanotapefi brils to micelles Soft Matter9 3558–64 [38] Lee O-S, Stupp S I and Schatz G C 2011 Atomistic molecular
dynamics simulations of peptide amphiphile self-assembly into cylindrical nanofibers J. Am. Chem. Soc.133 3677–83
[39] Lee O-S, Cho V and Schatz G C 2012 Modeling the self-assembly of peptide amphiphiles intofibers using coarse-grained molecular dynamics Nano Lett.12 4907–13 [40] Tekin E D 2015 Molecular dynamics simulations of
self-assembled peptide amphiphile based cylindrical nanofibers RSC Adv.5 66582–90
[41] Ozkan A D, Tekinay A B, Guler M O and Tekin E D 2016 Effects of temperature, pH and counterions on the stability of peptide amphiphile nanofiber structures RSC Adv.6 104201–14
[42] Cote Y, Fu I W, Dobson E T, Goldberger J E, Nguyen H D and Shen J K 2014 Mechanism of the pH-controlled self-assembly of nanofibers from peptide amphiphiles J. Phys. Chem. C118 16272–8
[43] Cinar G, Ozdemir A, Hamsici S, Gunay G, Dana A, Tekinay A B and Guler M O 2017 Local delivery of
doxorubicin through supramolecular peptide amphiphile nanofiber gels Biomater. Sci.5 67–76
[44] Zengin A, Cinar G and Guler M O 2017 Controlled enzymatic stability and release characteristics of supramolecular chiral peptide amphiphile nanofiber gels Curr. Appl. Phys.17
785–92
[45] Topal A E, Tansık G, Ozkan A D, Guler M O, Dana A and Tekinay A B 2017 Nanomechanical characterization of osteogenic differentiation of mesenchymal stem cells on bioactive peptide nanofiber hydrogels Adv. Mater. Interfaces
4 1700090
[46] Zhang F, Zhang P, Hou J, Yun X, Li W, Du Q and Chen Y 2015 Large scale anomalous patterns of muscovite mica discovered by atomic force microscopy ACS Appl. Mater. Interfaces7 8699–705
[47] So C R, Liu J, Fears K P, Leary D H, Golden J P and Wahl K J 2015 Self-assembly of protein nanofibrils orchestrates calcite step movement through selective nonchiral interactions ACS Nano9 5782–91
[48] Karsai Á, Grama L, Murvai Ü, Soós K, Penke B and Kellermayer M S Z 2007 Potassium-dependent oriented growth of amyloidβ25–35 fibrils on mica Nanotechnology
18 345102
[49] Cinar G, Ozdemir A, Hamsici S, Gunay G, Dana A, Tekinay A B and Guler M O 2016 Local delivery of doxorubicin through supramolecular peptide amphiphile nanofiber gels Biomater. Sci.5 67–76
[50] Newcomb C J, Sur S, Ortony J H, Lee O-S, Matson J B, Boekhoven J, Yu J M, Schatz G C and Stupp S I 2014 Cell death versus cell survival instructed by supramolecular cohesion of nanostructures Nat. Commun.5 1–10 [51] Abraham M J, Murtola T, Schulz R, Páll S, Smith J C,
Hess B and Lindahl E 2015 GROMACS: high performance molecular simulations through multi-level parallelism from laptops to supercomputers SoftwareX1–2 19–25
[52] Humphrey W, Dalke A and Schulten K 1996 Visual molecular dynamics J. Mol. Graph.14 33–8
[53] Smith P E and van Gunsteren W F 1993 The viscosity of SPC and SPC/E water at 277 and 300 K Chem. Phys. Lett.215 315–8
[54] Goktas M, Cinar G, Orujalipoor I, Ide S, Tekinay A B and Guler M O 2015 Self-assembled peptide amphiphile nanofibers and PEG composite hydrogels as tunable ECM mimetic microenvironment Biomacromolecules16 1247–58 [55] Manning M C, Illangasekare M and Woody R W 1988 Circular dichroism studies of distortedα-helices, twisted β-sheets, andβ-turns Biophys. Chem.31 77–86
[56] Bowerman C J, Liyanage W, Federation A J and Nilsson B L 2011 Tuningβ-sheet peptide self-assembly and
hydrogelation behavior by modification of sequence hydrophobicity and aromaticity Biomacromolecules12
2735–45
[57] Mammadov R et al 2015 Virus-like nanostructures for tuning immune response Sci. Rep.5 16728