Concept of T-Wave Morphology Dispersion
B Acar, G Yi, M Malik
Bilkent University, EE. Department, Ankara, Turkey
"St. George's Hospital Medical School, London, UK
Abstract
The detection of Ventricular repolarisation abnormalities is widely being done using the QT interval measurements. However, there are both technical and theoretical problems with QT measurements. We propose two robust methods for the quantification of the ventricular repolarisation abnormalities: i ) The quantification of the inter-lead morphology differences of
the T wave (T Wave Morphology Dispersion
-
TMD) ii) The analysis of the T wave wavefront direction with respect to the QRS complex (Total Cosine R-To-T - TCRT).Sensitivity and specificity of 82% (84%) in supine position and 77% (79%) in standing position were achieved for TMD (TCRT). Both parameters were more reproducible than conventional QT interval based parameters.
1.
Introduction
The importance of ventricular repolarisation abnormalities in the genesis of ventricular arrhythmias has long been recognised. The analysis of the inter-lead variations of the QT interval, the so called QT Dispersion (QTd), became a popular method for the assessment of ventricular repolarisation. While there are several studies that documented the clinical relevance of QTd, most of them are inconclusive [ 11. The poor reproducibility of the QTd, which is mainly due to the problems in the localisation of the T wave end point as well as the presence of U waves and the notched T waves, is the major drawback of QTd. [ 1-41, Furthermore, the variation in the QT interval is only a part of the whole picture.
Such concerns led to the attempts to quantify the variation of the ventricular repolarisation patterns. Malfatto et al. and Priori et al. used the principal component analysis (PCA) to quantify the complexity of repolarisation patterns [5-61. PCA provides a gross measure of the complexity. Kors et al. studied the
0276-6547/99 $10.00 0 1999 IEEE 57
orientation of the T wave axis [7]. The significance of the relative orientations of the QRS and the T wave vectors was reviewed by Hurst [8].
We defined two parameters to assess the morphological qualities of ventricular repolarisation patterns and studied their performance in separating normal subjects and the HCM patients. TMD is a measure of the inter-lead T wave morphology variation and TCRT is a measure of the relative wavefront directions of the QRS complex and the T wave.
2. Themethod
All of the measurements are done i n a 3D space,
s3,
,which is constructed by Singular Value Decomposition (SVD) of ECG and is known to represent 98% of the ECG energy and enhance the ECG signals [9]. Let
ME
%8xN be the data matrix, whose rows correspond to standard ECG leads I, 11, V I , V2, V3, V4, V5, V6. Then,M
=
U W T
The projection of
M
onto S3,is given ass
=
uTM
. Each column ofs
, S i , represents the ECG vector ins,,
and its rows,d j
, are time orthogonal signals.Approximate QRS complex and T wave detections are done using the norm of S i ,
E,,,
and by tracking S i .Each ECG record is assured to contain only a single beat. The peak of ventricular depolarisation is defined as the time interval where
E,,
is higher than the 70% of itstRS f R E tTS t l ' P fTE
Figure 1 Approximate QRS complex and T wave detection
maximum value. This interval is marked with
t ,
andt ,
in Figure 1. The peak of ventricular repolarisation,t , ,
is defined as the time instant whereE,,
is maximum in an interval(r)
starting 50ms. aftert,,
and ending at the end of the record. The ventricular repolarisation starting point is defined to be 113 of(tTP
- t R E )
fromt ,
(See Figure 1). The rectangular area ins,,
(the significant subspace ofs3D)
which contains Si,2D during the intervalr,
is divided into 100equal size cells. Each cell is assigned an index which is equal to the number of consecutive data points in that cell (if a cell is visited twice then it has two distinct indices). Zero indices are discarded. The cell with the lowest index above a threshold is selected. The threshold is
threshold =
rnean(Di)+3xSTD(Di)
Di
:
i" nonzero index
The time instant at whichSi,,, enters this cell is marked as the global repolarization end point,
t,.
These detections serve our purpose as no exact time domain measurement is necessary.TCRT is defined as:
TCRT
=
rneun(cos(L(s,
, s r p ) ) )
t,,
Ii
It,,
It is a measure of the relative directions of the ECG vector during ventricular depolarisation and repolarisation.
The standard ECG channels are reconstructed from
S,
to obtain morphologically filtered ECG signals:M
=
u,s.
The T wave section ofM ,
which corresponds to the time interval[t, , t T E ] ,
is re- decomposed by SVD:MT
= UTCTV,T
Thus the influence of the QRS complex on the decomposition is eliminated. Note that has two columns, unlike
U,
because the most significant 2D sub- space captures most of the energy of T wave.Let
WT
=
U I , T X i , T,
WE
S2"'.
w
defines therelation between the standard ECG leads and the 2D,
normalised sub-space,
VI,.
Each one of its columns, W,
is the representation of the j" ECG lead in this 2D space.TMD
is definedas:
TMD =
rneun(L(w
i ,w
))
i , j E
{I,II,V2,V3,V4,V5,V6),i
+
j
8,
=
L ( W i,
W)
represents the T wave morphology difference between the i" and j" ECG leads. If they were identical then8
would be zero. ThusTMD
quantifies the inter-lead T wave morphology variation. LeadV1
is excluded because its T wave has usually a different morphology without any physiological background.A detailed discussion is available in [IO].
3. Data
10 supine resting and 10 standing position ECGs were recorded in each of 76 normal healthy subjects (37 male, aged 38+10 years, range 13-59 years) and 63 patients with hyperthropic cardiomyopathy (HCM) (44 male, aged 39+14 years, range 12-71 years). The serial ECGs were recorded consecutively under identical conditions within 3 minutes. Each recording lasted for 10 seconds. We used the median beats calculated from each 10 second recording.
The conventional QT interval based parameters were
provided by a commercial system (QT Guard, Marquette Medical Systems). Q R S L o o p
:
!
4.
Results
TMD TCRTTable 1 summarises the results. Dichotomy analysis showed that sensitivity and specificity of 82% (84%) in supine position and 77% (79%) in standing position were achievable for TMD (TCRT). The reproducibility of the new parameters is measured using the ratio of individual range (over 10 supine recordings per patient) to the total range (over all subjects and all supine recordings), which is a variability measure. The same analysis is conducted for QTd and QT interval (QTint) also. Table 2 summarises these results.
0.07k0.06 0.05f0.05 0.08k0.04 0.06kO. 12
5.
Discussion
The new ventricular repolarisation parameters assess different qualities of the T wave than the conventional time domain based parameters (QTd, etc.) do. This is verified by the low correlation between the parameters.
All cross correlation coefficients are below 0.08. TMD, which quantifies the T wave morphology deviation between different leads increases in HCM patients. This indicates an increased irregularity of the T wave morphology in HCM patients. In Figure 2, the T
Table 1 Mean and standard deviation of TMD and TCRT in normal subjects and HCM patients
I
1
NormalI
HCM I I1
1
1S:;;
1
10.72°k4.7801
41.10"+26.85"1
Standing 10.45°k6.920 39.39Ok26.44" 0.52M.27 -0.35k0.52 Standing 0.23kO.4 1 -0.49f0.44Table 2 Variability of different parameters within 10 consecutive supine recordings
(Individual Range / Total Range)
I
NormalI
HCM I I]
QTdI
0.16kO.13I
0.20f0.18I
I
QT int1
0.10k0.09I
0.09f0.071
Normal O t h e r V1.T HCM/
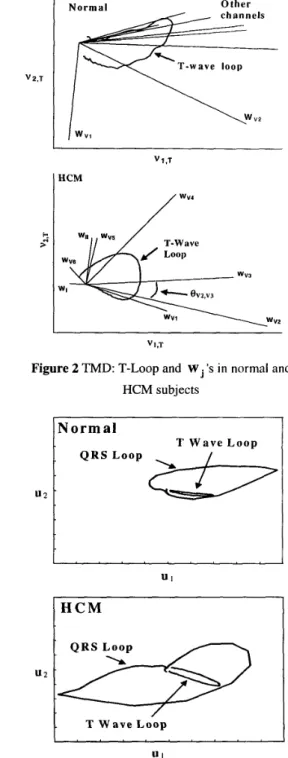
wv4 V1,TFigure 2 TMD: T-Loop and W 's in normal and HCM subjects
N o r m a l
T W a y e L o o p
Q R S L o o p
I"""
Figure 3 TCRT: The T-loop and the QRS-loop in normal and HCM subjects
wave is represented by the loop that the tip of S traverses during ventricular repolarisation. It is observed that
w
'sare grouped in the normal subject, except W v , , indicating that the T wave morphologies in different leads are similar, whereas they are far away from each other (dispersed) in the HCM patient.
TCRT, which is a measure of the relative orientation of the ECG vector during ventricular depolarisation and repolarisation, is negative in HCM patients and positive in normal subjects. This indicates that they are aligned in normal subjects and deviate in HCM patients. This can be understood as the alignment and deviation of the T wave loop and the QRS loop, as Figure 3 demonstrates. These loops represent the paths that the ECG vector traverses.
Although the data used in this study was almost noise- free, this method can also be applied to noisy ECG signals. Noise would not affect the new parameters much, as it does conventional time-domain parameters like QTd. This is because both of the new parameters are defined in a minimum dimensional space constructed by SVD which provides a built-in noise immunity and because none of the new parameters require accurate time-domain measurements.
6.
Conclusion
The new ventricular repolarisation descriptors, TMD and TCRT, exploit the idea of assessing the T wave morphology and the 'ECG vector orientation. Thus they are grossly different from the conventional time-domain based descriptors, like QTd. The new descriptors
assess different qualities of the ventricular repolarisation than the conventional descriptors.
0 are capable of separating normal subjects and
HCM patients.
do not require accurate time-domain measurements, thus they avoid the inaccuracies associated with time interval measurements. have a built-in immunity to noise.
.
References
[I] Statters D.J, Malik M, Ward DE and Camm AJ. QT dispersion : Problems of methodology and clinical significance. J. Cardiovasc. Electrophysiol. 1994;5:672-685 [2] Hnatkova K, Malik M, Kautzner J, Gang Y and Camm AJ.
Adjustment of QT dispersion assessed from 12-lead electrocardiograms for different numbers of analyzed electrocardiographic lead : Comparison of stability of different methods. Br. Heart J. 1994;72:390-396
31 McLaughlin NB, Campbell RWF and Murray A. Comparison of automatic QT measurement techniques in the normal 12-lead electrocardiogram. Br. Heart J .
41 Murray A, McLaughlin NB, Bourke JP, Doig JC, Furniss
SS and Campbell RWF. Errors in manual measurement of QT intervals. Br. Heart J. 1994;71:386-390
51 Malfatto G, Beria G, Sala S, Bonazzi 0 and Schwartz PJ. Quantitative analysis of T wave abnormalities and their prognostic implications in the idiopathic long QT syndrome. J. Am. Coll. Cardiol. I994;23:296-301 61 Priori SG, Mortara DW, Napolitano C, Diehl L, Paganini
V, Cantu F, Cantu G and Schwartz PJ. Evaluation of the spatial aspects of T wave complexity in the long-QT syndrome. Circulation. 1997;96:3006-3012
[7] Kors JA, De Bruyne MC, Hoes AW, Van Herpen G, Hofman A, Van Bemmel JH, Grobbee DE. T axis as an indicator of risk of cardiac events in elderly people. The Lancet. 1998;352:601-605
[8] Hurst JW. Abnormalities of the S-T Segment - 1. Clinical Cardiology 1997;20:511-520
[9] Xue Q and Reddy S. New algorithms for QT dispersion
analysis. In: Computers in Cardiology 1996. Indianapolis, [lo] Acar B, Gang Y, Hnatkova K, Malik M. Spatial, Temporal and Wavefront Characteristics of 12-Lead T Wave Morphology. Med. & Biol. Eng & Comput. 1999;37: 1-1 1
1995;74:84-89
USA: IEEE, 1996:293-296
Address for correspondence: Burak Acar
Bilkent University
Electrical & Electronics Eng. Dept. 06533 Ankara, Turkey
email: [email protected]