T.C.
ISTANBUL AYDIN UNIVERSITY INSTITUTE OF GRADUATE STUDIES
AN APPLICATION OF REPEAT SALES METHODOLOGY ON TURKISH REAL ESTATE
THESIS
Bouchra Labrahmi
Department of Business Administration Business Administration Program Thesis Instructor: Dr.Öğr. Üyesi Uğur Şener
ii
T.C.
ISTANBUL AYDIN UNIVERSITY INSTITUTE OF SOCIAL SCIENCES
AN APPLICATION OF REPEAT SALES METHODOLOGY ON TURKISH REAL ESTATE
MSc THESIS
Bouchra Labrahmi Y1412.130117
Department of Business Administration Business Administration Program Thesis Instructor: Assist Prof. UĞUR ŞENER
iii
ONAY FORMU
T.C.
ISTANBUL AYDIN UNIVERSiTESi
LiSANSÜSTÜ EGiTIM ENSTITUSU MÜDÜRLÜGÜ
07/05/2020 YÜKSEK LISANS TEZ SINAV TUTANAĞI
Işletme Ingilizce Anabilim Dali, Işletme Yonetimi Ingilizce Tezli Yuksek Lisans Programi Y1612.130117 numarali oğrencisi Bouchra LABRAHMI’nin
Istanbul Aydin Universitesi Lisansüstü Egitim-Ogretim ve Sinav Yonetmeligi }nin 9. (1) maddesine göre hazirlayarak Enstitiimuze teslim ettigi66AN APPLICATION OF
REPEAT SALES METHODOLOGY INTURKISH REAL ESTATE
MARKET59 adli tezi
? Yonetim Kurulumuzun 31.01.2020 tarihli ve 2020/02 sayili
toplantismda sefilen ve B402 nolu salonda küresel salgm COVID-19 sebebiyle Skype araciligi ile toplanan biz jüri üyeleri huzurunda, ilgili yonetmelik geregince 45 dakika süre ilea day tarafından savunulmuş ve sonuçta adayın tezi hakkında oybirligi* ile başarlı** kararı verilmiştir.
Dr. Ogr. Uyesi Ugur §ENER
Iş bu tutanak, tez dam§mani tarafmdan jtiri uyelerinin tez degerlendirme sonuflan
dikkate almarak jtiri tiyeleri adma onaylanmi§tir.
ONAY
Prof. Dr. Ragip Kutay KARACA Enstitii Mudurii
1 2
1 Oybirligi/Oy^oklugu hali yazi ile yazilacaktir.
iv
DECLARATION
I hereby declare that all information in this thesis document has been obtained and presented in accordance with academic rules and ethical conduct. I also declare that, as required by these rules and conduct, I have fully cited and referenced all material and results, which are not original to this thesis.
i
ACKNOWLEDGEMENT
The completion of this study would not have been possible without the expertise of Prof. Dr Uğur Şener my thesis Advisor for his immense support towards the success of this thesis.
My sincere gratitude also goes to my late father (Abdeslame Labrahmi) who will be proud of me, my mother (Latifa Baino), my sister (Raja Labrahmi), (Arda Paçal), (Naima Baino), (Abdullah Baino), (Hayat Baino) who encouraged me a lot during the program.
My special apprecition also goes to my husband (Mr Serhat Çeşmeci), (Hulya&Adnan Çeşmeci) who served as my inspiration to pursue Master Degree
I will be ungrateful if I do not appreciate my entire family who has been with me in one way or the other. I pray that Allah bless you all richly. I also appreciate Mr. V. Elbaz for his words of encouragement to accomplish this program.
İ would like to express my special gratitude and thanks to Mr. Lawal for sharing his time and technical experience towards the success of this thesis. More so, I appreciate my siblings, friends and staff of institute of social sciences for their support directly and indirectly to the success of this thesis. May Allah bless you all.
ii TABLE OF CONTENTS Page ACKNOWLEDGEMENT ... i TABLE OF CONTENTS ... ii LIST OF TABLE ... iv ABBREVIATION ... v ABSTRACT ... vi ÖZET ... vii 1 INTRODUCTION ... 1 1.1 Study Overview ... 1 1.2 Problem Identified ... 2 1.3 Study Questions ... 3
1.4 Other Specific Objectives ... 3
1.5 Study Hypotheses ... 3
1.6 Significance of the Study ... 4
1.7 Research Scope ... 4
1.8 Description of Terms ... 5
2 STUDY REVIEW... 6
2.1 The Repeat Sales ... 6
2.2 Empirical Issue ... 8
2.2.1 Review Summary ... 11
3 THEORETICAL AND CONCEPTUAL FRAMEWORK ... 14
3.1 Post-Stratification Model ... 14
3.2 The Hedonic Price Model ... 16
3.3 Existing Price Index in Turkey ... 17
3.4 New Index: Repeat Sales Indices ... 20
iii
4 STUDY METHOD ... 24
4.1 Model ... 24
4.2 Description and Measurement of Variables ... 25
4.3 Apriori Expectation ... 25
4.4 Estimation Techniques ... 26
4.5 Source of Data ... 26
5 RESULT AND DISCUSSION OF FINDINGS ... 27
5.1 Descriptive Analysis ... 27
5.2 Unit Root Test ... 28
5.3 Regression Analysis ... 31 5.4 Post-Estimation Techniques ... 33 5.4.1 Normality Test ... 33 5.4.2 Serial Correlation ... 34 4.4.3 Heteroskedacity Test... 34 5.5 Correlation Analysis ... 35
6 SUM-UP, DEDUCTION AND SUGGESTIONS ... 36
6.1 Sum-Up ... 36 6.2 Deduction ... 37 6.3 Suggestions ... 37 References ... 38 Appendices ... 40
iv
LIST OF TABLE
Table 1: Review of the Previous Article ... 11
Table 2: House Sales Number ... 18
Table 3: Variables are listed below ... 25
Table 4: Descriptive Result ... 27
Table 5: Unit Root Outcome @ Level ... 28
Table 6: Unit Root Outcome @ First Difference ... 29
Table 7: Unit Root Result @ second Difference ... 29
Table 8: Direction of Integration... 30
Table 9: Regression Result ... 31
Table 10: Serial Correlation Result ... 34
Table 11: Heteroskedacity Test Result ... 34
v
ABBREVIATION HPI - House Price Index
NHPI - New House Price Index HHPI - Hedonic House Price Index EHPI - Existing House Price Index
vi
AN APPLICATION OF REPEAT SALES METHODOLOGY ON TURKISH REAL ESTATE
ABSTRACT
The study examined the application of repeat sales methodology on real estate in Turkey. Secondary data were used in this study which span from 2010M1 to 2018M11. The monthly data were extracted and sourced from the statistical page of Turkish data. Descriptive and regression analyses were used as the estimation techniques.The findings from the analysis revealed that the independent variables have negative sign that is house price index is negative at constant with 7.886041 coefficient. This means that, at constant there is a negative but significant effect of HHPI, NHPI and EHPI on house price index in Turkey during the study period. The study concluded that that new house price index had a positive and significant effect on house price index in Turkey. It also concluded that hedonic house price index had a positive effect but it is not significant during the study period. Furthermore, it was concluded that existing house price index revealed a positive and significance effect on house price index in Turkey.
vii
TÜRKİYE GAYRİMENKUL ÜZERİNE TEKRAR SATIŞ YÖNTEMİ UYGULAMASI
ÖZET
Çalışmada, Türkiye'de gayrimenkul satış tekrar satış metodolojisinin uygulanmasını inceledi. Bu çalışmada 2010M1'den 2018M11'e kadar olan ikincil veriler kullanılmıştır. Aylık veriler çıkarılmış ve Türkiye verilerinin istatistiksel sayfasından alınmıştır. Tahmin tekniği olarak betimsel ve regresyon analizleri kullanılmıştır. Analizden elde edilen bulgular, bağımsız değişkenlerin 7.886041 katsayısı ile sabit olarak konut fiyat endeksi negatif olduğunu göstermiştir. Bu, çalışma dönemi boyunca Türkiye'de HHPI, NHPI ve EHPI'nın konut fiyat endeksi üzerinde olumsuz fakat anlamlı bir etkisinin olduğu anlamına gelir. Çalışma, yeni konut fiyat endeksinin Türkiye'de konut fiyat endeksi üzerinde olumlu ve anlamlı bir etkiye sahip olduğu sonucuna varmıştır. Ayrıca, hedonik konut fiyat endeksinin olumlu bir etkiye sahip olduğu ancak çalışma döneminde anlamlı olmadığı sonucuna varmıştır. Ayrıca, mevcut konut fiyat endeksinin Türkiye'de konut fiyat endeksi üzerinde olumlu ve anlamlı bir etkisi olduğu sonucuna varılmıştır.
1
1 INTRODUCTION
The application of repeat sales methodology in Turkey cannot be over-emphasisized. This necessitates the previous researchers to measure its impact and the connection in different countries of the world. Its output has made the subject matter to be hotly debated in the literature. This chapter discusses the introduction of the subject matter ranging from study overview, problem identified, research issues, study objectives, the hypotheses, implication, scope, and to definition of terms.
1.1 Study Overview
The real estate sector is playing an increasingly important role in most economies where Turkish economy is not left out, given the extent of its diffusion effects on other sectors and the implications of price real estate assets on inflation, monetary policy, banking supervision, and financial stability. The establishment of a property asset price monitoring system is hence of crucial importance, as a result of its potential contribution to improving the operative of the real estate marketplace, as well as to strengthen the monitoring of property prices of the sectorial situation. In addition, the accessibility of sub-annual home price data will help sharpen the monitoring and analysis frameworks for monetary policy, banking supervision, and financial stability.
Repeat sales method is one of the unique methods among house price index construction practices which focus on data that legitimately value the mutable of enthusiasm of house value upsurge. However, the major crucial method is that there are perceptions of various exchanges on a similar assets (Deng, McMillen and Sing, 2012). Literatures on real estate construction index have been built on hedonic and repeat sales methods. The key benefit of the repeat method as against hedonic
2
method is the specification error and features which does not observed in the data. (Francke & Minne, 2017).
1.2 Problem Identified
The Real estate indices are designed to measure the performance of direct investment (in equity) in real estate. The most natural way to calculate the performance of these indices would be to observe the price movements of the underlying assets in the markets and to weight their modifications according to a given weighting system. However, since real estate is not traded frequently, it is problematic to get an adequate number of deal values, or more particularly the evolution of these prices, to calculate classical indices. Transaction price is possible to work around this problem by using regular appraisals performed by real estate professionals, instead of transaction prices. These indices of expertise are particularly important for the commercial real estate market, given limited comparability of goods and reduced number of transactions in this market. However, even if the properties that make up the index are not all traded between two index calculation dates, it remains possible to determine the evolution of a transaction index.
The real estate sector is very heterogeneous in nature, which makes it difficult to have a single price approach because the price formation of different goods is influenced by intrinsic characteristics (area, number of rooms, age, etc.) and geographical location of real estate. Similarly, changes in average prices may occur due to variations in the sythesis of residences puchased at a period to another and thus result in a price evolution profile that does not replicate the actual situations of seller and buyer in the real estate marketplace. By way of illustration, the transactions may concern mainly high-end apartments during a quarter and mainly involve economic apartments in the following quarter. To limit the effect of one or more of the previously mentioned requirements and relying upon the nature and extravagance of the accessible databases, a few ways to deal with creating real estate asset price indices are adopted globally. After a discussion of the most used among these approaches, this paper presents a description of the data available at the
3
national level and their treatment before focusing on the method chosen and the reasons for its use.
1.3 Study Questions
Continuation of the issue expressed over, this examination will in general give answers to the accompanying inquiries as follows:
i. What is the impact of hedonic house pricing index on house sales in Turkey? ii. How does new house pricing index affect house sales in Turkey?
iii. What is the impact of existing house pricing index on house sales in Turkey?
1.4 Other Specific Objectives
The main focus is to explore the application of repeat sales methodology on real estate, while the precise objectives are:
1. To determine the impact of hedonic house pricing index on house sales in Turkey;
2. To ascertain the impact of new house pricing index on house sales in Turkey; 3. determine the impact of existing house pricing on house sales in Turkey.
1.5 Study Hypotheses
The hypotheses are expressed in invalid structure below:
i. There is no significant impact of hedonic house pricing index on house sales in Turkey.
ii. New house pricing index has no significant effect on house sales in Turkey iii. There is no significant impact of existing house pricing on house sales in
4
1.6 Significance of the Study
An important motivation when creating real estate price indicators is the construction of sub-indices by region or neighborhood. Differences in the evolution of these sub-indices then reflect changes in the environment, including available infrastructure. A reliable methodology for construction should be retained of real estate indicators. The repeat sales method appears appropriate. However, this study is significant because its outcome will help the government to ascertain whether the action taken by the government of Turkey to adopting housing price is yielding positive result thereby encouraging the investors of the performance to be more encouraged. The study is also significant in the sense that it serves as a feedback from its citizens to the government on its decision of housing in the real estate sector. Any problems identified would be nipped in the bud during the transition period of the system.
Investors, students or researchers and managers of public sector entities in Turkey would find this study useful in their further studies and making informed decisions respectively.
1.7 Research Scope
This study examine the application of repeat sales methodology on real estate in Turkey using secondary data that spans from 2010M1 to 20118M11. The monthly data were extracted and sourced from the statistical page of Turkish data. The study intends to carry out an up-to-date analysis which necessitates the use of 2018 data in order to produce objective conclusion and suggestions based on the study discoveries.
The length of the period allowed the investigation to examine and determine the application of repeat sales methodology on real estate. Also the period is long enough to meet the minimum observations requirement necessary for the analysis involving regression as the estimation techniques in this study.
5
1.8 Description of Terms
House Price Index: This is a device that estimates variations in single-family home
costs over an assigned marketplace.
Repeat Sales: This refers as a way of figuring changes in the business cost of a
similar bit of land over explicit timeframes.
Hedonic Price: This is a model, which distinguishes value factors, as indicated by
the reason that value is resolved both by inward qualities of the great being sold and outside variables influencing it.
6
2 STUDY REVIEW
This section discusses the past review which comprises the several concepts and empirical review relating the repeat sales methodology and real estate.
2.1 The Repeat Sales
The repeat-sales house price index appears in the United States. It is multiple indexes set to calculate housing prices. It is a monthly index starting from 1987 to this present time. The guides kept by Standard and Poor are normalized to have a value of 100 in January 2000. The weighted form is a modification of the regression proposed by Bailey. The BMN method produces estimates and standard errors for an index of housing prices by regressing (Case and Shiller, 1988). The repeat sale method deals with properties sold more than once. The information needed to estimate an equation using a repeat sale index deals with price, sales date and address of the properties. Unlike the hedonic model, less intensive data is required to evaluate the price of an estate.
With the continuous expansion of Turkish real estate market, the impact of real estate prices on social production and life is becoming more and more obvious. Accurate real estate price index is of great significance for improving the quality of government economic decision-making, reasonably guiding social expectations and public demand, and reducing the blindness of real estate development investment. The repetitive sales method solves the problem of ensuring the homogeneity of samples in the process of real estate index preparation and is an internationally popular index preparation method. The principal component analysis (PCA) index is a repeat sales index calculated from economic variables and financial variables. The construction process of the index includes four steps: determining the profit rate
7
of the house, determining the profit rate of the economic and financial variables, establishing the factors, and constructing the index.
First, to be able to construct a price indicator using the repeat sales method, we must select all properties that during the reporting period resulted in two or more transactions. The price difference of a building between its purchase and its resale determines the price increase of this property during the period. The variation of the repeat index corresponds to the symmetrical of the personal variations of value (and not at their arithmetic mean). So, for a sample of two buildings, if the price of one double and the price of the other halves, it will be deduced that, on average, have not moved. Moreover, it is the number of observations and not the importance of the corresponding transactions which will influence the quality of the measure of price growth. Indeed, each transaction is seen to assign the same weight in the construction of the index.
Traditionally, the construction of an indicator is most often capitalization weighting, that is, the marketplace price of the assets. This is the instance for most stock market indices, such as, the S & P500 in the US and the CAC40 in France. In the field of real estate, given the difficulty encountered in measuring the market value of the buildings in each sector, a weighting by the number of buildings existing ones is often retained. This is particularly the case for the Notary/INSEE index. When transaction price averages per m2 are used, two types of weighting are implicitly realized. Either the average price per m2 is calculated, which amounts to attributing the same weight at each building, that is, the sum of transaction prices per period is calculated and divided by the total number of m2, which amounts to assigning more weight to larger transactions.
The repetitive sales index reflects the evolution of house prices (regardless of size) the evolution of the average price of an m2 or the value of the stock. Bailey, Muth and Nourse (1963) the relationship between prices and index values is expressed as follows.
ln (
𝑷𝟐 𝑷𝟏) = ∑
𝜷
𝒏 𝒕=𝟏 tD
t+ ε
……….2.1 Where8 P2 = second sale value of the assets P1 = price of the good at the first sale t = coefficient to be estimated for the year t
Dt = dummy variable = -1 for the year of the first sale 1 for the year of the second sale
0 for the other years ἐ= error term
The coefficient estimates make it possible to construct the index, for example on a base 100 for the year 1:
It = 100
𝐞
𝜷𝒕− 𝜷𝟏………..2.22.2 Empirical Issue
Wang and Zorn (1997) studied the estimation of house price growth with repeat sales data in US. The hedonic method and repeat sales method were compared in the study. Their findings revealed that that the discussion on index method could be purified to contained and mainly unrecognized divergence over the anticipated goal or the proposed request. Accordingly, they showed that paying more prominent regard to essential inquiries offers huge awards to the two analysts and professionals.
Clapp and Giaccotto (1998) evaluated price indices based on the hedonic repeat-sales method using housing market. Fairfax, Virginia, housing transactions data were used and it showed that the HRM value record assessed at the mean of the epicurean variable is for all intents and purposes indistinguishable from the standard recurrent deals list, similarly as anticipated by our numerical relationship. In any case, the HRM permits estimation of various value ways for heterogeneous resources.
Blight and MacFarlane (2002) examined assets value and assessment demonstrating in Sydney. An examination of the connection between value changes, populace and pay is completed at a LGA level. An examination of the connection between house
9
costs and the Consumer Price Index is embraced. The betas got when broke down on a quarterly premise are further from one and propose that there isn't as close a connection between developments in the market for the time being.
Geltner, MacGregor, and Schwann (2003) studied appraisal smoothing and price discovery in real estate markets using the private and public real estate markets. The study revealed that appraisers need to make an ideal evaluation of significant worth, in light of basic factors and market data, including exchanges and a market-wide examination record. Be that as it may, exchange costs are a boisterous sign and it is the appraiser's job to extricate the sign from the clamor in a proficient way. This includes a procedure of ideal mix of past and current data and prompts examination smoothing.
Thion, Riva, and Chameeva (2005) investigated repeat sales and urban price indices using a new approach in France. The study attempts to achieve by using such index is to discover profitability variations causing from environmental changes. The outcomes acquired both from a recreation strategy and a database test for Bordeaux area in France, showed the legitimacy of the technique and were reliable with the estimators determined by methods for existing understood procedures inside the recurrent deals tactic.
Peng (2010) investigated repeat sales on heterogeneous property in Chicago Housing from 1970 to 1986. Recreations give solid proof that the GRSR records all the more precisely measure the list for the whole market just as individual property estimation gratefulness than traditional RSR index and Chi-square test revealed that heterogeneity in property value appreciation across sub-markets, and simulations show that the test is powerful in small samples.
Boudry, Coulson, Kallberg and Liu (2012) examined what commercial real estate price indices really measure using a sample of 8864 repeat sales transactions between 1998 and 2010 in US. The following findings were made, that aggregate real estate indices do a modest job of explaining individual property price appreciation, that the execution is improved by firmly engaged lists, controlling for
10
property level income, about a large portion of the variety in property value gratefulness is as yet unclarified.
Jiang, Philips and Yu (2015) studied a new methodology for constructing real estate price index using Singapore Residential Market. The empirical analysis of the method using private residential property market in Singapore from 1995Q1 to 2014Q2, using a few times of significant value vacillation and changes in government approach. The list is found to perform much better in out-of-test expectation practices than either the S&P/Case-Shiller record or the list dependent on standard indulgent techniques.
Francke and Minne (2017) investigated the classified repeat sales technique on marketable assets in the Philadelphia district and on residential properties in a small part of Amsterdam. The aftereffects of the investigation indicated that the various leveled rehash deals model gives solid lists on a point by point level dependent on few perceptions. The evaluated degrees of opportunity for the t-dissemination is little, to a great extent dismissing the ordinarily made suspicion of typicality of the blunder term.
11
2.2.1 Review Summary
Table 1: Review of the Previous Article
Name & Year Nation Subject Outcome
Wang and Zorn (1997)
US Estimation of house price growth with repeat sales data in US.
They showed that paying more prominent regard to essential inquiries offers huge awards to the two
analysts and
professionals
Clapp and
Giaccotto (1998)
Price indices based on the hedonic repeat-sales method using housing market.
The study revealed that use of assessed value as the only hedonic characteristic allows parsimonious HRM estimates. Blight and MacFarlane (2002)
Sydney Property price and valuation modelling in Sydney.
The study revealed that there isn't a close connection between developments in the market for the time being.
Geltner,
MacGregor and Schwann (2003)
Appraisal smoothing and price discovery in real estate markets using the private and public real
The study revealed that appraisers have to make an optimum assessment of esteem, in view of
12
estate markets. basic factors and market data, including exchanges and a market-wide
examination index. Thion, Riva, and
Chameeva (2005)
France Repeat sales and urban price indices using a new approach in France.
The results obtained both from a simulation process and a database sample for Bordeaux region in France.
Peng (2010) Chicago Repeat sales on heterogeneous property in Chicago Housing from 1970 to 1986
It was revealed that heterogeneity in property value appreciation across
sub-markets, and
replications display that the assessment is controlling in small samples
Boudry, Coulson, Kallberg and Liu (2012)
US What commercial real estate price indices really measures
The study revealed that cumulative real estate indices make an unobtrusive showing of clarifying individual property cost appreciation.
Jiang, Philips and Yu (2015)
Singapore A new methodology for constructing real estate price index using
It was found to perform much better in out-of-sample prediction
13
Singapore Residential Market.
exercises than either the S&P/Case-Shiller index or the index based on standard hedonic methods
Francke and Minne (2017)
Philadelphia The hierarchical repeat sales model on marketable
assets in the
Philadelphia/Baltimore region and on residential properties in a small part of Amsterdam.
The results of the study showed that the hierarchical repeat sales model provides reliable indices.
14
3 THEORETICAL AND CONCEPTUAL FRAMEWORK
Several theoretical frameworks/models were been reviewed alongside the conceptual framework in this chapter.
3.1 Post-Stratification Model
Post stratification is a typical strategy in review investigation for consolidating populace dispersions of factors into study gauges. The fundamental method separates the example into post-strata and figures a post-stratification weight. The likelihood examining is one of the significant commitments of measurements to science, in any case. A few needs control characteristic in basic arbitrary testing stratified examining keeps up the likelihood idea of the example while controlling its pieces concerning significant characteristics.(Casady and Valliant, 1992)
Post-stratification is extremely basic practically speaking assuming a significant job in numerous administration reviews in an original paper. Nonetheless, (Casady and Valliant, 1992) viewed that its factual properties have gotten moderately little consideration. The writing all things considered examination the strategy from the randomization point of view, where the predisposition and mean squared mistake of estimators are evaluated over the inspecting dissemination. With values are dealt with. The economists describe them as follows: "Real estate prices are gathered in groups or" cells " observations concerning dwellings whose area and Physical traits are comparative. The normal costs of every cell are weighted to get a "consistent structure" cost. An adjustment in the sythesis of the example will change the quantity of perceptions in every cell. In any case, if the cells are characterized in a sufficiently precise manner, so that all their elements display similar prices and developments, the variations in sample composition will not systematically influence on the price of housing with a constant structure.
15
The stratification of connections conferring to certain determining features of price is a method simple calculation that allows you to make adjustments for account for variations in the nature of the examples at various periods. By characterizing various strata, one can use the price of average sale of each cell as indicator of a price constant quality of the corresponding real estate category.(Rossini and Kershaw, 2006)
The stratification or allows defining a few strata or reasonably homogeneous cells, one can use the price of the average sale of each cell as (indicator of a) price constant quality of the corresponding real estate category. Using the current theory of indices to collect average prices of different cells in a global index. These stratification methods are also known as homogeneous cell methods. This index has its flaws, the median indices are not always precise especially when the cost of sample houses is not representative of the total stock of houses. Another drawback of the post-stratification model is that it doesn’t consider the fact that a set of houses can be more expensive than another between periods (Tipton, Opsomer & Moisen, 2013). Sometimes the data or resources available are not sufficient to calculate hedonic indices. In these situations, stratified medians are often used as a simpler alternative and however, less reliable than the hedonic methods picnics. The first step in calculating a median stratified index (or adjusted from the position) is to divide the data by stratum. As with hedonic methods, the first division is to separate the houses of apartments. Each stratum can then be divided again according to location, for example by province, conscription, district or postal code. When information on the physiological characteristics housing are available, strategies may still be carried out by example depending on the area (lower surface or more than 80 square meters) or age (per example, new or old). In the applications empirical statements, once the houses are separated apartments we focus on the stratification of location according to postal codes and "Residex" regions for Sydney, and constituencies for Tokyo. Once the strata are built, the median price of each stratum is calculated. The average of medians is then calculated separately for houses and apartments, usually at using the arithmetic average formula tick.
16
With respect to computational complexity, the method of the stratified median is between a simple median method and a method adjusted hedonic quality. Calibration average median per limit stratum the noise in the index resulting from the changes composition of the median dwelling in time. Although, in principle, one more many layer should be synonymous name of better-quality adjustment, this approach quickly becomes problematic when the classification is refined and that some layers are empty at certain times (i.e. no transaction is recorded for a given composition of characteristics).
3.2 The Hedonic Price Model
The hedonic price method is commonly used in economics and statistics. Intuition simple is that the price of a good (apartment, car, computer etc.) or a service (salary) is a function of its features. For instance, the value of a home would be explained by its surface, its number of pieces but also by the infrastructures or the pollution present in his neighborhood. This method serves to calculate and correct indices price to non-market goods or environmental amenities. Hedonic methods are based on the idea that it is necessary to determine the prices of the characteristics (attributes) which appeal to the buyer. This latter can prefer to buy a housing unit with a balcony or chooses a flat in a location in a city. The price of the estate will be strongly related to the characteristics rather than to the estate itself.
The major problem with the Hedonic model is that prices cannot embody the characteristics of real estate: a price is a unit that cannot be partitioned into bits. Another problem is that it's impossible to account for the “desires” of the customers, and it’s unscientific to make a compilation based on intuition.
Once the hedonic model is estimated, it is possible to ask counterfactual questions, for example on the price of a dwelling. In the characteristic price analysis, hedonic regression techniques are used to measure the shadow values of the observed residential assets.
17
3.3 Existing Price Index in Turkey
In the European district, the real estate in Turkey is one of the most enterprising sector. The tactical location is at the crossroads of Europe, the Middle East and Central Asia, and with an estimated population of 81m, Turkey alludes excellent chances for construction sector inventors and stockholders in merging a vast real estate with increasing marketable and efficient production in the contruction sector. Here are few information and volumes related to the real estate in Turkey:
The sector of real estate contributes about 8.4 per cent of gross domestic product over the some decade ago. In terms of investment, foreign direct investment amounted to US$10.8b inflow, of which US $ 4.6 billion (or 42.9 percent) of total FDI for the foreign direct investment sector. Real estate and construction as at 2017. In the view of Franck Housing Index, Turkish house price was positioned at sixth in the 3rd quarter of 2017 indices. Turkey experienced an annual growth rate upsurge of 11.1%, making it among the best in the estate management of the world followed by India, Latvia, and Australia.
In 2017, the house sold in Turkey estate rose to US1.4m. In addition, house price sales to outsiders began to grow after the abolition in 2012 of the decree of reciprocity. More so, homes up to 22,234 were purchased to outsiders in the country, an annual growth of 22.2%. In relation to house purchase to outsiders in 2017, Istanbul remains the best-performing district with 8,182 sales, followed by Antalya with 4,707 sales, Bursa with 1,474 sales and Yalova with 1,079 sales (Coşkun, 2016).
The annual upsurge of gross leasable portion in the office market was approximately 12percent on mean from 2010 to 2017. Over 1.2m sq metres of office supplies are under construction.The Real Estate Investment association viewed Istanbul as the best and reliable real estate market with a price in June 2015 (Yener and Kun, 2011). This report is an obvious and reliable proof of Turkey with the real estate price from 2010 until 2015. This is a benchmark recently provided in many countries such as the US, Australia, France and Canada; that are developed on properties, usually referred to as "Brand Projects" built by real estate companies and real estate
18
developers. After soaring property prices, the Turkish market contracted slightly last year. The fear of seeing a housing bubble burst has turned into cautious optimism. Central bank monetary policy has led to sharp price increases in the Turkish property market between 2010 and 2014. Real estate has appreciated on average by 54% annually, hence the growing fear to witness the bursting of a housing bubble. Fortunately, calm returned to the real estate market last year. Many analysts say they are confident in the Turkish economy. According to a recent Ernst & Young survey of 6,000 large European companies, Turkey is considered the most positive and optimistic country in Europe.
"Turkey's real estate market is gaining momentum," said Vera Houthoofd of Turkimmo, where the number of homes sold to foreigners rose 17.3 percent in the first quarter, compared to 2014's prices. This development mainly concerns buildings over 10 years old, with fewer facilities than new ones, while new construction has remained almost unchanged since last year, with new buildings favoring modern infrastructures. And new types of material. "
According to Veronique Matthys of Immo Turkuaz, it is difficult to give an overview of the prices practiced on the Turkish real estate market. "There are huge differences between Istanbul, the tourist coasts and the eastern part of the country, and the Turks are not used to mention the sales price actually agreed on the title deed, the "official" figures are therefore unreliable”.
Number of house sales (Total) Table 2: House Sales Number
Turkey Istanbul 2013 1.157.190 234.789 2014 1.165.454 225.454 2015 1.289.320 239.767 2016 1.341.453 232.428 2017 1.409.314 238.383
Source: Author’s compilation (2019)
Hedonic regression, which deals with the price of a commodity as a function of its properties, can be influenced by two important statistical problems, including
19
omitted variable bias and multicollinearity. The problem of the excluded variable is often encountered in similar studies due to the inability to include all proxies that affect the value of the house as a result of data limitations. The characteristics of the houses are generally examined in three basic categories (environmental and environmental factors such as income level in the region, distance to public facilities such as hospitals and schools, etc.), structural features (building quality, width, number of rooms, etc.) and geographic location (Endeksi et al., 2016). In the data set used in this study, features related to the building and site of the housing subject to appraisal are significantly present while there are no environmental features. On the other hand, even in different houses in the same building, there may be price differences, so information on the location is insufficient to homogenize the housing market. However, while dividing the market into different layers based on location information, a more homogenous market structure is obtained as the number of layers increases, but the number of data per each layer decreases. In this case, there is a trade-off between the homogeneous market structure and the efficiency of the sheets in terms of the number of data. As a result, as in other studies using hedonic regression, exclusion variable bias may occur in this study, as it is not possible to obtain all of the variables affecting the price of a home. Nevertheless, in hedonic price indices, which are highly probable to encounter the excluded variable problem, the fact that the model is correctly constructed using the property prices method significantly reduces the sensitivity of the index to this problem.
The presence of these two variables may cause multiple linearity problems in the regression. In such cases, a high correlation between the variables causes the regression coefficient estimates to be unstable and the assessment of the power of the variables is difficult. On the other hand, hedonic price indices are not valid due to this problem (Hülagü et al., 2016). In practice, since the estimation values of the coefficients in the repeated samples approximate to their actual values, the shadow prices obtained by the method of multiple linearity property prices do not affect the prices. Therefore, the obtained results are econometrically consistent and hedonic housing price index is still valid even in the presence of multiple linearity problem. In addition, there is a trade-off between these two problems, since an explanatory
20
variable from the model due to high correlation may cause the excluded variable problem.
In Turkey, states, provinces and some level of more than 130 layers are used. Since regression analysis is performed for each period and each layer in the characteristic price method, it is almost intolerable to have similar variables statistically significant in all regressions. For this reason, first 36 periods between 2010 and 2012 and regression analyzes were performed for each layer. Then, the calculated p-values for each variable were recorded and an appropriate model was determined for each layer according to these values. (Kaya, 2012)
The borrowing equations from other sectors, market values including value, debts cannot be precisely determined that they use credit, which causes problems in terms of the quality of the data. So just to be created over the price valuation of real estate price index in Turkey will not be enough and realistic under current conditions. While it is possible to create a more unbiased and better data set when the actual prices that are expected to reflect the purchase and sale prices of the properties are used as the data set, it is impossible to reach the actual sales values of the houses in our country because of the legal applications. Turkey does not have any public or private authority as records of actual sales figures. In the Land Registry Office where the real estate is registered, as the sales values of the houses, the Property Tax Declaration value determined by the government and not compatible with real values in many regions is used. Therefore, there may be serious differences between the price of the sale in our country and the price declared in the title deed, which affects the work to be done with the aim of creating a real estate price index negatively.
3.4 New Index: Repeat Sales Indices
In the repeat sales method, the value of the asset changes and transactions volume enter into the structure of the index with the underlying assumption that market developments are more influenced by the number of transactions than the importance of these. As evolutions concerning the same goods, this model also seems all the more appropriate as the population studied is itself homogeneous and
21
the factors affecting the equilibrium of the markets are the same and thus induce the same effects. In terms of price growth rate, the location of buildings should then have little effect on the observed variations.
Indeed, (Antoine et al., no date)), drawing on the work of (Fisher, 2000) , highlighted the influence of a few key economic and financial variables on the equilibrium of real estate markets, for homogeneous markets. The fundamentals of the economy (demographics, incomes, money rates) that influence demand.
The level of rents that mechanically determine market prices according to the evolution of the discount rate.
The construction costs and the margin expected by the developers who will determine the quantity of new products placed on the market.
Existing stocks: the lower they are, the more price will be sensitive to a change in demand.
Thus, it can be assumed that for a class of homogeneous products, a modification of one of these factors will likewise influence the real estate properties composing the sample. If these products are spread over several neighborhoods, prices will evolve quite similarly from one neighborhood to another, provided that the market is sufficiently fluid, that is to say without any problem of stock. This does not mean that prices will remain the same regardless of the location of goods, but simply that their evolution over time, as measured by their growth rate, will be similar.
This hypothesis is all the more realistic since, when real estate price growth differs between two sectors, this can only be temporary. Otherwise, it means that prices in one neighborhood - or in one region - can increase indefinitely, whereas in another they remain stable and no possibility of arbitration can be offered to their inhabitants. Thus, even if real estate prices collapsed durably during the economic restructuring of departments such as Lorraine and the North, they have resumed a level comparable to other regions right out of the economic crisis.
The level of rents that mechanically determine market prices according to the evolution of the discount rate.
The construction costs and the margin expected by the developers who will determine the quantity of new products placed on the market.
22
Existing stocks: the lower they are, the more price will be sensitive to a change in demand.
Thus, it can be assumed that for a class of homogeneous products, a modification of one of these factors will likewise influence the real estate properties composing the sample. If these products are spread over several neighborhoods, prices will evolve quite similarly from one neighborhood to another, provided that the market is sufficiently fluid, without any problem of stock. This does not mean that prices will remain the same regardless of the location of goods, but simply that their evolution over time, as measured by their growth rate, will be similar.
This hypothesis is more realistic since, when real estate price growth differs between two sectors, this can only be temporary. Otherwise, it means that prices in one neighborhood - or in one region - can increase indefinitely, whereas in another they remain stable and no possibility of arbitration can be offered to their inhabitants. Thus, even if real estate prices collapsed durably during the economic restructuring of departments such as Lorraine and the North, they have resumed a level comparable to other regions right out of the economic crisis.
3.5 The Case and Schiller model
This model tracks the value of residential properties on a monthly basis. It covers 20 geographical areas of the United States, the Metropolitan Statistical Areas and considers only real estate that accommodates a single family (housing is therefore excluded which host several families, apartments). Based on commercial transactions, it uses a repeat-types regression to measure changes in value in the residential real estate sector, so it considers real estate that has been the subject of at least two commercial transactions.
With the maturity of the Turkish real estate, the dominant position of second-hand housing sales has gradually emerged. The volume of second-hand housing transactions in first- and second-tier cities has occupied most of the market transaction volume, and a new normal economy has been prepared and satisfied. The significance of the second-hand housing sales price index with comparable
23
quality conditions is becoming more and more important. At this stage, China's urban expansion is rapid, resulting in newer residential buildings in most second- and third-tier cities, and relatively less repeated transactions in the same residential area. This makes it difficult to eliminate the price difference caused by various external features. In the construction of residential buildings, it is often presented in the form of “community” and “building”, and the surrounding environmental characteristics of the location have great homogeneity. Based on the above situation, after comparing the applicability of various methods and the feasibility of data acquisition, this investigation finds a new method for the preparation of second-hand housing value index, the repetitive feature “R—H” trading method, which combines the characteristic price. The characteristics of the law and the repetitive transaction method can achieve the same homogeneity and comparability under the existing data conditions by selecting different matching spaces, and through the trial calculation of (Settlements, 2008), and the calculation result of the characteristic price method. Comparing, it is found that the repeated feature "R-H" trading method has higher accuracy and better stability and fitness.
Types of sales followed by Case-Shiller indices are referred to as handgun sales transactions. These are events where home sales are sold at market value and selling price data can be used to get an accurate situation report on the housing market. The shop where a mother sold his son to cheap, lower market prices was not included in any Case-Shiller index as it does not accurately reflect the holistic housing market. Foreclosure sales are included in the index because sales between a bank and a single person are considered to be both lengthy and repetitive sales Also excluded from the index are features whose designation changes (property recently held as a house, but now the apartment is not included), sales before or after the property change has dramatically changed the bedroom's house remodeled to a five-bedroom house) and for transactions that seem to be data errors (a home sold once for $ 100,000 later reported sold for $ 10,000).
24
4 STUDY METHOD
Introduction
The section shows the technique employed for the study. The method includes the model specification, description and measurement of variables, estimation techniques, apriori expectation and source of data.
4.1 Model
This study examine the application of repeat sale methodology on real estate from 2010 to 2017 using a single model. The multiple regression model was employed in the form of reliant and control variables. The dependent variable used was house price index (HPI) while the independent variables are new house price index, hedonic house price index and existing house price index which were the method used in Turkey for house price extraction. The model is presented as:
HPI = ƒ(NHPI, HHPI, EHPI u) ………. 4.1
Where
HPI = House Price Index
NHPI = New House Price Index HHPI = Hedonic House Price Index EHPI = Existing House Price Index U = Others
The mathematical form of equation 4.1 is as follows:
25 The econometric form is shown below
HPI = θ0 + θ1NHPI + θ2HHPI + θ3EHPI + Ɛ ………4.3
While the time series is presented as
HPIt = θ0 + θ1NHPIt + θ2HHPIt + θ3EHPIt + Ɛt ………4.4
Where θ0 = Constant
θ1 - θ3 = Shift parameter
t = time series
4.2 Description and Measurement of Variables Table 3: Variables are listed below
Variables Measurement
House Price Index (HPI) This is a wide proportion of the development of single-family house costs. This is used as dependent variable. New House Price Index (NHPI) This is used as the independent variable Hedonic House Price Index (HHPI) This is used as independent variable Existing House Price Index (EHPI) This is use for the existing homes and it
is used as the independent variable
Source: Author’s compilation (2019)
4.3 Apriori Expectation
This implies that all the independent variables such as hedonic house price index, new house price index and existing house price index are expected to show different signs to the dependent variable (house price index).
26
∂HPI
∂HHPI > 0, hedonic house price index is expected to be positive being a house price ∂HPI
∂NHPI >, < 0, new house price index is expected to be either positive or negative
being house sales.
∂HPI
∂EHPI > 0, existing house price index is expected to be positive to house sales
4.4 Estimation Techniques
The study used both descriptive and inferential statistics. The descriptive statistics involve the mean, median, maximum, minimum, Skewness, and Kurtosis while inferential statistics used was regression analysis while diagnostic measures in the form of normality test, serial correlation and, Heteroscedasticity test.
4.5 Source of Data
So as to accomplish the wide goal of this examination, secondary data were used and sourced from the online publications of Turkey statistical bulletin (TUIK). Monthly data were obtained from 2010 to 2018 for analytical purpose.
27
5 RESULT AND DISCUSSION OF FINDINGS
With the content of thıs thesis, this chapter discusses several analysis used in this thesis ranging from descriptive anaylysis and regression techniques. However, the result are dıscussed in detail as follows
5.1 Descriptive Analysis
Descriptive analysis is used to measure the normality of the variable which comprises the mean, median, maximum, minimum, standard deviatıon, Skewness and Kurtosis.
Table 4: Descriptive Result
The output of the descriptive result is shown below
2010M01-2018M11
HPI NHPI HHPI EHPI
Mean 170.1412 165.5990 153.1969 167.9898 Median 157.9200 156.1100 144.8900 155.3400 Maximum 275.5000 259.0300 227.6500 271.7000 Minimum 96.92000 96.62000 97.05000 97.79000 Std. Dev. 56.00404 50.89574 42.28405 55.03847 Skewness 0.358192 0.306667 0.333391 0.380432 Kurtosis 1.755438 1.745042 1.727579 1.757610 Jarque-Bera 9.193713 8.698646 9.200453 9.462575 Probability 0.010083 0.012916 0.010050 0.008815 Sum 18205.11 17719.09 16392.07 17974.91 Sum Sq. Dev. 332464.0 274579.9 189521.8 321098.7
28
Observations 107 107 107 107
Source: Eviews 9.0
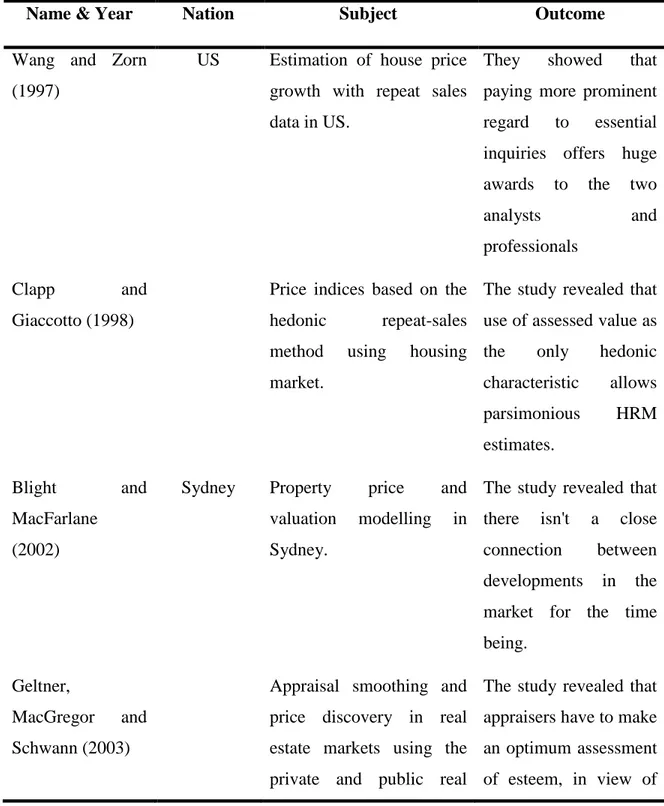
Table 5.1 displays the result of descriptive analysis of the proxies employed. The result of house price index reveals the mean value of 170.1412, median value of 157.9200, maximum value of 275.5000, minimum value of 96.92000 and the standard deviation value of 56.00404. The skewness value of HPI is 0.358192 implies that house price index is positively skewed, the new house price index reveals 0.306667 meaning that NHPI is positively skewed, hedonic house price index shows the value of 0.333391 indicating that HHPI is positively skewed while existing house price index shows the value of 0.380432 which implies that EHPI was also positively skewed. The Kurtosis statistics reveals that all the variables employed are platykurtic in nature that is they are less three (3). Meanwhile, the Jarque-Bera statistic value and its probability reveals that all the variables are not normally distributed during the study period.
5.2 Unit Root Test
The unit root testing is used to test the stationarity of the variable which is one of the requirements in regression analysis when using secondary data.
Table 5: Unit Root Outcome @ Level
Variable Augmented
Dickey-Fuller test statistic
Critical values
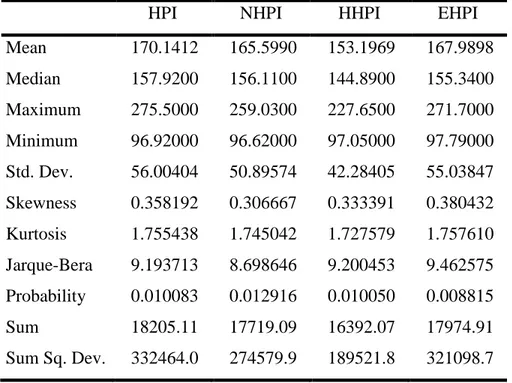
HPI 3.091202 -2.889200
HHPI 1.418730 -2.889200
EHPI 0.063267 -2.892536
NPI 4.205182 -2.888932
29
The above table shows the Augmented Dickey Fuller unit root result at level and it reveals that none of the variables are significant at level which necessitated the study to proceed to first difference testing.
Table 6: Unit Root Outcome @ First Difference
Variable ADF test Value Critical values
HPI -5.000349 -2.889200
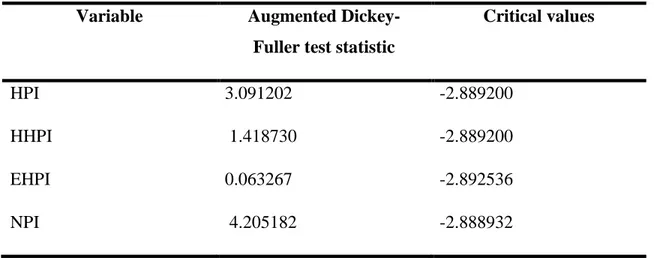
HHPI -4.605090 -2.889200
EHPI -1.308830 -2.892879
NPI -8.736879 -2.889200
Source: Writer’s compilation (2019)
The first difference testing of the ADF unit test presented in Table 5.3 reveals that HPI, HHPI and NPI are stationarity while EHPI is not stationarity which necessitated to test EHPI at second difference testing.
Table 7: Unit Root Result @ second Difference
Variable Augmented
Dickey-Fuller test statistic
Critical values
EHPI -4.754929 -2.892879
Source: Author’s compilation (2019)
The table above displays that result of unit rooting testing of EHPI and it shows that EHPI is stationarity at second difference.
30
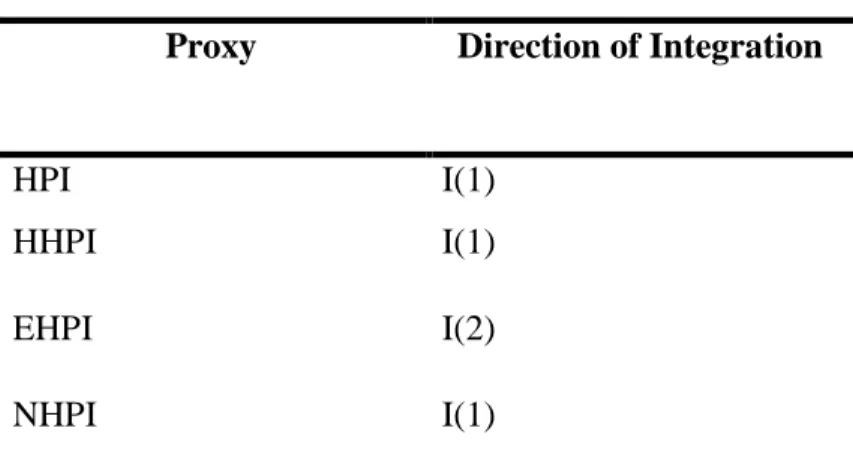
Table 8: Direction of Integration
Proxy Direction of Integration
HPI I(1)
HHPI I(1)
EHPI I(2)
NHPI I(1)
Source: Author’s compilation (2019)
The order of integration of the unit rooting using Augmented Dickey Fuller testing is presented in the above table. The result reveals that the variables were of the same order excluding EHPI which was stationary at second difference while others variables such as HPI, HHPI and NPI were stationary at first difference which that the shocks from the variables were retain for a short period after which they let go.
31
5.3 Regression Analysis
The regression analysis is used to test the impact or effect of the controling variables on the dependent variable.
Table 9: Regression Result
The outcome of the analysis is shown below: Dependent Variable: HPI
Variable Coefficient Std. Error t-Statistic Prob. C -7.886041 1.221872 -6.454065 0.0000 NHPI 0.416993 0.039888 10.45400 0.0000 HHPI 0.115156 0.061504 1.872343 0.0640 EHPI 0.543676 0.030841 17.62838 0.0000 R-squared 0.999874 Mean dependent var 170.1412 Adjusted
R-squared
0.999870 F-statistic 271758.3
Prob(F-statistic) 0.000000
Source: Writer’s Compilation (2020)
The above table revealed regression result of house price index used in Turkey. However, house price index was used as the reliant variable while the control variables were hedonic house price index, new house price index and existing house price index. More so, the coefficient of multiple determinant (R2) is 0.999874 representing 99.98%; the adjusted R-square 99.98% which implies that the variables were nicely fitted and the F-test showed 271758.3 and its P-values were 0.000000 which implies that all the independent variables (HHPI, NHPI and EHPI) can jointly influence house price index.
32
The result of the equation reveals that the independent variables have negative sign that is house price index is negative at constant with 7.886041 coefficient. This means that if all the proxies are constant, there will be a negative variation up to the tune of 7.886041 units in house price index and its P-value is 0. 0000. This means that, at constant there is a negative but significant effect of HHPI, NHPI and EHPI on house price index in Turkey during the study period.
From the table above, the regression coefficient of new house price index is 0.416993 and its P-values were 0.0000 indicating that NHPI has a positive and significant effect on house price index in Turkey and when NHPI increases with one unit, the house price index will positively increase with the value of 0.416993. The coefficient value of hedonic house price index is 0.115156 with p-value of 0.0640 implying that HHPI has a positive effect but it is not significant at 5% level of significance. That is, a unit increase in HHPI will lead to increase in house price but not significant. The coefficient value of existing house price index is 0.543676 and its p-value is 0.0000 showing that EHPI has a positive and significance effect on house price index in Turkey which also implies that a unit increase EHPI will spur house prices.
Re-statement of Research Hypotheses
Ho: There is no significant impact of hedonic house pricing index on house sales in Turkey.
Ho: New house pricing index has no significant influence on house sales in Turkey
Ho: There is no significant impact of existing house pricing on house sales in Turkey.
Decision Rule
Null Hypothesis: Accept, if the p-value is greater than 5%, reject if otherwise Alternative Hypothesis: Accept, if the sig. value is not more than 5%, reject if otherwise.
Ho1: There is no significant impact of hedonic house pricing index on house sales in Turkey.
33
Decision: The null hypothesis 1 failed to be rejected because the p-value is greater than 5% level of significance
Ho2: New house pricing index has no significant influence on house sales in Turkey.
Decision: The null hypothesis 2 was rejected because the sig. value is not more than 5% level of significance.
Ho: There is no significant impact of existing house pricing on house sales in Turkey.
Decision: The null hypothesis 2 was rejected because the significant value is less than 5% level of significance.
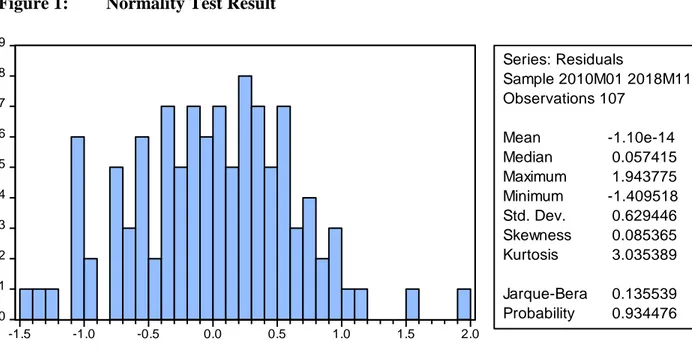
5.4 Post-Estimation Techniques 5.4.1 Normality Test
This test the routine of the proxy which the result is presented and interpreted below:
Figure 1: Normality Test Result
0 1 2 3 4 5 6 7 8 9 -1.5 -1.0 -0.5 0.0 0.5 1.0 1.5 2.0 Series: Residuals Sample 2010M01 2018M11 Observations 107 Mean -1.10e-14 Median 0.057415 Maximum 1.943775 Minimum -1.409518 Std. Dev. 0.629446 Skewness 0.085365 Kurtosis 3.035389 Jarque-Bera 0.135539 Probability 0.934476 Source: Author’s compilation (2019)
34
The result of the table reveals the JB value of 0.135539 and sig. value of 0.934476 which implies that the p-value is more than 5% level of significance that means the variables are normally distributed during the study period.
5.4.2 Serial Correlation
This is used to obtain the connection between two or more proxies
Table 10: Serial Correlation Result
Breusch-Godfrey Serial Correlation LM Test:
F-statistic 37.99196 Prob. F(2,101) 0.0550 Obs*R-squared 45.93795 Prob. Chi-Square(2) 0.0610
Source: Author’s compilation (2019)
One of the pre-conditions of regression analysis is that the variables should not be serially correlated and the result of the above table through the probability of Chi-square 2 shows that the value is more 5% level of significance which means that the variables employed are not serially correlated during the study period.
4.4.3 Heteroskedacity Test
Table 11: Heteroskedacity Test Result
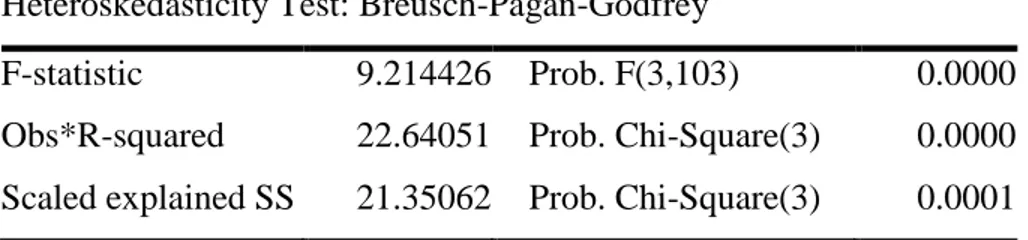
Heteroskedasticity Test: Breusch-Pagan-Godfrey
F-statistic 9.214426 Prob. F(3,103) 0.0000 Obs*R-squared 22.64051 Prob. Chi-Square(3) 0.0000 Scaled explained SS 21.35062 Prob. Chi-Square(3) 0.0001
Source: Author’s compilation (2019)
However, another pre-condition of regression analysis is heteroskedastic testing and the condition says the variable should be homoscedastic and not heteroskedastic. Meanwhile, the result of the observe R-squared and its probability of Chi-square reveals that there is possibility of heteroskedastic among the variables and this is one of the requirement of repeat sales method.
35
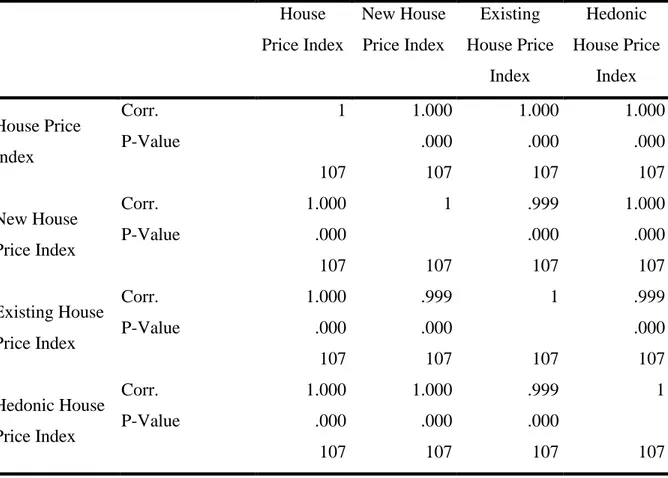
5.5 Correlation Analysis
The correlation analysis dıscuss the relationship between variables used in a study. However, this is used in this investigation to establish the connection between the proxies such as HPI, NHPI, EHPI and HHPI respectively.
Table 12: Correlations House Price Index New House Price Index Existing House Price Index Hedonic House Price Index House Price Index Corr. 1 1.000 1.000 1.000 P-Value .000 .000 .000 107 107 107 107 New House Price Index Corr. 1.000 1 .999 1.000 P-Value .000 .000 .000 107 107 107 107 Existing House Price Index Corr. 1.000 .999 1 .999 P-Value .000 .000 .000 107 107 107 107 Hedonic House Price Index Corr. 1.000 1.000 .999 1 P-Value .000 .000 .000 107 107 107 107 Source: SPSS 20.0
The correlation table presented above shows the relationship between the variables using Pearson correlation coefficient. The result reveals that house price index and new house price index exhibits positive and significant correlation between each other. House price index and existing house price index reveals positive relationship between each other while house price and hedonic house price also shows positive correlation between each other. Based on this analysis, it is showed that the variables are positively correlated to one another in Turkey context.
36
6 SUM-UP, DEDUCTION AND SUGGESTIONS
6.1 Sum-Up
This study examined the application of repeat sales methodology on real estate in Turkey. The study specifically used the existing means of real estate measures used in Istanbul, Turkey. However, the specific objectives are to inspect the impact of hedonic house pricing index on house sales in Turkey, to investigate the effect of new house pricing index on house sales in Turkey; and to determine the outcome of existing house pricing on house sales in Turkey. The objectives were tested at 5% level of significance.
Related write-ups were studied extending from perception clarifications, hypothetical literatures and experimental reviews of the past researchers. Time series data estimation techniques of descriptive analysis, unit root, regression analysis, and post estimation techniques were used.
The findings revealed that the skewness statistics showed that house price index was positively skewed, the new house price index revealed was positively skewed, hedonic house price index also showed a positive skewed while existing house price index revealed a positively skewed. The Kurtosis statistics reveals that all the variables employed were platykurtic in nature that is they are less three (3). Meanwhile, the Jarque-Bera statistic value and its probability revealed that all the variables were not normally distributed during the study period. The unit root test revealed that all the variables were of the same order excluding EHPI which was stationary at second difference while others variables such as HPI, HHPI and NPI were stationary at first difference which that the shocks from the variables were retain for a short period after which they let go.