c
T ¨UB˙ITAK
The Effect of Nicotinamide on Iron Corrosion in
Chloride Solutions
Tun¸c T ¨UKEN∗, Birg¨ul YAZICI, Mehmet ERB˙IL The University of C¸ ukurova, Science and Arts Faculty,
Department of Chemistry, 01330 Adana-TURKEY
Received 04.10.2001
The use of nicotinamide “3-pyridineamide” as an iron corrosion inhibitor was tested in aerated aque-ous solutions of NaCl and Na2SO4 for different pH values. Polarization resistance (Rp) measurements, polarization curves and AC impedance spectroscopy techniques were used to obtain experimental data. Nicotinamide (ND) was found to exhibit a cationic-type inhibitor behaviour in acidic solution of NaCl (pH 3) and also a weak inhibitory effect in acidic sulphate solution (pH 3). The impedance spectra at open circuit potential showed that the corrosion process of the metal was characterized by two dis-tinguishable capacitive loops. The charge transfer resistance (Rt) and the polarization resistance (Rp) values calculated from the interpretation of Nyquist plots were in agreement with the results of the other techniques.
Introduction
Numerous nitrogen-based organic compounds, such as imidazolines, amines and their salts, amides, and amido acids, have been used successfully as corrosion inhibitors in many practical applications. The cyclic organic compounds containing an amine group or those having a nitrogen atom on the ring are known to be
able to form a protective layer on the surface, and in some cases a polymeric structure is also available1−5.
It is already known that the adsorptive interaction between an organic (or inorganic) molecule and a metal surface depends on some certain physicochemical properties like functional groups, steric factors, aromaticity and the electronic structure of the molecules. When an organic substance containing a group with an unshared electron pair is adsorbed on the surface, a partial charge transfer is achieved between the
molecule and the metal and a coordinate covalent bond is formed1,5. As a result, the molecule is held strongly.
Reported studies with a series of nitrogen-based organic inhibitors showed that the electron density of the
functional group, which acts as the reaction centre affects the inhibition efficiency5−7. It is also reported
that the inhibitor efficiency of pyridine and its derivatives in acidic solutions increases as the electron density at the nitrogen atom constites the reaction centre for pyridine. The same results were obtained for aliphatic
and cyclic amines and have been supported by other studies1,8.
also known to be able to enhance the inhibitor efficiency of certain organic substances and the mechanism
has been reported to be a synergistic interaction between the halide ion and the organic molecule6,10.
The objective of this study was to investigate the effect of nicotinamide (ND) on the corrosion behaviour of iron in different aqueous mediums. Nicotinamide was a promising substance of its molecular
structure with a pyridine ring and a functional group including an electron donor -NH2 group. Its water
solubility is said to be good with respect to inhibitor application concentrations (10 g/100 mL).
Experimental
AC impedance technique, potentiokinetic I-E measurements and polarization resistance (Rp) measurements were used to obtain the experimental data. All the electrochemical measurements were carried out using the conventional three electrode set-up and with a computer controlled electrochemical analyser, CHI 604 A
(serial number: 6A721A). A platinum foil with a 1 cm2surface area was chosen as the counter electrode and
saturated calomel electrode via a Luggin capillary probe was used as the reference. The working electrode was an iron rod with a radius of 0.5 cm. It was soldered to a brass wire for electrical contact and embedded in a polyester block with one surface open exposure to the corrosive environment. Before each test the surface was polished with emery paper (400 to 1000 grade) and washed with distilled water.
The test solutions (NaCl and Na2SO4) were prepared with distilled water; all reagents were of
analytical grade and were used without any further purification. All the experiments were carried out open to the atmosphere and the solutions were stirred well with a magnetic stirrer. The experiments were repeated with different pH values (3, 7 and 10) which were adjusted using HCl and NaOH solutions and the reproducibility was tested and confirmed.
Results and Discussion
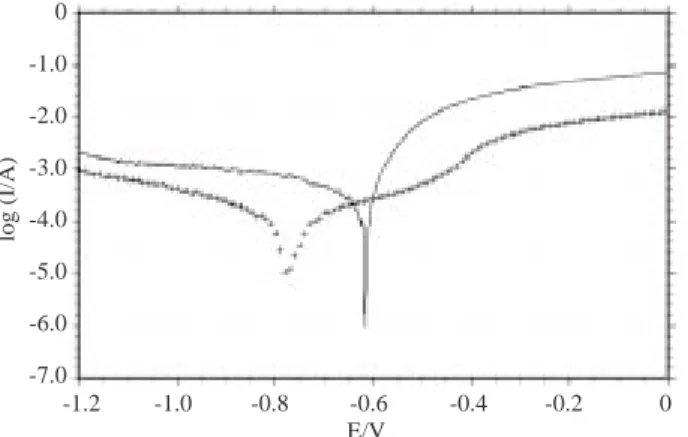
Figures 1-3 show the experimentally obtained polarization curves and Nyquist plots in chloride (3% NaCl) solutions of different pH values, with and without ND (0.001 M ND) addition. During the potentiokinetic scan the corrosion potential moved from –0.620 to –0.760 V vs. SCE and the current values were found to decrease significantly both in anodic and cathodic domains (Figure 1a). After the addition of ND the anodic curve exhibits a plateau beyond –0.7 V vs. SCE. The impedance measurements obtained in chloride solution with and without ND addition are given in Figure 1b. The Nyquist plots were characterized by two capacitive loops. The first capacitive loop was attributed to the anodic dissolution of the metal and
were considered to be equal to the charge transfer resistance (Rt∗). The second loop was thought to be
the response of the resistance resulting from ND adsorption, corrosion products and any other resistance (including the diffuse layer) on the current cross way from the Luggin probe to the Outer Helmholtz Phase
0 -1.0 -2.0 -3.0 -4.0 -5.0 -6.0 -7.0 log (I/A) -1.2 -1.0 -0.8 -0.6 -0.4 -0.2 0 E/V
Figure 1a. I-E curves in 3% NaCl (—-) and 3% NaCl + 10−3 M ND (++) solutions, pH 3 and the initial potential
is –1.0 V, scan rate = 10mV/s. 50.0 45.0 40.0 35.0 30.0 25.0 20.0 15.0 10.0 5.0 0 log (I/A) 0 5.0 10.0 E/V 15.0 20.0 25.0 30.0 35.0 40.0 45.0 50.0 10.0 9.0 8.0 7.0 6.0 5.0 4.0 3.0 2.0 1.0 00 2.0 6.0 8.0 10.0 12.0 Z’ / ohm 4.0 Z’ ’ / ohm
Figure 1b. The Nyquist plots in 3% NaCl (o) and 3% NaCl + 10−3M ND (•) solutions, pH 3, the frequency range
= 105− 10−2 Hz.
It is already known that an organic molecule with an electron donor group like –NH2 or –NH- can
easily acquire a hydrogen ion from acidic solution and the resulting cationic type molecule can be held on
the negatively charged (relatively) metal surface more strongly than before5−8. The cationic-type effect of
ND brought about the idea that the molecule could be protonated according to the following reaction:
N C-NH2 O H+ N C-NH3 O
Nicotinamid (ND)aq Protonat Nicotinamid (PND)aq
+
+
Since the electron density at the nitrogen atom in the pyridine ring is lower than that of the nitrogen
atom in the -NH2group, because of the aromaticity, the protonation reaction is proposed to occur as above.
The current decrease in the anodic region can be explained by ND adsorption on the surface even it is positively charged (relatively). The aromatic pyridine ring is thought to be responsible for the adsorptive
interaction with the positively charged surface. The Rp values measured by common technique and those
Solutions pH 3 pH 7 pH 10
Ecorr Rp∗ Rt∗ Rp Ecorr Rp∗ Rt∗ Rp Ecorr Rp∗ Rt∗ Rp
3% NaCl (A) -0.654 30 5 35 -1.05 75 8 80 -1.0 95 8 110
A+ -0.676 60 10 75 -1.05 65 8 70 -1.0 95 8 110
10−3M ND
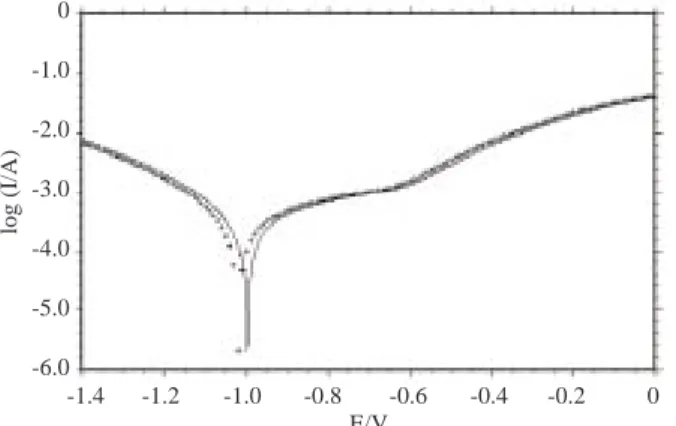
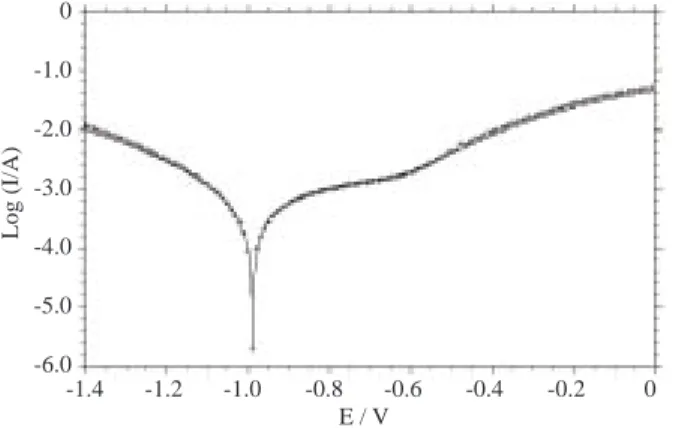
There was no significant change for current or potential values with the addition of ND and the
distributions of the Nyquist plots were almost identical for pH 7 and 10 (Figures 2 and 3). The Rp∗ values
were in agreement with those measured by the common technique and both the Rp∗ and the Rt∗ values did
not change with ND addition. All this data confirms that the ND molecule has no important effect on iron corrosion in neutral or alkaline solutions. The strong adsorptive interaction between the hydroxide ions and the surface might not allow the molecule to be effective. This also supports the idea that the molecule could bind a hydrogen ion and have a positive charge on the functional group because the ND adsorption in the cathodic domain was only seen for the acidic condition.
0 -1.0 -2.0 -3.0 -4.0 -5.0 -6.0 log (I/A) -1.2 -1.0 -0.8 -0.6 -0.4 -0.2 0 E/V -1.4
Figure 2a. The I-E curves in 3% NaCl (—-) and 3% NaCl + 10−3 M ND (++) solutions, pH 7 and the initial
potential is 1.0 V, scan rate = 10 mV/s.
70.0 60.0 50.0 40.0 30.0 20.0 10.0 0 -Z’’ / ohm 0 10.0 E/V 20.0 30.0 40.0 50.0 12.0 10.0 8.0 6.0 4.0 2.0 0 0 2.0 6.0 8.0 10.0 12.0 Z’ / ohm 4.0 Z’ ’ / ohm 60.0 70.0
Figure 2b. The Nyquist plots in 3% NaCl (◦) and 3% NaCl + 10−3 M ND (•) solutions, pH = 7, the frequency
0 -1.0 -2.0 -3.0 -4.0 -5.0 -6.0 Log (I/A) E / V -1.4 -1.2 -1.0 -0.8 -0.6 -0.4 -0.2 0
Figure 3a. The I-E curves curves in 3% NaCl (—-) and 3% NaCl+10−3M ND (++) solutions, pH 10 and the initial
potential is 1.0 V, scan rate = 10 mV/s.
70.0 60.0 50.0 40.0 30.0 20.0 10.0 0 -Z’’ / ohm 0 Z’ / ohm 20 40 60 80 12.0 10.0 8.0 6.0 4.0 2.0 0 0 2.0 6.0 8.0 10.012.0 Z’ / ohm 4.0 Z’ ’ / ohm 100 120
Figure 3b. The Nyquist plots in 3% NaCl (◦) and 3% NaCl+10−3M ND (•) solutions, pH 10, the frequency range
= 105− 10−2 Hz.
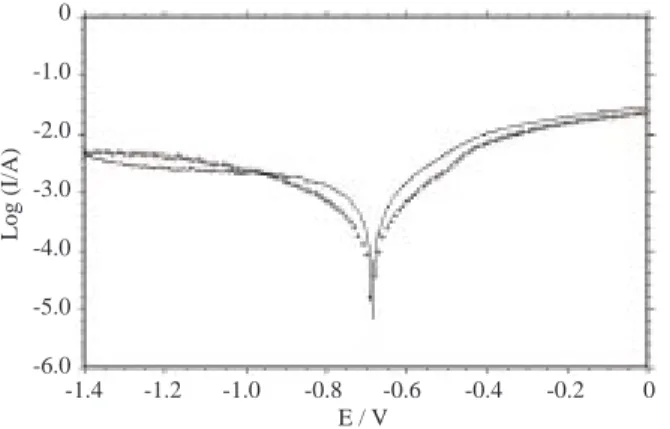
Since ND was found to have little efficiency in solutions where the pronounced effect of chloride ions was present, the performance of the molecule was examined in acidic sulphate solution. The current–
potential curves obtained in 0.1 M Na2SO4 solution with and without the addition of ND are shown in
Figure 4a. The only difference was a small current decrease for the anodic domain as the corrosion potential was unchanged. But when the scan rate was lowered from 10 mV/s (Figure 4a) to 1mV/s (Figure 4b) the corrosion potential moved to a more positive value with ND addition and the current decreased in the anodic domain. The chloride addition caused the corrosion potential to shift backward slightly. The high scan rate means the surface potential changes quickly; therefore, the surface equilibriums are not allowed to set up easily and the response of the system would be different. The chloride ion effect is also seen as an increase
-3.0 -4.0 -5.0 -6.0 Log (I/A) E / V -1.4 -1.2 -1.0 -0.8 -0.6 -0.4 -0.2 0
Figure 4a. The I-E curves obtained in 0.1 M Na2SO4(—-) and 0.1M Na2SO4 + 10−2M ND (++), pH 3, the initial
potential = -1.4 V, and scan rate = 10 mV/s.
0 -1.0 -2.0 -3.0 -4.0 -5.0 -6.0 Log (I/A) E / V -1.2 -1.0 -0.8 -0.6 -0.4 -0.2 0
Figure 4b. The I-E curves obtained in 0.1 M Na2SO4 (—-) and 0.1M Na2SO4 + 10−2 M ND (++) and 0.1M
Na2SO4+10−2M ND +10−3M NaCl (∆) solutions of pH 3 the initial potential = -1.2 V and scan rate = 1 mV/s.
50.0 45.0 40.0 35.0 30.0 25.0 20.0 15.0 10.0 5.0 0 -Z’’ / ohm Z’ / ohm 0 10 20 30 40 50 60 70 80 90 100
Figure 4c. The Nyquist plots in 0.1 M Na2SO4 (o) and 0.1 M Na2SO4 + 10−2 M ND (•) and 0.1 M Na2SO4 +
10−2M ND + 10−3 M NaCl (∆), pH 3, frequency range = 105− 10−2Hz.
Chloride addition caused an increase of polarization resistance but had no effect on the charge transfer
resistance (Rt∗) and there was no significant current decrease (Figure 4b,c). The increase of the Rp can be
effect and the amount of accumulation on the surface increases. This kind of non-protective accumulation
contributes to measured polarization resistance (Rp). This unstable accumulation can also be used to explain
the scattering seen in the low frequency region of the Nyquist plot given in Figure 4c.
Table 2. The corrosion potential values (Ecorr/V vs. SCE), measured polarization resistance values (Rp/ohm),
polarization and charge transfer resistance values determined from the Nyquist plots (Rp∗and Rt∗)
Solutions (pH 3) Ecorr Rp∗ Rt∗ Rp
0.1M Na2SO4(B) -0.682 55 20 60
B + 10−2M ND -0.644 80 25 80
B + ND + 10−3M CI− -0.669 110 25 110
The polarization resistance measurement technique is known to be the most applicable method to determine the corrosion rate since the applied potential is negligible. In general this measured resistance is said to be the charge transfer resistance. In an experimental set-up using a rotating disc electrode no species existing in the solution (corrosion products, organics, ions etc.) are allowed to accumulate on the surface;
therefore, the measured Rpvalue consists of the rate determining charge transfer resistance and diffuse layer
resistance and these two values cannot be distinguished well. The overlapping of the semi-circular response for the asymmetrically characterized double layer and that of the diffuse layer gives a semi-elliptical plot. In this case, the curve could be handled using the semi-ellipse model proposed by Erbil, which defines the
Rp as the total of Rt and Rd (Rp = Rt+ Rd)13−15. If a rotating disc electrode is not used some insoluble
corrosion products and other existing species could accumulate right after the OHP (10−9m away from the
surface) and these species placed between the Luggin probe (assuming that 10−4m away from the surface)
and the OHP exhibit a resistive effect which contributes to the measured Rp value (Tables 1 and 2). On the
other hand, they exhibit a shielding effect which could isolate the double layer from the diffuse layer and two capacitive loops are obtained. The first loop is attributed to the capacitance between the metal and OHP and the second one is attributed to all kinds of accumulating species (corrosion products, organics etc.). In
this study, the experimental results showed that the measured Rpvalue by the common technique is almost
equal to the Rp∗ value determined from Nyquist plots and the charge transfer resistance must corresponse
to the semicircular response in the high frequency region of the Nyquist plot. And the difference between these two resistance values must be the total of the diffuse layer resistance and all other resistance resulting from any species placed between the Luggin probe and the OHP.
Conclusions
The ND molecule is able to adsorb on the metal surface both in anodic and cathodic domains with different functional groups depending on the applied potential and the pH of the test solution. The molecule becomes a cationic type in acidic test solution of pH 3 through binding a hydrogen ion donating the unshared electrons
of the nitrogen atom of the functional –NH2 group. Under these conditions the molecule behaves like a
cationic-type inhibitor and the calculated inhibition efficiency from the equation ((Rp- Rp˚) / Rp˚) x 100 was
about 50%.
ND has no significant inhibition efficiency on the corrosion of the metal in neutral or alkaline condi-tions. On the other hand, the molecule acted as a weak inhibitor in acidic sulphate solutions and very low
References
1. A. Friganani, G. Trabanelli, Corros. Sci., 55, 653 (1999).
2. S. Aeiyach, B. Zaid, P.C. Lacaze, Electrochim. Acta, 44, 2889 (1999) 3. M.A. Quarishi, I.H. Faraogi, P.A. Saini, Corrosion, 55, 493 (1999). 4. D.E. Taliman, Y. Pae, and G.P. Bierwagen, Corrosion, 55, 779 (1999). 5. H. Luo, Y.C. Guan and K.N. Han, Corrosion, 9, 721 (1998)
6. P. Li, J.Y. Lin, L.Tan, Electrochim. Acta 42, 605 (1997)
7. G.Quartarone, G.Moretti, T.Bellomi, G. Capobianco, Corrosion, 8, 606 (1998). 8. H. Luo, Y.C. Guan, K.N. Han, Corros. Sci., 9, 721 (1998)
9. S. Azim, S. Muralidharan, I.S. Venkatakrishina, J. Appl. Electrochem, 25, 5 (1995) 10. S.S. Abd El Rehim, A.M. Magdy Ibrahim, J. Appl. Electrochem., 29, 501 (1987)
11. T. T¨uken, B. Yazıcı, M. Erbil, 9th European Symp. on Corrosion Inhibition, Vol. 1, pp. 115-126, 2000,
Ferrara, Italy.
12. T. T¨uken, MSc Thesis, The University of Cukurova, 2000. 13. M. Erbil, Turk. J. Chem., 11, 100-111 (1987).
14. M. Erbil, Chim. Acta Turc., No. 59, pp. 59-70 (1988) 15. M. Erbil, Turk. J. Chem., 8, 250-256 1984.