This paper was recommended for publication in revised form by Regional Editor Hakan Demir 1Fatih Sultan Mehmet Vakif University, Faculty of Engineering, Istanbul, TURKEY
EXPERIMENTAL EXAMINATION OF HEAT TRANSFER PERFORMANCE OF THE
HEATED RADIANT WALL SYSTEM
Aliihsan Koca1,*
ABSTRACT
In recent years, radiant heating systems have been catching more observation under favor of the many advantages such as; energy saving and thermal comfort. However, owing the fact that limited information on the system dynamics and the heat transfer characteristics of radiant systems, conventional systems are still preferred to radiant systems. Thereupon, radiant ceiling and floor systems are favored to wall systems. Also previous researchers have focused on radiant ceiling and floor systems instead of radiant wall systems. For this reason, a controlled climatic test set-up was built and detailed examinations were conducted. In this regard, to evaluate the heat transfer coefficients of the radiant wall panels, 10 different test cases were run using different supply water temperatures. On the basis of the obtained measurements, in the steady state, heat transfer coefficients, depending on the characteristic temperature differences and the heat transfer rates have been calculated. According to the results, the approximate mean values of 2.40, 5.49 and 8.29 W/m2K were evaluated, respectively for the convective, radiant and total heat transfer coefficients of radiant wall heating systems. Keywords: Radiant Heating, Heat Transfer Coefficient, Radiant Wall Heating
INTRODUCTION
Scientists and engineers have been seeking alternative heating-cooling systems to decrease energy usage of buildings and increasing thermal comfort levels. In this regard, in the last decade, many studies have been performed on radiant heating cooling systems [1]. Radiant heating is the system transfer heat mainly by the radiation (at least %50), by means of large heat transfer surface area. The main principle of the radiant systems is as follows; conditioned hot or cold water passes through the embedded pipes in the system and then maintain the surface temperatures to the desired levels. Afterwards, conditioned surfaces transfer heat to the air by means of convection and to the unconditioned surfaces via radiation. The average fraction of the radiation in total heat transfer is around 60% in cooling cases, while this value is the range of 70-80% in heating cases [1]. Many studies have been done to evaluate the energy efficiency and thermal comfort performance of radiant systems. Considering the general results of the previous works, authors are agreed that radiant systems have many advantages with regard to energy efficiency and thermal comfort, compared to conventional systems.
Some of the selected previous studies are reviewed below:
Imanari et al. [2] conducted a comparison study for the radiant ceiling and conventional forced air conditioner systems by means of thermal comfort, energy efficiency and cost. According to the results of his work, the radiant system provided homogenous temperature distribution in the occupied zone, resulted in higher comfort levels. Besides, the radiant system decreased the energy consumptions about 10% compared to the conventional forced air conditioner. Stetiu [3] conducted a numerical study to evaluate the energy and peak power saving performance of a radiant cooling system, which is used in the commercial buildings in the USA. According to the results, compared to the traditional systems, radiant cooling system consumed 30% less energy and decreased the peak power needs about 27%. Milorad and Dragan [4] compared the energy consumptions of a conventional radiator and a radiant system (both were fed by the condensing boiler). According to the results, the radiant system consumed 28% less energy compared to the radiator. DeWerth and Loria [5] reported that, radiant systems consume 10% less energy in modern buildings and 25% in old (before 1950) buildings compared to the forced air conditioner systems. Franc Sodec [6] carried out an economic analysis for radiant ceiling systems. According to the results, if the radiant system (designed based on the 45-55 W/m2 cooling the load) is used, first investment cost will be 20% less than the conventional systems. Moreover, he also reported that radiant systems decrease energy consumption by 10-20%, while saving 40-55% living space.
Catalina [7] examined the thermal comfort performance of the radiant ceiling cooling systems both experimentally and numerically. In the work, a room was modelled by commercial CFD software and then;
PMV, air temperature, mean radiant temperature and air velocity distributions were evaluated. Afterwards, the CFD model was validated by the experimental measurements. According to the general outcomes of the work, all local and general thermal comfort criteria were ensured. Dudkiewicz and Jezowiecki [8] showed that when radiant systems are used, thermal comfort conditions can be ensured with less air temperatures (up to 5°C), compared to conventional systems. Myhren J. and Holmberg S. [9] indicated that low temperature heating systems, which utilize large surfaces, ensure radiation dominated heat transfer. Therefore, thermal comfort conditions are achieved with lower air temperature (up to 1.5 °C). They also reported that, decreasing the air temperature by 1 °C under the favor of radiant systems, may ensure approximately 7% energy saving in a year. Koca et al. [10, 11] examined the thermal comfort performance of a radiant wall heating system by numerical simulations. Using the obtained numerical results, they calculated energy saving potential of the radiant wall heating systems.
Some of the selected previous studies in regard to the heat transfer capacity and heat transfer coefficient (here after HTC) calculations of radiant systems are given below:
Manuel A. and Tejero-González A. [12] conducted experimental studies for 18 different radiant ceiling panel configurations to evaulate the convection, radiation and total HTC’s. In their results, values of 4.2 W/m2.K, 5.4 W/m2.K and 8.5 W/m2.K were found respectively for the convection, radiation and total HTC’s. Causone et al. [13] investigated the HTC’s of radiant ceiling systems in an experimental test chamber equipped with the radiant system, simulates the typical conditions of occupancy. They remarked that, radiant ceiling HTC can be regarded constant at 5.6 W/m2.K. Furthermore, they suggested mean total HTC values of 5.8 W/m2.K and 13 W/m2.K, respectively for the ceiling heating and cooling systems. Miriel et al. [14] examined thermal performances of radiant systems for both heating and cooling operations. According to their results, in cooling cases, heat transfer took place via convection by 66%, while it was about 20 % for wall heating cases. Moreover, they proposed convection HTC’s of 1.2 W/m2.K and 3 W/m2.K, respectively for the ceiling heating and cooling cases. Koca et al. [15] evaluated HTC’s of wall radiant panels for their different arrangements in a real scale test room. According to the evaulated outcomes of the study, values of 5.7 W/m2.K and 2.7 W/m2.K were recommended as the radiation and convection HTC’s. In recent years, Koca et al. [16] examined 28 different ceiling panel configurations in a test chamber and obtained radiative, convective and total HTC’s. They recommended the values of 5.17 W/m2.K, 0.72 W/m2.K and 6.58 W/m2.K for the radiant, convection and total HTC’s. In the same study, they reported that 88% of the total heat transfer amount was covered through radiation. Koca et al. [17] experimentally investigated radiant ceiling-wall integrated cases. They reported that, when the wall heating system is integrated with the ceiling, total HTC of wall decreases about 18%, while the total ceiling HTC increases about 5%. Acikgoz et al. [18] developed an Artificial Neural Networks (ANN) method in order to calculate the heating capacity and HTC’s of radiant wall heating panels. Obtained results were compared with experimental measurements, which were carried with same conditions of ANN model. They proposed; radiant HTC as to be 5 W/m2.K, convective HTC as to be 2.7 W/m2.K and total HTC as to be 9 W/m2.K. Erikci Çelik et al. [19] studied heat transfer performance of a hybrid wall panel, numerically. Kanbur et al. [20] calculated the heat transfer capacities of the radiant panels, numerically.
Objectives
So far, a lot of researchers have studied the HTC’s of radiant ceiling and floor heating-cooling systems, however, very few studies have been conducted for radiant wall systems. The most detailed examination of the subject has been done by Koca et al. [15], where the characteristic temperature difference is 3.7 - 6.1 °C, while this value in this study is 6.4 - 15.1 °C. In the work of Koca et al. [15], the results of 6 experimental cases were employed to calculate the average HTC’s, while in this study 10 different experimental cases were used. The higher number of the experimental cases means the higher accuracy of the results. Accordingly, the first purpose of this research is to examine the heat transfer performance of the system and to evaluate the HTC’s.
In radiant systems, radiative HTC has been studied by many researchers. They proposed radiative HTC as the value equal to be around 5 - 5.5 W/m2.K. Though, proposed convective HTC’s vary in a quite wide range. Therefore, the results of this study will contribute to the related literature; by means providing detailed examination results for convective, radiative and total HTC’s. Moreover, experimental cases in this study cover sufficient range of characteristic temperature differences.
As indicated above, radiant heating-cooling systems have many advantages compared to conventional systems. However, owing to limited information on the heat-transfer mechanism of the radiant systems,
traditional heating-cooling systems are still favored. Therefore, radiant systems could not have been disseminated. Thus, another goal of this study is to propose practical engineering heat transfer correlations, which could be used by the design engineers and researchers who are working in this area.
EXPERIMENTAL STUDIES Arrangement of the Test Chamber
The test-chamber was constructed to simulate radiant heating systems under different boundary conditions which are listed in Table 1. As seen in the 3D illustration in Figure 1, the chamber is constituted of four different zones of façade (Volume 2), floor (Volume 3), ceiling (Volume 4) and tested room (Volume 1). Hereby it should be noted that, tested room is conditioned via the surrounding volumes, in which desired thermal boundary conditions were assured by means of mechanic air conditioners. Figure 2 shows the detailed dimensions of the tested room and surroundings. The general dimensions of the test room are agreeable with the standards (EN 1264-5 [21] and BS EN 14037-5 [22]). The emissivity of the unheated indoor surfaces and radiant wall surfaces, were determined through calibrated thermocouples and infrared thermal imaging camera (the method has been discussed in [23]).
Radiant wall panels were mounted inside the room (Volume 1) of which total wall area of 4.32 m2. Radiant wall panels are compromise of three different layers which are; insulation material, plastic heating pipes (the spacing of the pipes is 55 mm having an external diameter of 10 mm) and gypsum board. The gypsum board and insulation thicknesses are 15 mm and 20 mm, respectively. The dimensions of the wall panels are; 0.5 m in width and 2 m in height. The chamber is equipped with 6 panels which are mounted over the wall (Figure 3).
General specifications of the ANSI/ASHRAE Standard 138 [24] are fulfilled by the physical arrangements and thermal-physical properties of the test chamber. The main change from the ANSI/ASHRAE standard 138 [24] is that; in the present experimental set-up, surrounded volumes equipped with air conditioning units to ensure proper boundary conditions, while the standard recommends conditioning the test room directly by means of the separate conditioning system attached to the inner surfaces of the test room.
Hydraulic Circuit
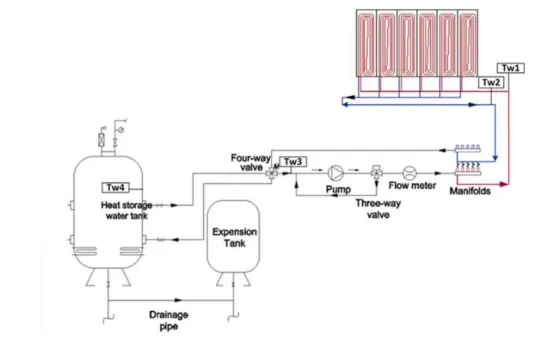
A hydraulic system was installed to the test system to provide appropriate inlet water temperature and flow rate to the radiant panels. Figure 4 illustrates the detail of the hydraulic line, and elements on this line. As shown in the figure, the hydraulic line is equipped with; buffer tank where the water temperature is maintained through the electrical resistances, four-way valve where the supply water temperature is set to the desired level by means of mixing the supply and return lines, three-way valve where the mass-flow rate of the water is maintained to the desired rate preciously, ultrasonic flow meter which measures the mass- flow rate and gives input to the flow rate control system.
Figure 1. 3D illustration of the test chamber [17]
Figure 1. Dimensions of the test chamber (in mm) [17]
Table 1. Controlled parameters
Volume - 4 Volume - 3 Volume - 2 Volume - 1
Temperature Range
-10˚C / +40˚C +0˚C / +30˚C -10˚C / +40˚C +0˚C / +30˚CTemperature Tolerance
± 0.5 ˚C ± 0.5 ˚C ± 0.5 ˚C ± 0.1 ˚CHumidity Range
- - %35 / %85 RH -Humidity Control Steps
- - %1 -Humidity Tolerance
- - ± % 0.5 RH -Air Velocity
- - 0,5 – 5 m/s -Figure 3. Arrangement of the wall panels The Measurement System
For each surrounding volumes, K-type thermocouples were mounted at the inlet of the mechanical air conditioner. By means of using the feedbacks from these thermocouples, temperatures of each surrounding volumes were set and controlled. Average radiant wall surface temperature was determined by means of five surface temperature transducers. The mean value of those temperatures was considered as the average heated surface temperature (Ts). Also, a thermal comfort measurement system was stationed at the center of the room, and used to measure the operative temperature (a detail of the thermal comfort measurement system is discussed in [15, 17]). In order to determine the area-weighted-unheated-surface-temperature (TAUST) – which is defined by ASHRAE Standard 55 [25] – one surface temperature transducer was installed at the center of the each unheated surfaces. Since, the unheated surfaces are made of high conductive aluminum material, acquiring measurements
only from the central positions of the surfaces was considered sufficient. It should be noted that all temperature transducers were adequately calibrated in an interval varying between 30oC and 50oC (R2 > 0.999 and precision
Figure 4. Hydraulic Circuit
is ±0.1°C). In the hydraulic circuit, supply water flow rate was measured by means of an ultrasonic flow-meter (uncertainty level is around ±1%). Moreover, water temperatures from; inlet (Tw1) and outlet (Tw2) of the wall panels, outlet of the 4-way valve (Tw3), inside the buffer tank (Tw4) were measured to follow and keep under control the water temperatures in the line (Figure 4).
The control system of the test chamber consists of two different independent systems which are Data Monitoring and Control System (DMCS) for the enclosed zones and NI LabVIEW© system for the studied volume. More detailed information about the data acquisition, processing procedures and other experimental details are given in [15, 17, 26].
Experimental Procedure
The most firm investigations are ones based on measurements performed in a real-scale experimental chamber such as that of the detailed above. The supply water mass flow rate, temperature and other substantial conditions (surrounding temperatures, panel surface temperatures, etc.) were kept constant at chosen initial conditions. The experimental case studies were executed in accordance with the standard (EN 14240 [27]) at steady state conditions. In order to set the inner surfaces of the testing room (Volume 1) into a desired condition, the surrounding volumes were adjusted at fixed temperatures till the required intervals are attained. It should be stated that steady-state conditions were assured after approximately 5-6 h, in terms of all variables (affecting the calculations) were nearly constant. In addition, before the start of an experiment, supply water was circulated (𝑚̇𝑤= 0.04 kg/s) in the wall panels to maintain the surfaces at set temperature. However, unheated surface
temperatures as well as the bulk air temperature were altered expose to the heat transfer from the wall panels. For the duration of the tests, water mass flow rate (𝑚̇𝑤), temperatures of supply (Tw1) and return water (Tw2) were recorded to determine the total heat transfer from wall panels. In the total HTC calculation, Top was used which was obtained experimentally directly by the thermal comfort device. The operative temperature was determined according to ASHRAE 55 [25] which is the weighted average value between the mean radiant temperature and the dry-bulb air temperature. For ascertaining the convection HTC, an air temperature transducer (Ta), installed at the middle of the room. The conduction heat loss from back fronts of the wall panels were derived through; the measured back front temperature (Tins) of the wall panel (an indicative wall panel was chosen), outer surface temperature (Tout) of the wall structures, U value of the wall construction, surface area of the panel (A) and insulation thickness of the panel.
Measurements were acquired and stored for the time span of 1 min. Results on average values have been found within the time span of 30 min. (average of 30 data intervals) in which steady-state conditions were
Table 2. Summary of the experimental cases
Cases C1 C2 C3 C4 C5 C6 C7 C8 C9 C10
Tw (°C) 29.3 30.9 34.1 34.9 39.9 38.8 45.2 43.6 48.7 49.4
Ts (°C) 26.4 27.8 30.1 31.5 35.1 33.9 38.9 37.6 41.3 43.4
observed. Experimental investigations were conducted for 10 different radiant wall heating cases (C1-C10), where the supply water temperatures vary in between 29.3 - 49.4 °C. Summary of the experimental cases is given in Table 2.
Using the evaluated measurements, total (ht), radiation (hr) and convection (hc) heat transfer mechanisms were obtained and the results were discussed in the next section.
Theoretical Data Reduction
Total heat transfer amount through the panels (𝑄𝑝) is the sum of; convection to the air (𝑄𝑐), radiation to
the unheated surfaces (𝑄𝑟) and heat loss through the back front of the panels by means of conduction (𝑄𝑙𝑜𝑠𝑠) are
demonstrated in Eq. (1):
𝑄
𝑝= 𝑄
𝑟+ 𝑄
𝑐+ 𝑄
𝑙𝑜𝑠𝑠(1) Where, 𝑄𝑃 was derived using the experimental measurements of supply fluid mass flow rate and fluid
temperature difference between at the inlet (Tw1) and at the outlet (Tw2) of the radiant circuit.
Net useful heat transfer rate through the radiant front surfaces was expressed as total heat flux density and was obtained as follows:
𝑞̇
𝑡=
𝑚̇𝑤𝐶𝑝∆𝑇𝑤
𝐴
− 𝑞̇
𝑙𝑜𝑠𝑠(2) Moreover, A (m2) is the active surface area of the wall heating panels, q̇
loss (W m⁄ 2) is the heat-loss
density through the back front of the radiant panels.
Heat-loss from back side of the panels was derived as follows:
𝑞̇
𝑙𝑜𝑠𝑠= 𝑈(𝑇
𝑖𝑛𝑠− 𝑇
𝑜𝑢𝑡)
(3) Total heat flux density can also be defined as the sum of radiation and convection:𝑞̇
𝑡= 𝑞̇
𝑟+ 𝑞̇
𝑐(4) Where, U (W/m2.K) is the heat transmission coefficient of the wall construction, where the panels are mounted, 𝑇𝑜𝑢𝑡 is the backside temperature of the wall construction and 𝑇𝑖𝑛𝑠 is the backside temperature of the
panels.
Furthermore, the total heat flux density which is composed of radiation and convection can also be expressed as follows:
ℎ
𝑡(𝑇
𝑠− 𝑇
𝑜𝑝) = ℎ
𝑟(𝑇
𝑠− 𝑇
𝐴𝑈𝑆𝑇) + ℎ
𝑐(𝑇
𝑠− 𝑇
𝑎)
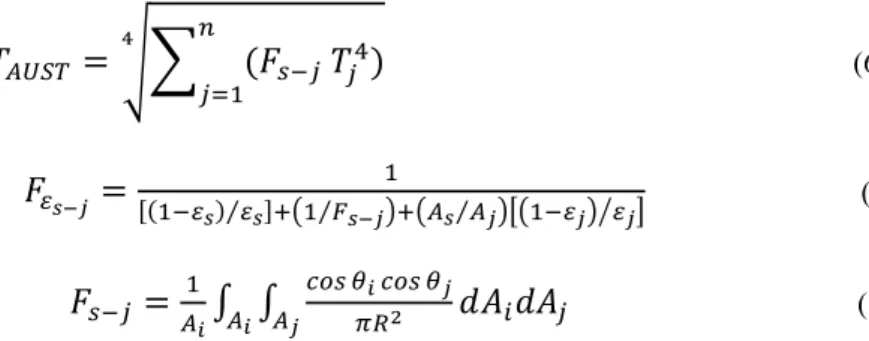
(5) Where, ℎ𝑡 (W/m2.K) is the total HTC, ℎ𝑟 radiation HTC, hc convection HTC, TAUST is the area weighted mean unheated surface temperature and Ta is the air temperature.For the derivation of the radiant HTC, mean unheated surface temperature (TAUST) was used and which was calculated by employing the view factors [13, 15]:
𝑇
𝐴𝑈𝑆𝑇= √∑
(𝐹
𝑠−𝑗𝑇
𝑗4)
𝑛 𝑗=1 4(6)
𝐹
𝜀𝑠−𝑗=
1 [(1−𝜀𝑠) 𝜀⁄ ]+(1 𝐹𝑠 ⁄ 𝑠−𝑗)+(𝐴𝑠⁄𝐴𝑗)[(1−𝜀𝑗) 𝜀⁄ ]𝑗(7)
𝐹
𝑠−𝑗=
1 𝐴𝑖∫ ∫
𝑐𝑜𝑠 𝜃𝑖𝑐𝑜𝑠 𝜃𝑗 𝜋𝑅2 𝐴𝑗 𝐴𝑖𝑑𝐴
𝑖𝑑𝐴
𝑗(8)
Radiant heat flux density (𝑞̇𝑟) between the active surfaces and the other surfaces was obtained utilizing
the Eq. 9 and afterwards the radiant HTC was calculated by means of Eq. 10:
𝑞̇
𝑟=𝜎 ∑
𝑛𝑗=1𝐹
𝜀𝑠−𝑗(𝑇
𝑠4− 𝑇
𝑗4)
(9)
ℎ
𝑟=
𝑞𝑟 𝑇𝑠−𝑇𝐴𝑈𝑆𝑇=
𝜎 ∑𝑛𝑗=1𝐹𝜀𝑠−𝑗(𝑇𝑠4−𝑇𝑗4) 𝑇𝑠−𝑇𝐴𝑈𝑆𝑇(10)
Integral definition of the view factors in Eq. 7 and net radiant heat transfer rates between the surfaces were obtained by means of a numerical approach using Matlab© code. In the code, geometry of the test chamber and the measured surface temperature were defined. In the calculations the emissivity value of 0.8 was implemented for the heated wall surfaces, while the emissivity value of 0.9 was employed for the unheated surfaces. These values were procured by an experimental method, which was explained in the previous part. In Figure 5, 3D model of the Matlab© code is given.
Figure 5. 3D Matlab© model
Obtained view factors from the code are given in Table 3. Where, surface number 5 is the radiant surface and the others are unheated surfaces.
Table 3. View factors
Surfaces 1 2 3 4 5 6 7 8 9 1 0.000 0.172 0.150 0.253 0.088 0.084 0.235 0.009 0.009 2 0.172 0.000 0.172 0.253 0.088 0.062 0.216 0.003 0.034 3 0.150 0.172 0.000 0.253 0.088 0.084 0.235 0.009 0.009 4 0.171 0.171 0.171 0.000 0.117 0.054 0.291 0.012 0.012 5 0.158 0.158 0.158 0.311 0.000 0.000 0.208 0.004 0.004 6 0.189 0.140 0.189 0.182 0.000 0.000 0.227 0.071 0.002 7 0.176 0.162 0.176 0.324 0.086 0.076 0.000 0.000 0.000 8 0.126 0.043 0.126 0.248 0.033 0.424 0.000 0.000 0.000 9 0.126 0.457 0.126 0.248 0.030 0.013 0.000 0.000 0.000
Total HTC (ht) was expressed as in the Eq. 11, where the 𝑇𝑜𝑝− 𝑇𝑠 is the characteristic temperature
difference and 𝑞̇𝑡 is the total heat flux density.
ℎ
𝑡=
𝑞̇𝑡𝑇𝑠−𝑇𝑜𝑝 (11)
Convection HTC (ℎ𝑐) was calculated through Eq. 12 and Eq. 13, where the 𝑞̇𝑐 is the convection heat
flux density among the radiant surfaces to air and 𝑇𝑠− 𝑇𝑎 is the characteristic temperature difference.
𝑞̇
𝑐= 𝑞̇
𝑡−𝑞̇
𝑟 (12)ℎ
𝑐=
𝑞̇𝑐𝑇𝑠−𝑇𝑎 (13)
For the heating surfaces, Nusselt number (Nu) is defined by Eq.14 where L is the characteristic length and k is the thermal conductivity.
𝑁𝑢 =
ℎ𝑐𝑜𝑛𝐿𝑘 (14)
The Nusselt number results were correlated by the dimensionless Ra number as follows:
𝑁𝑢 = 𝐶𝑅𝑎
𝑚 (15) Ra is defined by Eq. 16, where g (9.8 m/s2) is the gravitational constant, L is the length of the vertical/horizontal surface, ν is the kinematic viscosity of the convective fluid evaluated at mean fluid temperature, Tf (1.5 × 10⁻⁵m2⁄ ), β represents the thermal expansion coefficient (~ 0.0033 Ks -1) and Pr is the Prandtl number of the convective fluid at Tf (~ 0.7).𝑅𝑎 = [𝑔𝛽(𝑇
𝑠− 𝑇
𝑎)
𝐿3𝜐2
] 𝑃𝑟
(16)Experimental Uncertainty Calculations
In this section, uncertainty examination procedure of Holman [28] was considered, since which is the most preferred technic used in several papers. Error rates of each related variable (w) were calculated by means of Eq. 17.
w
R= ± [(
∂R ∂x1w
1)
2+ (
∂R ∂x2w
2)
2+. . . . (
∂R ∂xnw
n)
2]
1/2 (17)Where R is the measured variable of interest and x is the independent parameter that affects R.
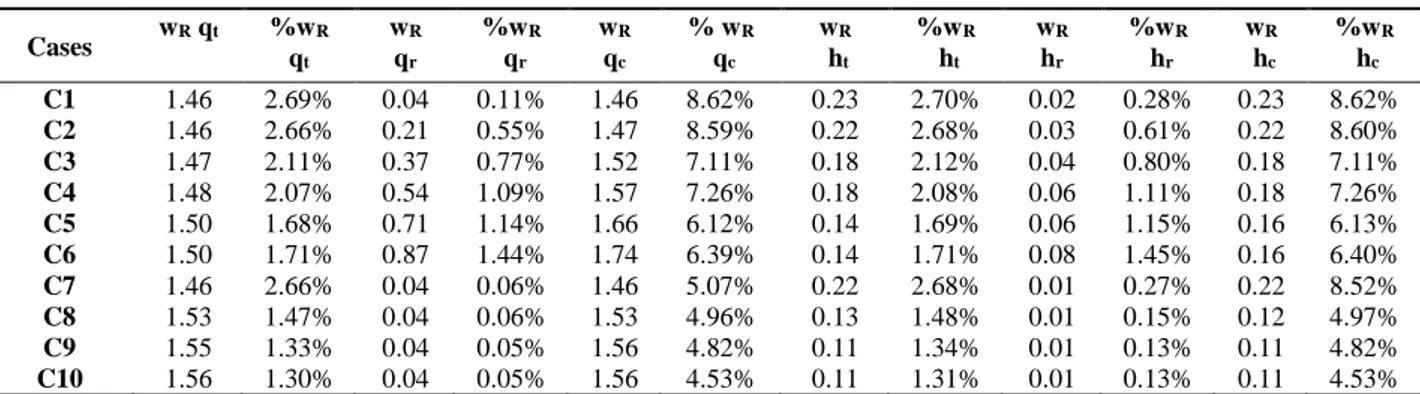
In Table 4, uncertainty examinations and possible errors in the evaluation of convective, radiant and total HTC’s and heat-flux densities are shown for each studied case.
Table 4. Uncertainty calculation results Cases wR qt %wq R t wR qr %wR qr wR qc % wR qc wR ht %wR ht wR hr %wR hr wR hc %wR hc C1 1.46 2.69% 0.04 0.11% 1.46 8.62% 0.23 2.70% 0.02 0.28% 0.23 8.62% C2 1.46 2.66% 0.21 0.55% 1.47 8.59% 0.22 2.68% 0.03 0.61% 0.22 8.60% C3 1.47 2.11% 0.37 0.77% 1.52 7.11% 0.18 2.12% 0.04 0.80% 0.18 7.11% C4 1.48 2.07% 0.54 1.09% 1.57 7.26% 0.18 2.08% 0.06 1.11% 0.18 7.26% C5 1.50 1.68% 0.71 1.14% 1.66 6.12% 0.14 1.69% 0.06 1.15% 0.16 6.13% C6 1.50 1.71% 0.87 1.44% 1.74 6.39% 0.14 1.71% 0.08 1.45% 0.16 6.40% C7 1.46 2.66% 0.04 0.06% 1.46 5.07% 0.22 2.68% 0.01 0.27% 0.22 8.52% C8 1.53 1.47% 0.04 0.06% 1.53 4.96% 0.13 1.48% 0.01 0.15% 0.12 4.97% C9 1.55 1.33% 0.04 0.05% 1.56 4.82% 0.11 1.34% 0.01 0.13% 0.11 4.82% C10 1.56 1.30% 0.04 0.05% 1.56 4.53% 0.11 1.31% 0.01 0.13% 0.11 4.53%
It is noticed from the uncertainty examination that radiant HTC’s and heat flux densities have lower uncertainties than the other experimental variables, since radiant heat transfer amounts were determined theoretically through developed Matlab© program. However, uncertainties of the convection HTC’s and heat flux densities are relatively larger than the other variables owing to calculation method.
RESULT AND DISCUSSIONS
Experimental investigations were conducted for 10 different radiant wall heating cases, where the supply water temperatures vary in between 29.3 - 49.4 °C. After the steady state conditions were observed, obtained experimental results were used to investigate the thermal performance of the system and the radiation (hr), convection (hc) and total (ht) HTC’s. HTC correlations were defined depending on the heat flux density (q̇) and characteristic temperature differences. Summary of the experimental cases and the results are given in Table 5.
Table 5. Summary results
Cases C1 C2 C3 C4 C5 C6 C7 C8 C9 C10 Qt (W) 325 360 419 448 550 528 660 624 701 739 Qr (W) 223 245 290 310 390 365 475 439 508 522 Qc (W) 101 115 128 138 160 163 185 185 194 217 q̇t (W/m2) 54 60 70 75 92 88 110 104 117 123 q̇r (W/m2) 37 41 48 52 65 61 79 73 85 87 q̇c (W/m2) 17 19 21 23 27 27 31 31 32 36 ht (W/m2.K) 8.51 8.00 8.40 7.72 8.04 8.43 8.49 8.55 8.43 8.17 hr (W/m2.K) 5.47 5.04 5.50 5.01 5.29 5.42 5.89 5.60 5.69 5.42 hc (W/m2.K) 2.62 2.52 2.54 2.36 2.31 2.58 2.36 2.49 2.29 2.36
Figure 6 shows the total heat flux density with the change of temperature differences between operative (Top) and panel surface (Ts) temperatures. As expected, the heat flux density increases with increase of characteristic temperature difference. Based on to the results, a linear relationship was obtained, where the slope of the trend line yields total HTC. Here, the total HTC varies in between 7.72 and 8.55 W/m2.K, placing in a mean value of 8.29 W/m2.K. Therefore, measured total HTC of this study was compared with those from the study of Koca et al. [15] and the suggested values in the international standards (EN 1264 [21] and EN 15377 [29]). Experimental results of this study are consistent with the previous study of Koca et al. [15] and the related international standards. Proposed total HTC of this study is 3.5% higher than the proposed value (8 W/m2.K) of the standards, while 0.4% lower from the one (8.32 W/m2.K), proposed in the previous study of Koca et al. [15]. Considering the results of this study and the previous study of Koca et al. [15], the value of 8.3 W/m2.K can be considered as a total HTC for radiant wall heating systems for the characteristic temperature difference range of 3.7 - 15.1 °C. In this study the proposed equation for 𝑞̇𝑡 calculation for the radiant wall will be as follows:
q̇
t= 8.29(T
s− T
op)
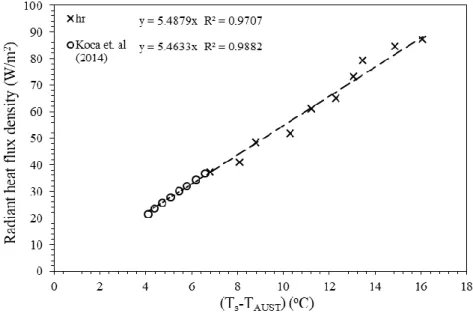
for Ts− Top ~ 6.4 - 15.1 °C (18)Wall radiant HTC was evaluated utilizing the average unconditioned surface temperature (TAUST) and wall panel surface temperature (Ts). Figure 7 demonstrates the wall radiant heat flux density, changes with the characteristic temperature differences (Ts-TAUST). An average radiant HTC (hr) value of 5.49 W/m2.K was attained from the elaborated results when the characteristic temperature changed from 6.8 to 16.1 °C. Evaluated results of this study were compared with the findings of the study of Koca et al. [15] experimental results (where the characteristic temperature difference ranges from 4.1 to 6.6 °C). Both experimental results are compatible with each other (the average value of hr those in Koca et al. [15] is approximately 0.5% lower than the one proposed in this study). Therefore, considering the results of the both studies, wall radiant HTC can be regarded as 5.5 W/m2.K for the characteristic temperature difference range of 4 - 16 °C – which can cover most of the practical engineering applications. However proposed hr in this study is similar to the ones proposed for radiant ceiling heating cases by Causone et al. [13] and Zhang et al. [30]. The proposed equation for 𝑞̇𝑟 calculation for
q̇
r= 5.49(T
s− T
AUST)
for Ts− TAUST ~ 6.8 - 16.1 °C (19)Figure 6. Total heat-flux density variation with the characteristic temperature difference
Figure 7. Radiant heat-flux density variation with the characteristic temperature difference
Figure 8 indicates the change in wall convective HTC with alteration of the temperature difference variation of the radiant panel surface temperature (Ts) and the average bulk air temperature (Ta). Average wall convective HTC was acquired by utilizing 10 different temperature differences, resulted in a mean value of 2.40 W/m2.K (changes from 2.31 W/m2.K to 2.62 W/m2.K). Elaborated h
c results in this work are in accordance with those obtained by Koca vd. [15]. Thus, based upon the results of both study, convection HTC can be proposed as the value of 2.4 W/m2.K for the temperature difference span of 4 - 15 °C. The proposed equation for 𝑞̇
𝑐
calculation for the radiant wall in this study will be as follows:
q̇
c= 2.40(T
s− T
a)
for Ts− Ta ~ 6.5 - 15.3 °C (20)Figure 9 shows the total, radiant and convective HTC comparisons of the experimental cases. As seen in the figure, HTC’s of total, radiation and convection span in the ranges of 8.04 - 8.51 W/m2.K, 5.01 - 5.69 W/m2.K,
Figure 8. Convective heat-flux density variation with the characteristic temperature difference
Figure 9. The variation of heat transfer coefficients
2.31 - 2.62 W/m2.K, respectively. Considering the trends of the spans, convective HTC have more stable alteration as against with the radiant and total HTC’s. Furthermore, to propose a proper HTC, experimental results should have adequate number of data points. In comparison to the results of Koca et al. [15] – in which 6 experimental data points were used – the proposed HTC’s in the study offer more precise results, by means of having 10 experimental data points.
In Table 6, the obtained HTC’s in this study with the comparison of the literature are given.
Convective HTC correlation was also proposed in terms of Nu and Ra by using the obtained measurements. Table 7 shows comparison results of convective HTC correlations with the data in literature [31-33].
In Figure 10, a bar graphic illustrates the distributions of the convection and radiation in the total heat transfer rates. As supposed, it is perceptible that the main heat transfer occurs through the radiation, with a maximum portion of 72% and minimum portion of 68%, resulting in a mean fraction of 70% in total heat transfer rate. Considering the measured values in the Table 5, one can figure out that, since the differences of the heating surface and bulk air temperatures are low, less air velocities are seen and therefore reduced convection heat transfer are perceived.
Table 6. Comparison between the literature and measured heat transfer coefficients
Source Heating Type Dimensions (m) ∆T hcon hrad htot
Causone et al. [13] Ceiling 4.3 x 2.7 x 2.6
Ts – Top Ts – TAUST Ts – Ta = ~ 5.5 - 10.7 = ~ 5.4 - 9 = ~ 7.7 - 12 0.3 5.6 5.8
Zhang et al. [30] Ceiling 12 × 6 × 3
Ts – Top Ts – TAUST Ts – Ta = 14 = 13.5 = 13.5 0.8 5.5 -
Okamoto et al. [1] Ceiling
~ 1.2 x 1.2 (heating surface)
-
1.69 5.65 -
Miriel et. al. [14] Ceiling 4 × 3.5 × 2.7 - 1.2 - -
EN 15377 [29], EN 1264 [21] Wall 4 x 4 x 3 - - - 8 Ceiling 4 x 4 x 3 - - - 6, 6.5 Koca et al. [15] Wall 6 x 4 x 3 Ts – Top Ts – TAUST Ts – Ta = 3.7 - 6.1 = 4.1 - 6.6 = 3.8 - 6.2 2.7 5.7 8.4
Present study Wall 4 x 4 x 3
Ts – Top Ts – TAUST Ts – Ta = 6.4 - 15.1 = 6.8 - 16.1 = 6.5 -15.3 2.40 5.49 8.29
Table 7. Comparison of convective HTC data in literature
Reference Present study Alamdari and Hammond [31] ASHRAE [32] Awbi et al. [33]
Dimensions 4 x 4 x 3 Plates up to 4 m in height - 2.78 x 2.78 x 2.30 Ra range 5x10⁹ – 1.05x10¹⁰ 104 - 1012 - 9x10⁸ - 6x10¹⁰ Correlation 𝑁𝑢 = 0.42(𝑅𝑎)0.269 ℎ = {[1.5(∆𝑇 𝐿⁄ )1 4⁄] − [1.23(∆𝑇)1 3⁄] 6 }1 6⁄ ℎ = 1.42(∆𝑇)(1 4⁄ ) 𝑁𝑢 = 0.289(𝐺𝑟)0.293 Ts - Ta 8 8 8 8 hcon (W/m2.K) 2.40 2.46 2.38 2.8
Figure 10. The fraction of convection and radiation heat transfer CONCLUDING REMARKS
In this work, heat transfer performance of the radiant wall heating system examined experimentally. Experiments were performed in a real scale test room, in which temperature and relative humidity are controlled precisely. Experimental investigations were conducted for 10 different radiant wall heating cases, where the supply water temperatures vary in between 29.3 - 49.4 °C. For each experimental cases study, empirical
definition, which depend on characteristic temperature difference, were proposed for total, radiation and convection heat transfer. The approximate average values of 8.29, 5.49 and 2.40 W/m2.K were found respectively for the total, radiation and convection heat transfer coefficients. Obtained HTC values in this work are consistent with those from the literature and the ones suggested by the international standards. In this regard, proposed total HTC of this study is 3.5% higher than the proposed value (8 W/m2.K) of the international standards. Considering the results of this study, suggested HTC’s can be used in practical applications in a safe manner, since they cover considerable quite ranges of characteristic temperature differences.
In the last part of the study, fractions of convective and radiative heat transfer amounts were given. According to the results, radiative heat transfer dominates the convective heat transfer, by covering 72% of the total heat transfer. As for future studies, similar experimental examinations should be done for radiant wall cooling systems.
NOMENCLATURE
A Area (m2)
Fεs−j Radiation interchange factor
Fs−j View factor between radiant surface and j-surface
hc Total heat transfer coefficient (W/m2.K) hr Radiation heat transfer coefficient (W/m2.K) ht Convective heat transfer coefficient (W/m2.K) ṁw Water mass flow rate (kg/s)
Qc Convection heat transfer amount (W) Qloss Conduction heat loss amount (W) Qr Radiation heat transfer amount (W) Qt Total net heat transfer amount (W) q̇c Convection heat-flux density (W/m2)
q̇loss Conduction heat-loss density (W/m2)
q̇r Radiation heat-flux density (W/m2)
q̇t Total heat-flux density (W/m2)
Ta Mean bulk air temperature (°C)
TAUST Area weighted mean unheated surface temperature (°C) Top Operative temperature (°C)
Ts Surface temperature (°C) Tw Supply water temperature (°C)
U Coefficient of thermal transmittance of surfaces (W/m2.K)
wR Error rate
ε Emissivity
σ Stefan-Boltzmann constant (W/m2.K4) REFERENCES
[1] Okamoto, S., Kitora, H., Yamaguchi, H., Oka, T., (2010). A simplified calculation method for estimating heat flux from ceiling radiant panels. Energy and Buildings, 42, 29-33.
[2] Imanari, T., Omori, T., Bogaki, K. (1999). Thermal comfort and energy consumption of the radiant ceiling panel system, comparison with the conventional all-air system. Energy and Buildings, 30, 167-175.
[3] Stetiu, C. (1999). Energy and peak power savings potential of radiant cooling systems in U.S. commercial buildings. Energy and Buildings, 30, 127-138.
[4] Milorad, B., Dragan, C. (2012). Energy, cost, and CO2 emission comparison between radiant wall panel systems and radiator systems. Energy and Buildings, 54, 496-502.
[5] DeWerth, D.W., Loria, R.L. (1989). In-space Heater Energy Use for Supplemental and Whole House Heating. ASHRAE Transaction, 95 (1), 239-250.
[6] Franc, S. (1999). Economic Viability of Cooling Ceiling Systems. Energy and Building, 30, 195-201. [7] Catalina, T., Virgone, J., Kuznik, F. (2009). Evaluation of thermal comfort using combined CFD and experimentation study in a test room equipped with a cooling ceiling. Building and Environment, 44, 1740-1750.
[8] Dudkiewicz, E., Jezowiecki, J. (2009). Measured Radiant Thermal Fields in Industrial Spaces Served by High Intensity Infrared Heater. Energy and Buildings, 41, 27-35.
[9] Myhren, J. A., Holmberg, S. (2009). Flow Patterns and Thermal Comfort in a Room with Panel, Floor and Wall Heating. Energy and Buildings, 40, 524-536.
[10] Koca, A., Gemici, Z., Bedir, K. (2014). Thermal comfort analysis of novel low exergy radiant heating cooling system and energy saving potential comparing to conventional systems. Progress in Exergy, Energy and Environment, Springer International Publishing, Switzerland, 38, 435-445.
[11] Koca, A., Gemici, Z., Topaçoğlu, Y., Çetin, G., Acet, R.C., Kanbur, B.B. (2013). Işınım ısıtma ve soğutma sistemlerinin ısıl konfor analizleri. 11. Ulusal tesisat mühendisliği kongresi, İzmir, 2025-2042.
[12] Manuel, A., Tejero-González, A. (2012). Experimental Study on the Cooling Capacity of a Radiant Cooled Ceiling System. Energy and Buildings, 54, 207-214.
[13] Causone, F., Corgnati, S.P., Filippi, M., Olesen, W.B. (2009). Experimental evaluation of heat transfer coefficients between radiant ceiling and room. Energy Buildings, 41, 622-628.
[14] Miriel, J., Serres, L., Trombe, A. (2002). Radiant ceiling panel heating-cooling systems: experimental and simulated study of the performances, thermal comfort and energy consumptions. Appl. Therm. Eng., 22, 1861-1873.
[15] Koca, A., Gemici, Z., Topacoglu, Y., Cetin, G., Acet, R.C., Kanbur, B.B. (2014). Experimental investigation of heat transfer coefficients between hydronic radiant heated wall and room. Energy Buildings, 82, 211-221.
[16] Koca, A., Acikgoz, O., Cebi, A., Cetin, G., Dalkilic, A., Wongwises, S. (2017). An experimental investigation devoted to determine heat transfer characteristics in a radiant ceiling heating system. Heat Mass Transfer, 1- 13.
[17] Koca, A., Cetin, G. (2017). Experimental investigation on the heat transfer coefficients of radiant heating systems: Wall, ceiling and wall-ceiling integration. Energy and Buildings, 148, 311-326.
[18] Acikgoz, O., Cebi, A., Celen, A., Dalkilic, A., Koca, A., Cetin, G., Gemici, Z., Wongwises S. (2017). A Novel ANN-Based Approach to Estimate Heat Transfer Coefficients in Radiant Wall Heating Systems. Energy and Buildings, 1- 6.
[19] Erikci Çelik, S.N., Zorer Gedik, G., Parlakyildiz, B., Koca, A., Çetin, M.G, Gemici, Z. (2016). The performance evaluation of the modular design of hybrid wall with surface heating and cooling system. A/Z ITU Journal of the Faculty of Architecture, 13(12), 31-37.
[20] Kanbur, B.B., Atayılmaz, S.O., Koca, A., Gemici, Z., Teke, İ. (2013). Işınım ısıtma panellerinde açığa çıkan ısı akılarının sayısal olarak incelenmesi. 19. Ulusal Isı Bilimi ve Tekniği Kongresi, Samsun, 1498-1502.
[21] EN 1264-5 Standard (2008). Water based surface embedded heating and cooling systems. Part 5: heating and cooling surfaces embedded in floors, ceilings and walls - determination of the thermal output, USA.
[22] BS EN 14037-5 Standard (2016). Free hanging heating and cooling surfaces for water with a temperature below 120°C. Open or closed heated ceiling surfaces. Test method for thermal output, USA.
[23] Olesen, B.W., Bonnefoi, F., Michel, E., De Carli, M. (2000). Heat exchange coefficient between floor surface and space by floor cooling – theory or a question of definition. ASHRAE Transactions, DA-00-8-2, 684-694.
[24] ANSI/ASHRAE Standard 138 (2005). Method of Testing for Rating Ceiling Panelsfor Sensible Heating and Cooling. ASHRAE, USA.
[25] ASHRAE Standart 55 (2003). Thermal environment conditions for human occupancy. ASHRAE, USA. [26] Koca, A., Atayilmaz, S.O., Ozden A. (2016). Experimental investigation of heat transfer and dehumidifying performance of novel condensing panel. Energy Buildings 129, 120-137.
[27] EN 14240 (2004). Ventilation for Buildings Chilled Ceilings Testing and Rating. British Standards. [28] Holman, J.P. (1994). Experimental Methods For Engineers, (6th Ed). Mcgraw-Hill Inc., New York. [29] BS EN 15377-1 (2008). Heating systems in buildings. Design of embedded water based surface heating and cooling systems - determination of the design heating and cooling capacity. British Standards.
[30] Zhang, L., Liu, X.H., Jiang, Y. (2013). Experimental evaluation of a suspended metal ceiling radiant panel with inclined fins. Energy Buildings 62, 522-529.
[31] Alamdari, F., Hammond, G.P. (1983). Improved data correlations for buoyancy-driven convection in rooms. Building Services Engineering Research and Technology, 4 (3), 106-112.
[32] ASHRAE Handbook of Fundamentals, 1981.
[33] Awbi, H.B., Hatton, A. (1999). Natural convection from heated room surfaces. Energy and Buildings, 30, 233-244.
![Figure 1. 3D illustration of the test chamber [17]](https://thumb-eu.123doks.com/thumbv2/9libnet/4516387.80313/4.892.125.771.163.435/figure-d-illustration-test-chamber.webp)