Analysis and Synthesis of Equilateral Triangular Ring Microstrip Antenna
using Support Vector Machine
Ahmet Kayabasi
Department of Electrical and Electronics Engineering
Engineering Faculty, Karamanoglu Mehmetbey University, Karaman, 70100, Turkey [email protected]
Abstract ─ A support vector machine (SVM) based analysis and synthesis models are presented for the equilateral triangular ring microstrip antennas (ETRMAs) that operate at ultrahigh band applications. The analysis and synthesis of irregularly shaped microstrip antennas (MAs) require complex, lengthy and time consuming mathematical procedures and artificial intelligence techniques such as SVM eliminate great effort and time. In this paper, two models based on SVM are constructed for analysis and synthesis of ETRMAs. The number of 100 ETRMAs with various geometrical and electrical parameters (L, l, h and εr) are simulated in terms of
resonant frequency (fr) with the aid of an electromagnetic
simulator program to obtain the data set. Two different SVM models are designed to obtain the resonant frequency and slot dimension of ETRMAs by using the simulation data set. The obtaining the resonant frequency and slot size are analysis and synthesis processes, respectively. The SVM models are trained with the simulated data set of 75 ETRMAs and tested with remainders 25 ETRMAs. A prototype of ETRMA is then fabricated to verify the proposed models in this paper. The testing results of the SVM are compared with the simulation/measurement results and the models are found to be successful. Antenna designers can use the proposed models quickly and simply in analysis and synthesis process of ETRMAs without the need for complex processes.
Index Terms ─ Analysis, microstrip antenna, synthesis, support vector machine, triangular ring microstrip antenna.
I. INTRODUCTION
Microstrip antennas (MAs) have significant advantages such as low size, lightness, robustness, ease of production, low production cost and physical compatibility with the surfaces. Because of these advantages, MAs are widely used in portable/non-portable wireless communication applications that require miniaturized geometry [1]. The smaller size antennas can be produced by using the substrate having high dielectric
constant but this leads to a reduction of performance efficiency and bandwidth parameters [1]. Therefore, performing the requirements of mobile communication devices is difficult by using the traditional patch geometries of MAs such as rectangular, triangular, circular, square. The miniaturized MAs are produced by applying some modification such as shorting pins, slits or slots on the traditional geometry structures [1]. Equilateral triangular ring microstrip antennas (ETRMAs) are constructed by triangular slot loading in the center of triangular patch. According to the same size triangular microstrip antenna, the resonant frequency is reduced due to slot loading into the triangular patch. For the same resonant frequency, the size of ETRMA reduces compared to the equilateral triangular microstrip antenna (ETMA).
Antenna analysis involves the process of calculating performance parameters such as resonance frequency, gain, bandwidth, radiation patterns, etc. On the other hand, antenna synthesis is the process of deriving physical structure for the given performance parameters reverse of antenna analysis. Several analytical and numerical methods having some disadvantages are generally used for analysis process [2]. The numerical methods give good results by using mixed mathematical operations. The numerical methods such as finite difference time domain method, finite element method and method of moment require much more time in solving Maxwell’s equations including integral and/or differential computations. So, it becomes time consuming since it repeats the same mathematical procedure even if a minor change in geometry is carried out. Moreover, the analytical methods such as the cavity model and the transmission line model are accurate but they are based on physical assumptions. These methods are more suitable for conventional MAs because of their regular shapes. In addition, these approaches require a new solution for every small change in the patch geometry [3]. Antenna designers need the synthesize to find the best antenna solution. Simulator tool packs such as HyperLynx® 3D EM [4], Ansoft HFSS [5], CST microwave studio [6], Agilent ADS [7] are commonly
1054-4887 © ACES
Submitted On: March 28, 2018 Accepted On: May 10, 2018
used to simplify the synthesis process. These simulation packages do not themselves produce a synthesized antenna, but they only analyze the antenna structure and provide calculated performance results for a synthesized antenna. Hence, artificial intelligence techniques are widely preferred as a faster and accurate alternative methods to accomplish these challenges associated with the traditional techniques in analysis and synthesis processes of MAs [3, 8]. Artificial intelligence models such as artificial neural network (ANN) [9], support vector machine (SVM) [10] and adaptive neuro fuzzy inference system (ANFIS) [11] eliminate the complex mathematical procedures and time consuming for processes of antenna design. These models have been widely used for analysis and synthesis of various MAs in the literature [12-25]. In [12-18], analysis studies were carried out to determine some performance parameters of MAs having various shapes with artificial intelligence techniques such as ANN, SVM and ANFIS. Also, synthesis models were proposed for MAs and microwave devices in [19-25]. In this study, SVM is preferred because of the following advantages: SVM often converges on global minimum rather than local minimum in high nonlinear problem. The overfitting problem and calculation procedures are less in the SVM method according to ANN and ANFIS. SVM requires less memory than other modeling methods.
In this work, SVM-based analysis and synthesis models is proposed as a tool for the design of ETRMAs. Using SVM technique, the resonant frequency (fr) and
slot size (l) of the ETRMAs are obtained as a function of input variables. For this purpose, ETRMA is designed and a two SVM models are constructed with a 100 ETRMAs simulation data set. The simulations are performed with the aid of a 3D full wave simulator using the method of moment (MoM) [26]. The data set of 75 ETRMAs are used to train the SVM models and remainders 25 ETRMAs are utilized to test the accuracy of models. The testing data set is not included in training process. The SVM models are then verified through the measured data set of a prototyped ETRMA in this study.
II. ETRMA STRUCTURE AND
SIMULATION PROCESS
ETRMA is formed by loading an equilateral triangular slot with size “l” on an equilateral triangular patch of size “L” as shown Fig. 1. The constituted ETRMA patch is placed on a substrate with h thickness and εr dielectric constant, all over on the ground layer.
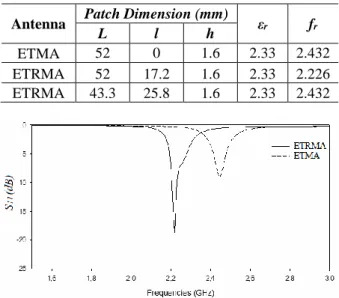
The ETRMA is fed at the point of x and y. The equilateral triangular slot causes to a reduction in resonant frequency compared to an ETMA of the same size. Also, the size of ETRMA is smaller than the size of ETMA in the same resonant frequency. These situations are seen in the simulation results given in Table 1 and Fig. 2.
(a) (b) (c)
Fig. 1. Geometry of the ETRMA: (a) back view, (b) front view, and (c) side view.
Table 1: Comparative simulation results for ETMA and ETRMA
Antenna Patch Dimension (mm) εr fr
L l h
ETMA 52 0 1.6 2.33 2.432 ETRMA 52 17.2 1.6 2.33 2.226 ETRMA 43.3 25.8 1.6 2.33 2.432
Fig. 2. The compared S11 parameters of simulated ETMA
and ETRMA for the same size
The 100 ETRMA with 4 parameters (L, l, h and εr)
are simulated to determine the resonant frequency (fr). A
total of 100 data set are generated, 75 of which are used for training the SVM models. The remaining 25 are used for testing the performance of the trained SVM models on inputs. From the data set, 75 and 25 ETRMAs are uniformly selected to train and test the accuracy of the models according to 75% and 25% of ETRMA data, respectively. These ratios used for training and testing data are widely preferred in the literature.The 25 testing data are not used in the training process. For this purpose, simulations of 100 ETRMAs are performed with the respect to the resonant frequency according to parameters given in Table 2. The “h” and “εr” values given in Table
2 belong to the substrate materials commonly used in the literature. Because the proposed analysis and synthesis models cover ETRMAs operating in the ultrahigh band, the patch dimensions are determined accordingly.
Table 2: Geometrical and electrical parameters of simulated ETRMAs Number of
Simulations
Patch Dimensions (mm) Dielectric Constant
(εr) L l h 20 26 3.44, 6.88, 10.32, 13.76, 17.2 1.6, 2.5 2.33, 4.4 20 34 5.16, 10.32, 15.48, 20.64, 25.8 20 52 8.6, 17.2, 25.8, 34.4, 43 20 69 17.2, 25.8, 34.4, 43, 51.6 20 86 25.8, 34.4, 43, 51.6, 60.2 The ETRMA structures are modelled/simulated
according to topology in Fig. 3 by means of computational electromagnetic software HyperLynx® 3D EM [4] using method of moment (MoM) [26]. In the simulations, 1 Volt wave source with coaxial fed is used for the ETRMAs. The antenna models are meshed with lines per wavelength ratio of 40 and maximum frequency of 5 GHz. It is simulated between the frequency of 0 GHz and 5 GHz. The HyperLynx® 3D EM's built-in optimization module was used to determine the feed point with the objective function S11 (dB) < −10 for the resonant
frequencies.
Fig. 3. The topology of the simulation process by HyperLynx® 3D EM software.
III. PROCESS OF SVM MODELS
CONSTRUCTION
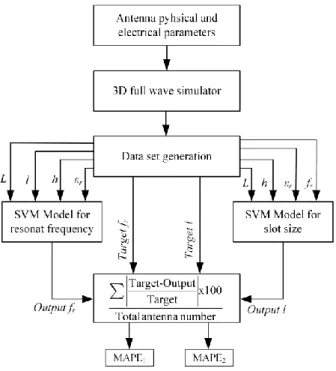
The process of SVM models construction is outlined in Fig. 4 for analysis and synthesis of ETRMAs. The resonant frequency and slot dimension of ETRMAs are obtained in the analysis and synthesis process, respectively. The SVM models are trained with 75 antenna data so that fitting the models’s outputs to results of simulation in the objective of minimizing MAPE calculating the mean absolute percentage error between the targets and outputs.
A. SVM modelling
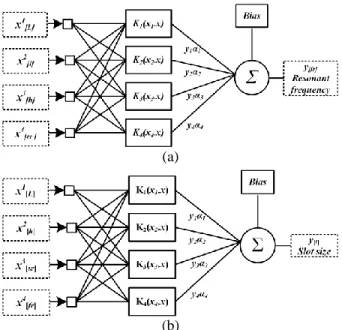
Analysis and synthesis models based on SVM are proposed for the design of ETRMAs according to the topology shown in Figs. 5 (a) and 5 (b). Machine learning methods are used for classification, regression and clustering problems. SVM is a new generation supervised learning model which used for regression analysis in machine learning [10]. In the nonlinear problems such as analysis and synthesis of antennas, SVM depends on the principle which is separation of two data groups by N-dimension optimum hyperplane by using the Kernel functions. The key point in SVM is linear discriminant function called hyperplane reflecting the characteristics of data-set. SVM effectively establishes an optimum hyperplane having equidistant from both of the data in a high or infinite dimensional space. [27].
(a) (b)
Fig. 5. The topology of SVM models: (a) for analysis, and (b) for synthesis.
B. Training the SVM models
The SVM models are trained through 75 of total 100 ETRMA data set according to flow chart given in Fig. 6. They are constructed using parameters in Table 3 for obtaining the resonant frequency and slot size of ETRMAS as shown in Figs. 7 (a) and 7 (b). The SVM models are codded in MATLAB® software. In this work, the used gaussian kernel function is given as
2 2 ( , ) exp 2 i i x x K x x
. (1)Fig. 6. Flow chart of the SVM models in the training phase.
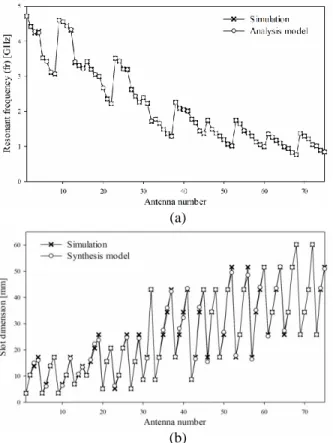
As it is seen from the Fig. 8, that the results of proposed SVM models and obtained from simulations are in a good harmony and MAPEs are achieved as 0.312% and 2.741% respectively for analysis (fr) and
synthesis (l) in the training process. The synthesis problem is more nonlinear than the analysis problem, therefore the MAPE calculated as a result of analysis is lower than the MAPE of synthesis.
(a)
(b)
Fig. 7. The proposed SVM models: (a) for resonant frequency, and (b) for slot size.
Table 3: The used SVM parameters for analysis and synthesis of ETRMA
Models Parameters Set Type/Value
Analysis model
Kernel function Gaussian Kernel function coefficient (σ) 28 Penalty weight (C) 1000000 Slack variables (epsilon-ξ) 0.001 Number of input 4 Number of output 1 Synthesis model
Kernel function Gaussian Kernel function coefficient (σ) 13 Penalty weight (C) 1000000 Slack variables (epsilon-ξ) 0.0025 Number of input 4 Number of output 1
(a)
(b)
Fig. 8. Comparative results of the simulation and SVM models: (a) for analysis and (b) for synthesis.
IV. TESTING RESULTS OF ANALYSIS AND
SYTNHESIS PROCESS FOR ETRMA
In the last section, SVM models are constructed and trained with properly parameters. The accuracies the SVM models are now tested through 25 ETRMAs data set not included in the training phase. As shown Figs. 9 (a) and 9 (b), graphical user interfaces (GUIs) are designed in MATLAB® software to use the SVM models for the antenna designer. Antenna designers be able to use this GUIs practically in ETRMA analysis and synthesis process.
A. Testing results of analysis process
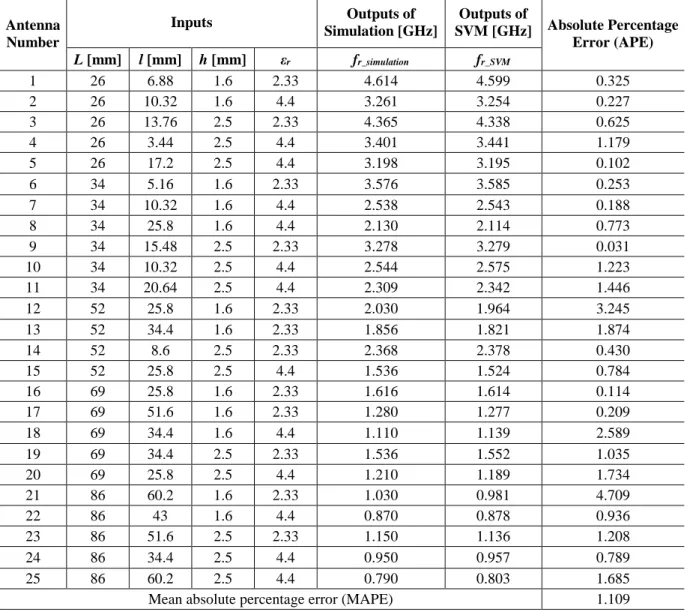
The accuracy of the SVM-based analysis model for obtaining the resonant frequency is tested through 25 ETRMAs data that is not utilized in training the model. The parameters of 25 simulated antennas with respective resonant frequency values and results of analysis model are given in Table 4. It is seen from the results; model successfully obtains the resonant frequency with MAPE of 1.109%. Also the harmony of simulation and SVM model results is seen in Fig. 10.
B. Results of synthesis process
The validity of the synthesis model based on SVM for obtaining the slot dimension is tested through 25
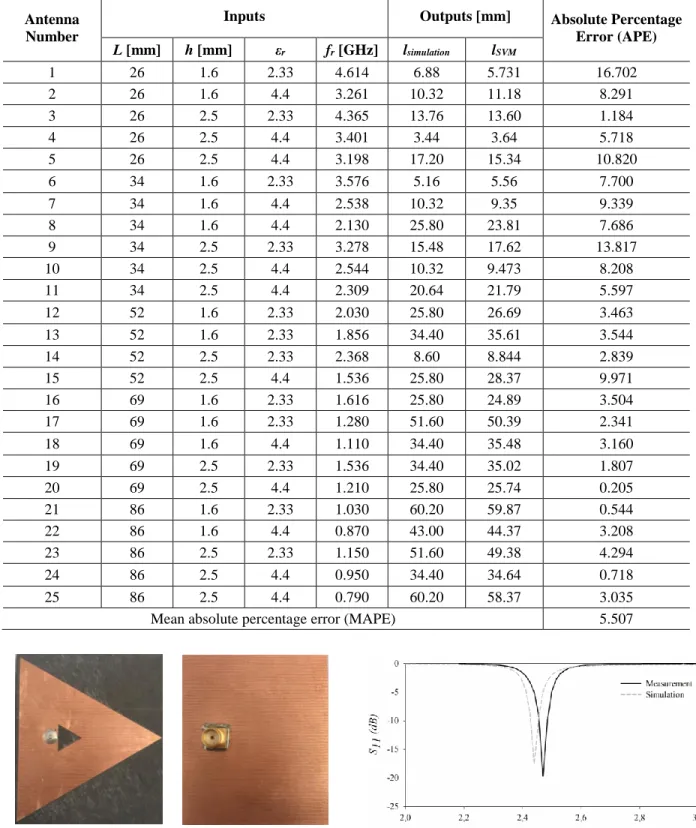
ETRMAs. The testing data set for the synthesis model are not included in the training process. The parameters of 25 simulated antennas and testing results of synthesis model are given in Table 5. Although the problem of obtaining slot dimension is a high nonlinearity problem, the results of the SVM-based synthesis model are harmony with the simulation results as shown in Table 5 and Fig. 11. The slot dimension with MAPE of 5.507% is obtained by the proposed model.
(a)
(b)
Fig. 9. The screenshots for GUI of the SVM models: (a) for analysis and (b) for synthesis.
Fig. 10. Comparative results of the simulation and analysis model in the testing process.
C. Fabrication of ETRMA
The accuracy and validity of SVM analysis/ synthesis models are verified on the fabricated ETRMA. ETRMA illustrated in Fig. 12 is printed on FR4 PCB substrate of which dielectric permittivity, tangent loss and thickness are 2.22, 0.02 and 1.6 mm, respectively. All parameters related to the antenna are given in Table 6. The prototyped antenna is measured by using Keysight Technologies N5224A PNA network analyzer. The measured S11 parameter is shown in Fig. 13 in
comparison with the simulated one. The results of measured and the analysis/synthesis models are listed in Tables 6 and 7 in order to evaluate the testing process in detail.
Fig. 11. Comparative results of the simulation and synthesis model in the testing process.
Table 4: Data set of testing for resonant frequencies and obtained results Antenna Number Inputs Outputs of Simulation [GHz] Outputs of SVM [GHz] Absolute Percentage Error (APE) L [mm] l [mm] h [mm] εr fr_simulation fr_SVM 1 26 6.88 1.6 2.33 4.614 4.599 0.325 2 26 10.32 1.6 4.4 3.261 3.254 0.227 3 26 13.76 2.5 2.33 4.365 4.338 0.625 4 26 3.44 2.5 4.4 3.401 3.441 1.179 5 26 17.2 2.5 4.4 3.198 3.195 0.102 6 34 5.16 1.6 2.33 3.576 3.585 0.253 7 34 10.32 1.6 4.4 2.538 2.543 0.188 8 34 25.8 1.6 4.4 2.130 2.114 0.773 9 34 15.48 2.5 2.33 3.278 3.279 0.031 10 34 10.32 2.5 4.4 2.544 2.575 1.223 11 34 20.64 2.5 4.4 2.309 2.342 1.446 12 52 25.8 1.6 2.33 2.030 1.964 3.245 13 52 34.4 1.6 2.33 1.856 1.821 1.874 14 52 8.6 2.5 2.33 2.368 2.378 0.430 15 52 25.8 2.5 4.4 1.536 1.524 0.784 16 69 25.8 1.6 2.33 1.616 1.614 0.114 17 69 51.6 1.6 2.33 1.280 1.277 0.209 18 69 34.4 1.6 4.4 1.110 1.139 2.589 19 69 34.4 2.5 2.33 1.536 1.552 1.035 20 69 25.8 2.5 4.4 1.210 1.189 1.734 21 86 60.2 1.6 2.33 1.030 0.981 4.709 22 86 43 1.6 4.4 0.870 0.878 0.936 23 86 51.6 2.5 2.33 1.150 1.136 1.208 24 86 34.4 2.5 4.4 0.950 0.957 0.789 25 86 60.2 2.5 4.4 0.790 0.803 1.685
Table 5: Data set of testing for slot sizes and obtained results Antenna
Number
Inputs Outputs [mm] Absolute Percentage
Error (APE) L [mm] h [mm] εr fr [GHz] lsimulation lSVM 1 26 1.6 2.33 4.614 6.88 5.731 16.702 2 26 1.6 4.4 3.261 10.32 11.18 8.291 3 26 2.5 2.33 4.365 13.76 13.60 1.184 4 26 2.5 4.4 3.401 3.44 3.64 5.718 5 26 2.5 4.4 3.198 17.20 15.34 10.820 6 34 1.6 2.33 3.576 5.16 5.56 7.700 7 34 1.6 4.4 2.538 10.32 9.35 9.339 8 34 1.6 4.4 2.130 25.80 23.81 7.686 9 34 2.5 2.33 3.278 15.48 17.62 13.817 10 34 2.5 4.4 2.544 10.32 9.473 8.208 11 34 2.5 4.4 2.309 20.64 21.79 5.597 12 52 1.6 2.33 2.030 25.80 26.69 3.463 13 52 1.6 2.33 1.856 34.40 35.61 3.544 14 52 2.5 2.33 2.368 8.60 8.844 2.839 15 52 2.5 4.4 1.536 25.80 28.37 9.971 16 69 1.6 2.33 1.616 25.80 24.89 3.504 17 69 1.6 2.33 1.280 51.60 50.39 2.341 18 69 1.6 4.4 1.110 34.40 35.48 3.160 19 69 2.5 2.33 1.536 34.40 35.02 1.807 20 69 2.5 4.4 1.210 25.80 25.74 0.205 21 86 1.6 2.33 1.030 60.20 59.87 0.544 22 86 1.6 4.4 0.870 43.00 44.37 3.208 23 86 2.5 2.33 1.150 51.60 49.38 4.294 24 86 2.5 4.4 0.950 34.40 34.64 0.718 25 86 2.5 4.4 0.790 60.20 58.37 3.035
Mean absolute percentage error (MAPE) 5.507
(a) (b)
Fig. 12. The photograph of prototyped ETRPA: (a) front view and (b) back view.
Fig. 13. S11 parameters of simulated and measured
Table 6: The comparative results for resonant frequency
Inputs Resonant
Frequency [GHz] L [mm] l [mm] h [mm] εr fsim. fmea. fSVM
52 8.6 1.6 2.22 2.438 2.468 2.391 Table 7: The comparative results for slot size
Inputs Outputs
[mm] L [mm] h [mm] εr fr [GHz] lmea. lSVM
52 1.6 2.22 2.468 8.600 8.427 From Tables 6 and 7, the results of SVM models are much close to the simulated/measured results. Therefore, the SVM models can be successfully used to obtain the resonant frequency (fr) and slot size (l) of the ETRMAs
without handling sophisticated mathematical functions and transformations. Moreover, the proposed models can be modified or improved to use similar tasks of nonlinear electromagnetic problems. The antenna designers can use practically the proposed models for analysis and synthesis of ETRMA.
V. CONCLUSION
In this work, two SVM models are implemented for analysis and synthesis of the ETRMAs. A data set of 75 ETRMAs are used for training and the remainders 25 data set are utilized for testing the SVM models. The four antenna parameters are input the model to obtain the resonant frequency of ETRMA in the analysis process. In this design process, synthesis is defined as the forward side and then analysis as the reverse side of the problem. At the output of the synthesis model, slot dimension of ETRMA is also obtained by inputting length of antenna, height/dielectric constants of the chosen substrate and resonant frequency. The results achieved in this study show that proposed SVM models can be successfully used to obtain the resonant frequency and slot size of ETRMAs with high accuracy. The SVM technique may be preferred as a faster and accurate alternative methods according to the traditional techniques in analysis and synthesis processes of MAs.
REFERENCES
[1] K. Wong, Compact and Broadband Microstrip Antennas. John Wiley & Sons, Inc., 2002.
[2] J. R. James, P. S. Hall, and C. Wood, Microstrip Antenna Theory and Design. IEE. Peter Peregrinus, 1981.
[3] Q. J. Zhang and K. C. Gupta, Neural Networks for RF and Microwave Design. Artech House Publishers, 2000.
[4] HyperLynx® 3D EM, Version 15, Mentor Graphics Corporation, 8005 SW Boeckman Road, Wilsonville, OR 97070.
[5] Ansoft Corporation, HFSS v. 10.1.1 user manual, July 2006. http://www.ansoft. com
[6] CST GmbH-Computer Simulation Technology, CST Microwave Studio 2006 user manual, 2006. http://www.cst.com
[7] Agilent Technologies, EEsof EDA, Momentum. http://eesof.Tm. Agilent.com/products/momentum main. html
[8] C. G. Christodoulou and M. Georgiopoulos, Applications of Neural Networks in Electromag-netics. Artech House, Boston, 2001.
[9] S. Haykin, Neural Networks: A Comprehensive Foundation. Macmillan College Publishing Company, New York, ABD, 1994.
[10] N. V. Vapnik and A. Y. Chervonenkis, “The Necessary and Sufficient Conditions for Consistency in the Empirical Risk Minimization Method,” Lect. Notes, Comput. Sc., vol. 1, no. 3, pp. 283-305, 1991. [11] J. S. R. Jang, “ANFIS: Adaptive-network-based fuzzy inference system,” IEEE TSyst. Man. Cy., vol. 23, pp. 665-685, 1993.
[12] A. Akdagli, A. Kayabasi, and I Develi, “Computing resonant frequency of C-shaped compact microstrip antennas by using ANFIS,” Int. J. Elec., vol. 102, pp. 407-417, 2015.
[13] A. Kayabasi and A. Akdagli, “Predicting the resonant frequency of E-shaped compact microstrip antennas by using ANFIS and SVM,” Wireless Pers. Commun., vol. 82 pp. 1893-1906, 2015. [14] A. Kayabasi, A. Toktas, A. Akdagli, M. B. Bicer,
and D. Ustun, “Applications of ANN and ANFIS to predict the resonant frequency of L-shaped compact microstrip antennas,” Appl. Comput. Electrom., vol. 29, pp. 460-469, 2014.
[15] K. Guney and N. Sarikaya, “Adaptive neuro-fuzzy inference system for computing the resonant frequency of circular microstrip antennas,” Appl. Comput. Electrom., vol. 19, pp. 188-197, 2004. [16] F. Güneş, N. T. Tokan, and F. Gürgen, “A
consensual modeling of the expert systems applied to microwave devices,” Int. J. RF Microw. Comput.-aided Eng., vol. 20, pp. 430-440, 2010.
[17] Y. Tighilt, F. Bouttout, and A. Khellaf, “Modeling and design of printed antennas using neural networks,” Int. J. RF Microw. Comput.-aided Eng., vol. 21, pp. 228-233, 2011.
[18] A. R. Venmathi and L. Vanitha, “Support vector machine for bandwidth analysis of slotted micro-strip antenna,” Int. J. Comput. Inf. Sci., vol. 4, no. 1, pp. 67-61, 2011.
[19] W. Zhongbao and S. Fang, “ANN synthesis model of single-feed corner-truncated circularly polarized microstrip antenna with an air gap for wideband applications,” Int. J. Antennas Propag., 2014. [20] H. J. Delgado, M. H. Thursby, and F. M. Ham, “A
and microwave devices,” IEEE Trans. Neural Netw. Learn. Syst. NN, vol. 16, no. 6, pp. 1590-1600, 2005.
[21] Z. Wang, S. Fang, Q. Wang, and H. Liu, “An ANN-based synthesis model for the single-feed circularly-polarized square microstrip antenna with truncated corners,” IEEE Trans. Neural Netw. Learn. Syst. NN, vol. 60, no. 12, pp. 5989-5992, 2012.
[22] T. Khan, A. De, and M. Uddin, “Prediction of slot-size and inserted air-gap for improving the performance of rectangular microstrip antennas using artificial neural networks,” IEEE Antennas Wireless Propag. Lett., vol. 12, pp. 1367-1371, 2013.
[23] E. Demircioglu, M. H. Sazlı, S. T. İmeci, and O. Sengul, “Soft computing techniques on multi-resonant antenna synthesis and analysis,” Microw. Opt. Technol. Lett., vol. 55, no. 11, pp. 2643-2648, 2013.
[24] L. Merad, F. T. Bendimerad, and S. M. Meriah, “Design and resonant frequency calculation of rectangular microstrip antennas,” Int. J. Numer. Model El, vol. 24, no. 2, pp. 144-153, 2011. [25] N. K. Saxena, M. Khan, P. K. S. Pourush, and N.
Kumar, “Neural network analysis of switchability of microstrip rectangular patch antenna printed on
ferrite material,” Int. J. RF Microw. Comput.-aided Eng., vol. 20, no. 1, pp. 1-5, 2010.
[26] R. F. Harrington, Field Computation by Moment Methods. IEEE Press, Piscataway, NJ, 1993. [27] N. T. Tokan and F. Gunes, “Support vector
charac-terization of the microstrip antennas based on measurements,” Prog. Electromagn. Res. B, vol. 5, pp. 49-61, 2008.
Ahmet Kayabasi was born in 1980. He received his B.S. and M.S. degrees in EEE from Selcuk University, Turkey, in 2001, 2005 respectively. In 2015, he received his Ph.D. degree in Electrical and Electronics Engineering from Mersin University, Turkey. From 2001 to 2015, he was a Lecturer in the Electronics and Automation Department of Selcuk University. He has been working as Assistant Professor in the Department of Electrical and Electronics Engineering at Karamanoglu Mehmetbey University. His current research interests include antennas, microstrip antennas, computational electromagnetic, artificial intelligent.