T.C.
BAHÇEŞEHİR ÜNİVERSİTESİ
CUSTOMER RETENTION VIA HYBRID MODELING
FOR BANKING INDUSTRY
Master Thesis
Emre AKARSU
i
T.C.
BAHÇEŞEHİR ÜNİVERSİTESİ
THE GRADUATE SCHOOL OF NATURAL AND APPLIED SCIENCES COMPUTER ENGINEERING
CUSTOMER RETENTION VIA HYBRID MODELING
FOR BANKING INDUSTRY
Master Thesis
Emre AKARSU
Supervisor: ASSOC. PROF. DR. Adem KARAHOCA
T.C
BAHÇEŞEHİR ÜNİVERSİTESİ
The Graduate School of Natural and Applied Sciences Program Name
Title of the Master’s Thesis : Customer retention via hybrid modeling for banking industry
Name/Last Name of the Student : EMRE AKARSU Date of Thesis Defense : 28/06/2010
The thesis has been approved by the Graduate School of Natural and Applied Sciences.
Signature
Asst. Prof. F. Tunç BOZBURA
Director
This is to certify that we have read this thesis and that we find it fully adequate in scope, quality and content, as a thesis for the degree of Master of Science.
Examining Committee Members:
Assoc. Prof. Dr. Adem Karahoca(Supervisor) : Asst. Prof. Dr. Yalçın Çekiç : Asst. Prof. Dr. Alper Tunga :
ii
ACKNOWLEDGEMENTS
I dedicate this thesis to my mother supported me in my whole my life. Without her persistent support it would not be possible. I also thank to my father.
I would like to express my gratitude to my supervisor Assoc. Prof. Dr. Adem KARAHOCA.
ABSTRACT
CUSTOMER RETENTION VIA HYBRID MODELING FOR BANKING INDUSTRY
Emre Akarsu
M.S. Department of Computer Engineering Supervisor: Assoc. Prof. Dr. Adem Karahoca
June 2010, 38 pages
Customer retention is one of the important tasks in customer relationship management. One integral part of retention is to detect the risk of the churning customers. Clustering is one of pattern discovery techniques in data mining. In this study, a novel hybrid modelling approach proposed to detect the churning customers Ant colony clustering technique is applied to detect churning customers. To remove irrelevant or redundant features from data set for clustering, Sequential Backward Search unsupervised feature selection technique is applied. Feature selection and clustering algorithms are incorporated as Wrapper approach.
For banking industry, a dataset which contains RFM and channel usage variables prepared in this study. The feature selection and clustering applied simultaneously. Both the feature selection and the clustering are completed in a single process. The results shows that, the accuracy of the FS-ACO clustering approach results are better than the filter approaches. Keywords: Wrapper, Ant colony clustering, Sequential Backward Search, Customer retention, customer churn modelling.
ÖZET
BANKACILIK ENDÜSTRİSİNDE MELEZ MODELLEME İLE MÜŞTERİYİ ELDE TUTMA.
Emre Akarsu
Yüksek Lisans, Bilgisayar Mühendisliği Bölümü Tez Yöneticisi: Doç. Dr. Adem Karahoca
Haziran 2010, 38 sayfa
Müşteriyi elde tutmak, müşteri ilişkileri yönetiminde önemli bir iştir. Müşteriyi elde tutmanın ayrılmaz parçalarından biri müşterinin kayıp riskini tespit etmektir. Kümeleme veri madenciliğindeki önemli örüntü tanıma tekniklerindendir. Bu çalışmada kaybolan müşterileri tespit etmek için, yeni bir melez modelleme yöntemi önerilmektedir. Ayrılan müşterilerin tespiti için Karınca Kolonisi kümeleme tekniği kullanıldı. Konu dışı ve gereksiz nitelikleri veri setinden çıkarmak için Geriye doğru sıralı araştırma denetimsiz nitelik seçme tekniği uygulanmıştır. Nitelik seçme ve kümeleme algoritmaları sargı yaklaşımıyla birleştirilmiştir. Bu çalışmada bankacılık endüstrisi için YSP ve kanal kulllanım değişkenlerini içeren bir veri seti hazırlandı. Nitelik seçme ve kümeleme işlemleri eş zamanlı olarak uygulandı. Hem nitelik seçme hem de kümeleme işlemleri tek bir süreçle tamamlandı. Sonuçlar nitelik seçmeli karınca kolonisi kümeleme yaklaşımının sonuçlarının doğruluğu süzme yaklaşımlarından daha iyi olduğunu göstermiştir.
Anahtar Kelimeler: Sargı, karınca kolonisi kümeleme, Sıralı geri araştırma, müşteri elde tutma, müşteri kayıp modeli.
iv
TABLE OF CONTENTS
ABSTRACT ... ii ÖZET ... iii TABLE OF CONTENTS ... iv LIST OF TABLES ... v LIST OF FIGURES ... viLIST OF ABBREVIATIONS ... viii
1. INTRODUCTION ... 1
1.1 PROBLEM DEFİNİTİON ... 1
1.2 BACKGROUND ... 2
1.2.1 Literature Survey ... 2
2. MATERIAL & METHODS ... 6
2.1 PREPARING CUSTOMER SEGMENTATION DATA SET ... 6
2.1.1 Data Dictionary ... 6
2.1.2 Data Pre-processing ... 8
2.1.3 Discretization ... 8
2.2 FEATURE SELECTING ACO CLUSTERING (FS-ACO CLUSTERING) ... 9
2.2.1 ACO For Clustering ... 9
2.2.2 SBS Algorithm ... 12
2.2.3 Feature Selecting Ant Colony Clustering ... 14
2.2.4 Unified Evaluation Criteria ... 14
3. FINDINGS ... 18
3.1 PARAMETER SETTINGS ... 18
3.2 TRAINING THE FS-ACO ALGORITHM ... 19
3.3 FS-ACO VS. WEKA COMPARISON ... 19
4. CONCLUSION AND FUTURE PLANS ... 62
v
LIST OF TABLES
Table 2.1: RFM Recency Variables ... 7
Table 2.2: RFM Monetary Variables ... 7
Table 2.3: Channel Usage Variables ... 8
Table 3.1: Parameters for one feature removal ... 19
Table 3.2: Cluster centroids and selected features for one feature removal ... 20
Table 3.3: Cluster distribution for one feature removal ... 21
Table 3.4: Parameters for three feature removal ... 22
Table 3.5: Cluster centroids and selected features for three feature removal ... 22
Table 3.6: Cluster distribution for one feature removal ... 23
Table 3.7: Parameters for five feature removal ... 24
Table 3.8: Cluster centroids and selected features for five feature removal ... 24
Table 3.9: Cluster distribution for five feature removal... 25
Table 3.10: Parameters for eight feature removal ... 26
Table 3.11: Cluster centroids and selected features for eight feature removal ... 26
Table 3.12: Cluster distribution for five feature removal... 27
Table 3.13: Parameters for eight feature removal ... 27
Table 3.14: Cluster centroids and selected features for eight feature removal ... 28
Table 3.15: Cluster distribution for eight feature removal ... 28
Table 3.16: Feature Ranking for Weka feature selection ... 28
vi
LIST OF FIGURES
Figure 1.1: Filter approach ... 4
Figure 1.2: Wrapper approach ... 5
Figure 2.1: Lifecycle of ants in ant colony clustering... 10
Figure 2.2: Feature selection ... 13
Figure 2.3: Sequential Search ... 13
Figure 2.4: FS-ACO Clustering ... 15
Figure 2.5: Flowchart of the FS-ACO clustering algorithm ... 17
Figure 3.1 Selected features vs. Iterations for 1 feature removal ... 23
Figure 3.2 Selected features vs. Iterations for 3 feature removal ... 25
vii
LIST OF ABBREVIATIONS
Ant Colony Optimization : ACO Sequential Backward Search : SBS Sequential Forward Search : SFS
Feature Selecting Ant Colony Optimization : FS-ACO Recency Frequency Monetary : RFM Sequential Floating Forward Search : SFFS Sequential Backward Search : SFBS Improved Forward Feature Selection : IFFS
1
1. INTRODUCTION
1.1 PROBLEM DEFINITION
Clustering is grouping objects into a number of clusters according to their similarities in multidimensional spaces. Clustering is one of the challenging and important unsupervised learning techniques. There are a lot of applications of clustering in disciplines such as network partitioning (Bortner & Jiawei 2010), partitioning social network usage via user’s patterns (Zhou, Fleischmann, & Wallace 2010), energy conservation on Ad-hoc wireless sensor networks (Nasim & Qaisar 2010), in microbiology to identify the genome expressions (Dost, Wu, Su, & Bafna 2010) in computer vision image segmentation (Agrawal, Grosky, & Fotouhi 2009) in pattern recognition to discover patterns (Correa-Morris, Espinosa-Isidrón, & Álvarez-N.adiozhin 2010). Lots of algorithms applied to the clustering problem domain. Mainly algorithms can be grouped into two categories; partitioning methods and hierarchical methods (Jain & Dubes 1988). Because of the importance of the clustering problem, many methods applied to the clustering problem (Rui & Wunsch 2005). Meta-heuristic approaches are also applied to clustering problem (Hruschka, Campello, Freitas & de Carvalho 2009). Genetic algorithms (Sheikh, Raghuwanshi, & Jaiswal 2008), simulated annealing (Hussain & Habib 2009), tabu search (El Rhazi & Pierre 2009). In this work, Ant Colony Optimization (ACO) is one of the global optimization techniques used for clustering objects into similar groups.
Training a learning algorithm under high dimensionality domain is both computationally expensive and inefficient due to irrelevant or redundant feature’s effect on empirical performance of the learning algorithm (Gheyas & Smith 2010). Also the probability of overfitting for the learning algorithm increases as the dimensionality of the training data set increase (Gheyas & Smith 2010). Irrelevant or redundant features decrease the accuracy of the learning algorithm which is also known as the curse of the dimensionality. In order to overcome these issues feature selection approach is applied. Feature search is a complex domain, as the number of the features grows the complexity
2
of the search space increases exponentially. For n features, every feature has the probability of being selected or not selected. So complexities of the feature search algorithms become 2n.
Feature search algorithms classified into three categories as Complete, Sequential and Random search methods with respect to Search strategy. Evaluation criteria based classification is done as Filter, Wrapper and Hybrid approaches. Feature search is used in both supervised and unsupervised learning.
In supervised learning area, feature selection problem is widely studied (Kohavi and John 1997). The problem of selecting features without the class labels is also studied. (Dy & Brodley 2004; Law et al., 2004; Mitra et al., 2002; Modha and Spangler, 2003) Unsupervised feature selection is grouped into Filter and wrapper approaches (Dy & Brodley 2004). Filters first select the features using an objective function independent from the learning algorithm then apply the clustering procedure. In wrappers, the feature selection is simultaneous with the clustering process. Wrappers make better performance of the clustering algorithm than the simple ranker methods (Dy & Brodley 2004).
Retaining the customers at hand is much more resource consuming than trying to win new customers. In order to retain the customers, analytical models have been developed by detecting the customers with the high probability to churn. Churn models are developed to detect the customers about to attrite and taking action about them (Zeng & Cheung 2009).
In this study, a wrapper ant colony clustering approach is proposed. This novel methodology is applied to the customer retention problem for segmentation of the customers according to their churn rate.
1.2 BACKGROUND
Several methods were applied to clustering problem. ACO clustering is applied to different clustering problems. Unsupervised feature selection is used as filter and wrapper approaches. The wrapper approaches for feature selection is more complicated.
3
In literature many methods are applied to customer retention or the other name customer churn. Clustering and hybrid approaches are the most common methods.
1.2.1 Literature Survey
Several techniques are proposed for ACO clustering. The first ACO clustering algorithm is designed by Deneubourg in 1991. His work was about clustering objects into clusters via real robots. The robots were moving, picking and dropping objects. The robots had the information of the objects they encountered in past. Based on this information, robots decide objects to pick up or drop.
This model was modified by Gutowitz (1993) via incorporating the complexity or entropy of the system to ant’s behaviour. By using the higher entropy to pick up and drop objects, they perform their task more efficiently than the basic ants.
These algorithms are modified by Lumer and Faieta (1994) to organization complex datasets. In this method, continuous similarity between objects is used as measure. The ant like agents uses the similarity measures for pick up and dropping operations.
Improvements to Lumer and Faieta’s system came from De Castro (2005). He proposed a progressive vision function to learn from previously visited neighbours to adapt the neighbour size to the clusters. And a cooling schedule parameter is defined for pick up operations to start after some parameter reaches a threshold. By modification to the pheromones dropping probability to drop similar object to similar locations increased. Recently Weili proposed an entropy based ACO clustering methodology (2009). Weili made improvements based on information entropy for pick up and drop operations. To balance the clustering speed, a linearly increasing ant perception radius parameter is added. Also short term memory which is proposed by Faieta is improved. to make decisions based on the fittest entropy neighbour positions searched iteratively. And a failure counter is added to prevent stagnation in the beginning which can be caused by extreme values in data. By this counter after some iteration to drop item, ant drops its items. Some criterion designed for parameter tuning.
4
Shelokar’s (2004) approach uses the Euclidian distance metric for measurement of clustering data objects. Ants use the previous information to update centralized global pheromone grid. Algorithm has the max iterations for stopping criterion.
Several studies are made for feature search in the literature. Sequential backward search (SBS) and sequential forward search are used. Sequential forward search starts from empty solution and adds the feature with the top criterion value to feature subset, search ends when no improvement is achieved by adding features (Cotter, Kreutz-Delgado & Rao 2001).
Search (SFS) works backward by eliminating the one feature at a time by maximizing the remaining subset’s fitness (Colak & Isik 2003). Also floating search methods proposed in order to improve the search efficiency of the SFS and BFS algorithms (Nakariyakul & Casasent 2009). He improved the SFS, BFS methods by adding backtracking ability to greedy search. Those methods are called Sequential Floating Forward Search (SFFS) and Sequential Backward Search (SFBS). Improvements are made to the SBBS and SFBS methods by adding a new step called “replacing the weak feature” to the search algorithm (Nakariyakul & Casasent 2009). They call their method as the Improved Forward Feature Selection (IFFS) [32].
Unsupervised learning is also a challenging area. Wrappers have often better accuracy and higher computational cost (Dy & Brodley 2004). Wrappers make the feature selection process independent from the learning method. Clustering algorithms incorporated with the feature search known as the clustering wrappers. Wrappers, which work independent of the clustering algorithm, can get better evaluation results when compared to filters (Kohavi & John 1997). In these methods, clustering algorithm learns from the selected features, feature selection assessed by some index term and feature evaluated by clustering error.
Filter Approach is on the other hand is not recurrent like the wrapper methods, outputs of the feature selection operation used directly in the clustering process as can be seen in Figure 1.1.
5
Figure.1.1 Filter approach
Wrappers and filters are two types of feature selection techniques. They use the feature search results as the input of the algorithm and evaluate the feature selection results via the learning algorithm. The process continues iteratively.
Figure.1.2 Wrapper approach
Wrapper methods have applications in the literature. Clustering process and the feature selection are made simultaneously Weiguo, Xiaohui and Fairhurst (2008) proposed a niching memetic algorithm for to make the clustering incorporated. In their approach, they used the memetic algorithm for the main learning algorithm to partition data. For the features search they incorporated SBS algorithm with their algorithm. Both the clustering algorithm and the feature search algorithm use the same criterion for evaluation of the quality of the solutions. They used the combined version of the scatter seperability. CRIT function is monotonically increases with respect to higher dimensions. To incorporate the clustering and the feature selection, Scatter seperability function is modified by using some penalty function.
6
Another wrapper approach was proposed by Li, Dong and Hua (2007). In Hua’s approach, feature selection is used locally with clustering algorithm. SBS algorithm was used to search for the irrelevant or redundant features. The evaluation function for both clustering and the feature search is the normalized version of scatter seperability criterion with penalty. Cross projection normalization was applied to the evaluation function (Broadley 2004).
Some of the unsupervised feature selection algorithms consider the distribution of the features (Chow, Wang, & Ma 2008).
Zeng and Cheung designed a feature selection algorithm for “Gaussian mixture clustering” (Zeng & Cheung 2009). To identify the relevant features for clustering they proposed a new relevance index. Relevance index does not need a priori knowledge on the distribution of the features. The clustering algorithm feature selection is incorporated as single methodology.
In order to reduce the dimensionality of the high dimension spaces (Handl 2006) used multi objective optimization method for feature selection. In their work they inspected two of the multi-objective for dimensionality reduction techniques with no class labels. Churn management models are studied in a lot of industries like telecommunication and banking (Owczarczuk, 2010). Several techniques were applied to the churn modelling (Hadden, Tiwari, Roy, Ruta 2005). A Hybrid neural network approach was proposed by (Yu-Hsin, & Tsai C. 2009). A back propagation artificial neural network and a Self organized Map combined to predict churn behaviour of the customers. The feature selection is by one of the learning algorithm and then results of the feature selection are used as inputs for the other algorithm.
Clustering approach is used for churn prediction (Xiao-bin., Feng. & Hui 2010). The clustering technique used in the study is Fuzzy C-means algorithm in order to determine the greater valued customers. And then SAS is used for prediction model for churn.
7
2. MATERIAL & METHODS
2.1 PREPARING CUSTOMER SEGMENTATION DATA SET
The data used in this study is from a private Turkish banking company. Data preparation process involves data cleansing via replacing missing values, statistical analysis, categorization of discrete values and converting the numerical attributes to nominal attributes. Numerical valued attributes are discretized for algorithm. The final data set consist of nominal attributes
In order to identify the customer’s churn behaviour Most of the customer profiling studies uses recency, frequency and monetary value RFM variables in customer churn prediction and customer behavioural segmentation (Chen, Kuo, Wu, & Tang 2009). 2.1.1 Data Dictionary
Recency, Frequency, Monetary (RFM) variables are frequently issued variables in studies. To identify the customer patterns using the purchase data is a commonly used technique. Recency, frequency, and monetary values are used to detect the sequential patterns of the customers (Chen, Kuo, Wu, Tang 2009).
The recency of the variables contains information about the last activity or transaction of the customer in the given product/product category. These variables give us information about if a customer has high activity patterns about some certain products. These variables may be interrelated with each other and give us hints about the customer’s patterns. The monetary values hold the information of a customer’s balance information, transactional amounts or the current balances over some time window. RFM variables are constructed using the historical data in the company.
8
Table 2.1 RFM Recency Variables
RFM TYPE COLUMN_NAME DATA TYPE DISTINCT VALUES recency prd_rec1 NOMINAL {F,T}
recency prd_rec2 NOMINAL {F,T}
recency prd_rec3 NOMINAL {F,T}
recency prd_rec4 NOMINAL {F,T}
recency prd_rec5 NOMINAL {F,T}
recency prd_rec6 NOMINAL {F,T}
recency prd_rec7 NOMINAL {F,T}
recency prd_rec8 NOMINAL {F,T}
recency prd_rec9 NOMINAL {F,T}
recency prd_rec10 NOMINAL {F,T}
recency prd_rec11 NOMINAL {F,T}
Table 2.2 RFM Monetary Variables
RFM TYPE COLUMN_NAME DATA TYPE DISTINCT VALUES monetary prd1_debt ORDINAL {L,H}
monetary prd2_debt ORDINAL {L,H}
monetary prd1_amt ORDINAL {L,H}
monetary prd2_amt ORDINAL {L,H}
monetary prd3_amt ORDINAL {L,H}
monetary prd5_amt ORDINAL {L,H}
monetary prdtot_amt ORDINAL {0,L,H}
monetary prdtot_debt ORDINAL {L,H}
monetary prdtot2_amt ORDINAL {0,L,H}
recency rltnship_length NOMINAL {}
The channels are the customer’s way of keep in touch with the company. Customers interact the bank using channels. Three channel’s usage activities are given with the following dataset. A channel has two subcategories which are given by ch_2_1_usage and ch_2_2_usage.
9 Table 2.3 Channel Usage Variables
COLUMN_NAME DATA TYPE DISTINCT VALUES ch1_usage NOMINAL {F,T}
ch2_1_usage NOMINAL {F,T}
ch2_usage NOMINAL {F,T}
ch3_usage NOMINAL {F,T}
ch2_2_usage NOMINAL {F,T}
Demographics variables are also used in literature to indentify customer activities. Churn Because of low quality of demographic variables in data set, these variables are not used.
2.1.2 Data Pre-Processing
While constructing the dimensions of the dataset, data cleansing is performed in order to have a better accuracy in algorithms. Missing values of the numerical attributes are replaced with appropriate numbers and in categorical variables are labelled. Then distributions of the attributes are checked.
After analyzing data, some dominants and obvious patterns are removed from data set. These patterns are simple and have a high frequency. They can be easily tracked without segmentation process. Remaining data is randomly sampled to construct a feature set for customer segmentation.
2.1.3 Discretization
Discretization is referred the process of transferring continuous features into discrete parts. It reduces the dimensionality of the data and saves us from the computational complexity burden.
Histograms for each attribute are observed. According to the distribution of the data the splitting points are determined. The intervals between the splitting points are labelled as the bins. The final set consists of the labelled bins of the attributes.
10
In this study, ACO clustering technique based on Shelokar’s methodology is proposed. This method modified by incorporating feature selection into clustering algorithm. 2.2.1 ACO For Clustering
Problem is partitioning N objects into K clusters such that the distances of the objects are minimized. R agents are used to construct solutions. N is the size of the sample set. S is a solution set consisting of the assigned clusters of the samples.
τ The pheromone concentration matrix which has NxK dimensions.
j i,
τ This is pheromone concentration of the i’th sample and j’th cluster. The pheromone trail matrix is initialized to some valueτ0.
The solution construction process is the Ant’s picking up behaviour (Dorigo, 2004). Ants pick up objects based on the trail pheromone matrix. More pheromone deposited on object makes them more attractable for ants to pick up. The picking up probability of ants is based on the ratio of pheromone concentration of the candidate objects to the total pheromone deposition on each cluster which is the normalized probability of objects belonging to cluster.
K 1.. = j , 1 , , ,
∑
= = k i ik j i j i p τ τ (1) (2.1)The agents used the pheromone trail info to construct solutions. The pheromone trail info is updated like an adaptive memory. After each agent constructs their solutions, a local search is to get better solutions using the fitness values. After the local search the solutions with the top fitness value is used for pheromone update. The solutions update the pheromone trail information proportional to their fitness degree.
11
Figure 2.1 Lifecycle of ants in ant colony clustering
The solution construction phase, two types of processes applied. Exploration and exploitation processes balance the robustness of the search (Marco 2004).
0
q : is a predefined constant pheromone concentration. 0< q0 <1 q parameter 0
determines the balance between exploration and exploitation. When generating a solution, a random number is chosen, if the number is smaller than q then the next 0
object is picked up based on the pheromone concentration using the pi,j in equation 2.1 otherwise one of the K clusters selected randomly.
Let {x1,x1,..,xN}be as set of objects in dataset. :
,v
i
x is the value of the i’th sample of the v’th attribute. :
, j
i
w if i’th object is in cluster j then value is set to 1 , otherwise 0.
K j
N
12
Wij is the cluster membership it holds the value if the i’th sample of j’th cluster is belonged to the cluster then the value is set to 0 and 1 otherwise. Wij has NxK dimensions.
Since, in this study nominal attributes will be used mi, j :formulation in Shehlokar’s method is modified. Instead of using means of the numerical attributes, mode of the elements is used.
: , j
i
m
is the mode of the values in the i’th cluster’s j’th attribute.
The distance metric used in this study is different from the Shelokar’s method; instead of Euclidian distance we used Manhattan distance for similarity measurements between objects. The Manhattan distance is described as:
v j v i m x, − , (2.2) The objective of the clustering algorithm is the within cluster similarity which is known as the Scatter seperability criterion (Fukunaga 1990). The fitness of the solutions is calculated by the Equation 2 above. It is the sum of the Manhattan distance between objects and the cluster centroids.
Min F (w, m)=
∑ ∑ ∑
Kj=1 iN=1 vn=1wi,j xi,v −mj,v(2.3)
Second step of the algorithm is the local search procedure to select the top fitness value solutions. Not all of the solutions are selected for local search. In Shelokar’s study the top %20 percent of the solutions are used for local search. L top quality solutions are selected for local search arranged from smaller to greater values.
13 :
ls
p is a constant number between 0 and 1 to determine the local search
probability.
After selecting the top fitness value solutions, local search procedure is applied. Number of L new solutions is generated. For each element in the candidate solution, a random number is taken and if the random number is smaller than the local search threshold the cluster assigned of the i’th sample is changed otherwise remains the same. By this way stochastically the solution elements are searched. For every item in the candidate solution this procedure is applied. After completing the replacement of objects in the solution the fitness value of the solution is computed. If the fitness value is greater than the original solution then the candidate solution is replaced with the original one.
The third step of the ant lifecycle is the pheromone update process. After performing the local search and replacing the better fitness valued solutions, the pheromone updates implemented using these solutions. The fittest solutions affect the pheromone trail matrix. L solutions are used to update pheromone trail matrix using the following pheromone updating formulation:
l j i L l j i j i, (t 1) (1 p)τ , (t) 1 τ , τ + = − +
∑
= ∆ (4) (2.4) K j N i=1,.., , =1,.., :p in this equation is the pheromone evaporation rate.
When pheromone evaporation parameter increases in exploration of new solutions becomes slowly, and if the evaporation parameter decreases it leads to forget the suboptimal solutions (Dorigo 2004 p.20).
: , l j i τ
∆ is the amount of pheromone to deposit on the pheromone trail matrix. Since our objective is to minimize F the deposition amount is determined byl 1/Fl.
14 2.2.2 SBS Algorithm
Sequential backward search is a greedy search heuristic algorithm which is used for feature selection in supervised learning (Dy & Brodley 2004). Sequential backward selection starts the solution with full feature set and removes the feature with the worst fitness value from the feature subset. The search ends when no improvements can be done to the current feature set.
→ − iM i i selection feature N x x x x x x 2 1 2 1 . .
Figure 2.2 Feature selection
The algorithm starts with the full feature set. The function F is the evaluation function used for the learning algorithm. First the full feature set is given as input to the learini algoirthm and the results obtained. Then at each step one feature is removed, and after the remove operation the evaluation criterion is used to get the fitness value of the given subset. Among the solutions with one feature removed, the highest fitness value (under the assumption of the evaluaton function is monotonically increasing) is choosen. In the next iteration another feature is removed and the same process is repeated untill reaching the stopping criterion. Stopping criterion may be a priori to select the minimum subset of features or the search stops when no improvements can be achieved.
15
Figure 2.3 Sequential Search
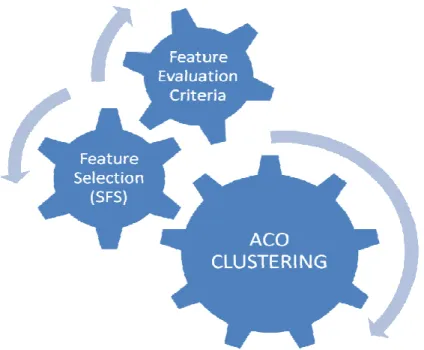
2.2.3 Feature Selecting Ant Colony Clustering (FS-ACO Clustering):
Wrapper apprach constitues from 3 integral parts. First one is the Feature Search
algoirithm which is the SBS algoirthm in this study. The second part is the unsupervised learining algorithm which is the ACO clustering explained in the previous section. The final and the integral part of the algorithm is the evaluation function. There are different types of implementations for evaluation function in the literature. In our approach, the unified criterion approach is used.
2.2.4 Unified Evaluation Criteria
In e Wrapper approach the feature selection and clustering processes become integrated. The feature search process and the clustering algorithm needs evaluation function. In this study, the same evaluation function will be used for clustering and the feature selection. Scatter seperability index (Dy & Brodley 2004), will be used for clustering and feature search as unified criterion.
16
Sw is used for the within cluster object distances. İt measures how objects are scattered from the cluster center.
Sb is used for the intra cluster distance. It indicates the distance of the cluster centers from the sample mod. The Manhattan distances are used.
∑∑
= = − = k j N i j i ij w w x m S 1 1 (2.5) = ijm mode of the i’th attribute’s mode value in the cluster j.
∑
= − = k i j ij b w m M S 1 0 (2.6)M0 is the mode of the sample.
∑
= = k j j ijm w M 1 0 (2.7)The scatter seperability index is : ) ( 1 b w S S trace − (2.8) This index monotonically increases as the number of attributes increases. This function is not apropriate for feature selection. To be able to compare the fitness values of different feature sizes, a penalty term is used. Modified fitness function is:
) 1 /( ) 1 ( * ) (S−1S D−d + D− trace w b
D: is the number of attributes
17
Figure 2.4 FS-ACO Clustering
Evaluation functions in clustering can be the distance of the objects to the centroid of the belonging clusters.
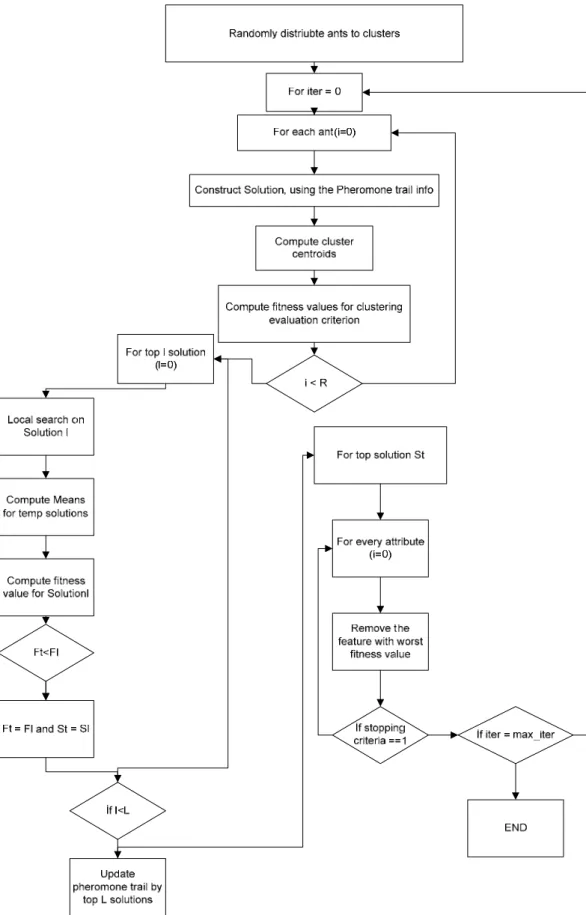
The FS-ACO clustering algorithm in this study is designed for the nominal attributes. First the nominal attributes are read from a file in comma separated format. Then the attributes are converted into binary variables in order to reduce the computational overhead of the algorithm.
Each agent starts to build a solution. For initialization each ant randomly picks a cluster, the centroids of the clusters are computed and the evaluation criterion is firstly invoked to determine the performance of the iteration. After the agents construct their solution and the results of the computation are done via evaluation function, the top %l of the solutions is selected for local search operation. After the local search if the new generated solution is better than the older one then new solution is replaced with the old one. The pheromone matrix is updated with only the top %l of the solutions. Then the sequential backward search procedure is invoked on the top solution. One feature is removed and performance of the solution is evaluated via evaluation function in iterations. Then if an improvement to the solution is done, the feature which’s removal
18
contributes the solution most is extracted from the solution. The process iterates until reaching the stopping criteria. Removal process stops when no further improvement can be assessed or the minimum number of the features is reached.
19
20
3. FINDINGS
The results of this study are explained in this section. The proposed FS-ACO clustering method’s performance evaluations on datasets are given.
The proposed methods first part is the discretiazion of the dataset. The features on the dataset are converted into binned entities. Numerical values are converted into nominal attributes according to their distribution.
3.1 PARAMETER SETTINGS
FS-ACO clustering algorithm is designed to have some parameters to be able to tune the learning process. It requires human intervention to tune the parameters of the algorithm. First the pheromone evaporation rate which makes the balance between exploration and the exploitation is set to 0.01 as Dorigo used in his book (Dorigo 2004).
The pheromone priori parameter is set to 0.1 which determines the ant to pick up the object with highest pheromone or another object. So the solution does not get stuck to local minimum. If the parameter is small then solution may stuck to local optimum and if the parameter increases the solution may not converge.
The local search threshold parameter is used to determine the percentage of the samples in the solution to apply local search. The fittest solution values are used for pheromone update process. If the number of the fittest solutions to update the pheromone trail matrix is too high, it becomes difficult for FS-ACO algorithm to converge global solution.
Different local search parameter settings applied in trainings. Developed FS-ACO clustering tool is used in this study.
Stopping criteria of the FS-ACO clustering algorithm is determines as the maximum number of iterations.
The number of agents affects the convergence of the solution. As the number of the agent increases the algorithm converges faster. But if the number of the agents increases
21
too much then although the convergence speed increases, the propensity of converging to global minimum decreases. As the number of feature to remove increases, to make the learning algorithm more stable the number of agents is increased.
Minimum number of features the algorithm can select also determined by a parameter. 3.2 TRAINING THE FS-ACO ALGORITHM
Parameters of the algorithm are optimized for the following experiments.
The training data which is described in previous sections, sampled in order to reduce the computational complexity and training time. 280 samples are selected for training of the FS-ACO clustering algorithm. After the sampling some variables become highly skewed, firstly the variables with highly skewed distribution are removed. Totally 20 features are selected for the initial training of data.
As the data set grows there has been a centroid overlap problem which caused the fitness function to become zero and make it to local 0. This problem is solved by adding the term 1 to the fitness function.
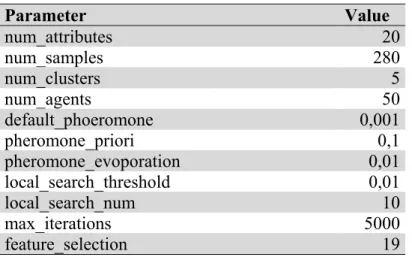
In the first experiment, FS-ACO clustering algorithm removes 1 of the attributes from the training set. Parameters setting for this experiment are given below.
Table 3.1 Parameters for one feature removal
Parameter Value num_attributes 20 num_samples 280 num_clusters 5 num_agents 50 default_phoeromone 0,001 pheromone_priori 0,1 pheromone_evoporation 0,01 local_search_threshold 0,01 local_search_num 10 max_iterations 5000 feature_selection 19
22
reaching the maximum number of iterations. The maximum number of iterations is given high, in order to reduce the probability of premature convergence.
Centroids of the clusters are given in the following table:
Table 3.2 Cluster centroids and selected features for one feature removal cluster 0 cluster 1 cluster 2 cluster 3 cluster 4 Selected
CH1_USAGE F F F F F 1 CH2_1_USAGE T T F T F 1 CH2_USAGE F F T T F 1 PRD_REC1 F F F F F 1 PRD_REC2 F F F F F 1 PRD_REC3 F F F T T 1 PRD_REC5 F F F F F 1 PRD_REC8 F F F F T 1 PRD_REC9 F F T T T 1 PRD_REC10 F F F F F 1 PRD_REC11 F F F T F 1 PRD2_DEBT H L 0.0 H 0.0 0 PRD3_AMT H 0.0 0.0 0.0 0.0 1 PRDTOT_AMT 0.0 0.0 L H H 1 PRDTOT2_AMT 0.0 0.0 L H H 1 PRD1_AMT 0.0 0.0 L H H 1 PRDTOT_DEBT F F F F F 1 PRD1_DEBT F F F F F 1 PRD2_AMT F F F T T 1 PRD5_AMT F F F F T 1
Centroids give us about the characteristics of the customer profiles.
Cluster 0 is a single product and single channel using customer profile, but having some large amount on single product.
Cluster 1 is also a single product user group, but it has a lower amount saving tendency in the product.
Cluster 2 profile customers use different channel and has more product penetration in total. They have low amount of money in those products.
23
products, and use all channels. Their quantity of money in the products is also high in all categories.
Cluster 4 profile customer has a high product penetration. Their selection of products is different from the Cluster 3 profile. But they also keep large amount of money in those products.
The sizes of the clusters are given below. It can be told that the frequency of the clusters about evenly distributed.
Table 3.3 Cluster distribution for one feature removal
Clusters Frequency Cluster 0 percent 64 (%22.85) Cluster 1 percent 45 (%16.07) Cluster 2 percent 86 (%30.71) Cluster 3 percent 36 (%12.85) Cluster 4 percent 49 (%17.5)
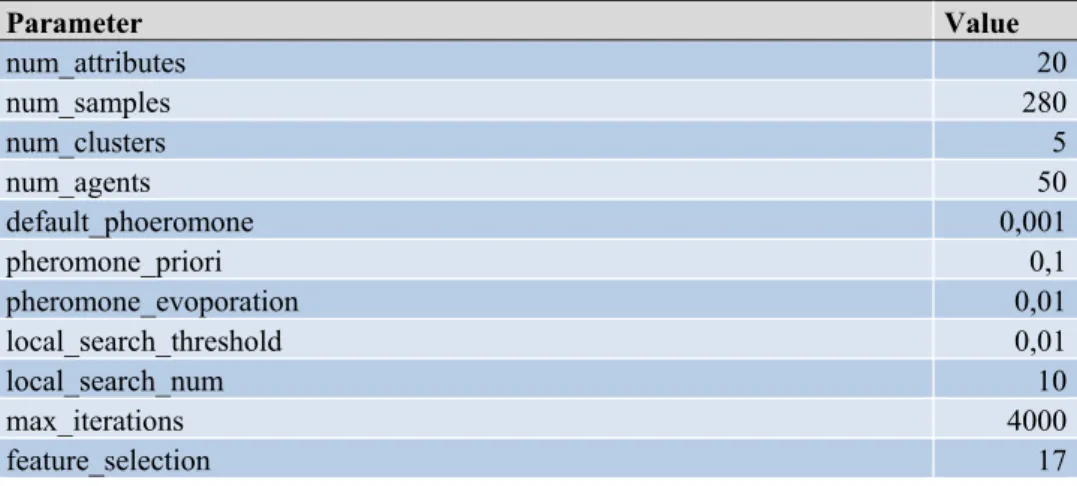
In the second experiment, 3 features are chosen to be removed from the feature set. The parameter setting for this experiment is given below table.
Table 3.4 Parameters for three feature removal
Parameter Value num_attributes 20 num_samples 280 num_clusters 5 num_agents 50 default_phoeromone 0,001 pheromone_priori 0,1 pheromone_evoporation 0,01 local_search_threshold 0,01 local_search_num 10 max_iterations 4000 feature_selection 17
24
The following table shows the centroids of the clusters and the features selected in this instance.
Table 3.5 Cluster centroids and selected features for three feature removal ATTRIBUTE cluster 0 cluster 1 cluster 2 cluster 3 cluster 4 Selected
CH1_USAGE F F F F F 1 CH2_1_USAGE T F T T T 1 CH2_USAGE F F F T T 0 PRD_REC1 F F F F F 1 PRD_REC2 F F F F F 1 PRD_REC3 T F F F F 1 PRD_REC5 F F F F F 1 PRD_REC8 F F F F F 1 PRD_REC9 T T F F F 1 PRD_REC10 F F F F F 1 PRD_REC11 F F F F F 1 PRD2_DEBT 0.0 0.0 L H H 0 PRD3_AMT 0.0 0.0 0.0 H H 0 PRDTOT_AMT H L 0.0 0.0 0.0 1 PRDTOT2_AMT H L 0.0 0.0 0.0 1 PRD1_AMT H L 0.0 0.0 0.0 1 PRDTOT_DEBT F F F F F 1 PRD1_DEBT F F F F F 1 PRD2_AMT T F F F F 1 PRD5_AMT F F F F F 1
25
The following graphics gives us insights about the FS-ACO clustering algorithm’s wrapper characteristics. The x axis is the features in range [0-20], y-axis is the number of iterations and the z axis shows us if the feature selected or not with Boolean values (0,1).
It can be seen that in the first iterations the 10, 13, 15 indexed features were selected. As the training continues and different feature sets become the optimal feature set. The feature set also gives directions to the optimality of the solution.
Figure 3.1 Selected features vs. Iterations for 1 feature removal The following table shows the frequency of the clusters computed.
26
Table 3.6 Cluster distribution for one feature removal
Cluster Frequency Cluster 0 percent 81 (%28.92) Cluster 1 percent 88 (%31.42) Cluster 2 percent 52 (%18.57) Cluster 3 percent 25 (%8.92) Cluster 4 percent 34 (%12.14)
In the third experiment, the number of features to remove is set to 5. As the number of features to be removed increases the problem gets more complicated, because of the possibilities of probable combination of the features. So the maximum number of iterations parameter is increased.
Table 3.7 Parameters for five feature removal
Parameter Value num_attributes 20 num_samples 280 num_clusters 5 num_agents 50 default_phoeromone 0,001 pheromone_priori 0,1 pheromone_evoporation 0,01 local_search_threshold 0,01 local_search_num 10 max_iterations 6000 feature_selection 15
27
The following table shows the centroids of the clusters and the features selected in this instance.
Table 3.8 Cluster centroids and selected features for five feature removal ATTRIBUTE cluster 0 cluster 1 cluster 2 cluster 3 cluster 4 Selected
CH1_USAGE F F F F F 1 CH2_1_USAGE T T F T T 1 CH2_USAGE F F F T T 1 PRD_REC1 F F F F F 1 PRD_REC2 F F F F F 1 PRD_REC3 F F T F F 1 PRD_REC5 F F F F F 1 PRD_REC8 F F F F F 1 PRD_REC9 F T T F F 1 PRD_REC10 F F F F F 1 PRD_REC11 F F F F F 1 PRD2_DEBT L H 0.0 M H 0 PRD3_AMT 0.0 L 0.0 H H 0 PRDTOT_AMT 0.0 L H 0.0 0.0 0 PRDTOT2_AMT 0.0 L L 0.0 0.0 0 PRD1_AMT 0.0 L L 0.0 0.0 0 PRDTOT_DEBT F F F F F 1 PRD1_DEBT F F F F F 1 PRD2_AMT F F T F F 1 PRD5_AMT F F F F F 1
28
The following figure shows the change of the selected feature set as the iterations goes.
Figure 3.2 Selected features vs. Iterations for 3 feature removal The following table shows the frequency of the clusters computed.
Table 3.9 Cluster distribution for five feature removal
Cluster Frequency Cluster 0 percent 69 (%24.64) Cluster 1 percent 26 (%9.28) Cluster 2 percent 113 (%40.35) Cluster 3 percent 41 (%14.64) Cluster 4 percent 31 (%11.07)
29
In the fourth experiment, 7 features are chosen to be removed from the feature set. The maximum number of iterations held 6000 to comprehend the difficulty of the combinatorial complexity of feature space. The parameter setting for this experiment is given below table
Table 3.10 Parameters for eight feature removal
Parameter Value num_attributes 20 num_samples 280 num_clusters 5 num_agents 50 default_phoeromone 0,001 pheromone_priori 0,1 pheromone_evoporation 0,01 local_search_threshold 0,01 local_search_num 10 max_iterations 6000 feature_selection 13
30
The following table shows the centroids of the clusters and the features selected in this instance.
Table 3.11 Cluster centroids and selected features for eight feature removal ATTRIBUTE cluster 0 cluster 1 cluster 2 cluster 3 cluster 4 Selected
CH1_USAGE F F F F F 1 PRD_REC1 F F F F F 1 PRD_REC10 F F F F F 1 PRD_REC11 F F F F F 1 PRD_REC2 F F F F F 1 PRD_REC3 F F F T F 1 PRD_REC8 F F F F F 1 PRD_REC9 F T T T F 1 PRD1_DEBT F F F F F 1 PRD5_AMT F F F F F 1 PRDTOT_AMT 0.0 L L H 0.0 1 PRDTOT_DEBT F F F F F 1 PRDTOT2_AMT 0.0 L L H 0.0 1 CH2_1_USAGE T T F T T 0 CH2_USAGE F F T F F 0 PRD_REC5 F F F F F 0 PRD1_AMT 0.0 L L H 0.0 0 PRD2_AMT F F F T F 0 PRD2_DEBT L M 0.0 0.0 H 0 PRD3_AMT 0.0 0.0 0.0 0.0 H 0
31
The following table shows the frequency of the clusters computed. Table 3.12 Cluster distribution for five feature removal
Cluster Frequency Cluster 0 percent 54 (%19.28) Cluster 1 percent 22 (%7.85) Cluster 2 percent 84 (%3) Cluster 3 percent 66 (%23.57) Cluster 4 percent 54 (%19.28)
In the fifth experiment, the number of features to remove is set to 9. As the number of features to be removed increases the problem gets more complicated, because of the possibilities of probable combination of the features. The number of agents is increased to 70.
Table 3.13 Parameters for eight feature removal
Parameter Value num_attributes 20 num_samples 280 num_clusters 5 num_agents 70 default_phoeromone 0,001 pheromone_priori 0,1 pheromone_evoporation 0,01 local_search_threshold 0,01 local_search_num 14 max_iterations 4000 feature_selection 11
32
The following table shows the centroids of the clusters and the features selected in this instance.
Table 3.14 Cluster centroids and selected features for eight feature removal ATTRIBUTE cluster 0 cluster 1 cluster 2 cluster 3 cluster 4 Selected
CH1_USAGE F F F F F 1 PRD_REC1 F F F F F 1 PRD_REC2 F F F F F 1 PRD_REC3 F F F T T 1 PRD_REC5 T F F F F 1 PRD_REC8 F F F T F 1 PRD_REC9 T T F T T 1 PRDTOT_AMT L L 0.0 H H 1 PRD1_DEBT F F F F F 1 PRD2_AMT F F F T T 1 PRD5_AMT F F F T F 1 CH2_1_USAGE T T T T T 0 CH2_USAGE T F F F T 0 PRD_REC10 F F F F F 0 PRD_REC11 F F F F F 0 PRD2_DEBT 0.0 0.0 L 0.0 0.0 0 PRD3_AMT 0.0 0.0 0.0 0.0 0.0 0 PRDTOT2_AMT L L 0.0 H H 0 PRD1_AMT L L 0.0 H H 0 PRDTOT_DEBT F F F F F 0
The following table shows the frequency of the clusters computed.
Table 3.15 Cluster distribution for eight feature removal
Cluster Frequency Cluster 0 percent 52 (%18.57) Cluster 1 percent 42 (%15) Cluster 2 percent 105 (%37.5) Cluster 3 percent 34 (%12.14) Cluster 4 percent 47 %16.78)
33
3.3 FS-ACO CLUSTERING VS. WEKA COMPARISON:
In order to compare the wrapper method with filter methods, K-means algorithm is used. To be able to select the features, full dataset is clustered via k-means then algorithm. With the labels of the clustering attribute selection is applied to the data set. To accomplish this task, Weka information gain feature selection is used. The results of the feature ranking are given below.
Table 3.16 Feature Ranking for Weka feature selection ATTRIBUTE RANK PRDTOT2_AMT 1.03 PRD1_AMT 0.9634 PRDTOT_AMT 0.9469 PRD_REC9 0.7686 PRD2_DEBT 0.4788 CH2_USAGE 0.4426 PRD_REC5 0.4323 PRD2_AMT 0.3719 PRD_REC3 0.37 PRD3_AMT 0.3363 PRD_REC8 0.2329 PRD5_AMT 0.2329 CH2_1_USAGE 0.2283 PRD_REC10 0.1064 PRDTOT_DEBT 0.0648 PRD_REC11 0.0487 PRD_REC1 0.0469 PRD1_DEBT 0.0439 PRD_REC2 0.0439 CH1_USAGE 0.0392
34
To compare the results of the Weka clustering and the FS-ACO clustering algorithms, same number of attributes are removed. The cluster frequency distributions of the Weka clustering results are given below.
Table 3.17 Cluster distribution for Weka clustering
# Of Attributes 19 17 15 13 11 Sum Error 793 745 682 612 491 Cluster 0 percent 74 ( 26%) 74 ( 26%) 74 ( 26%) 74 ( 26%) 74 ( 26%) Cluster 1 percent 48 ( 17%) 48 ( 17%) 48 ( 17%) 48 ( 17%) 44 ( 16%) Cluster 2 percent 53 ( 19%) 53 ( 19%) 53 ( 19%) 53 ( 19%) 70 ( 25%) Cluster 3 percent 61 ( 22%) 61 ( 22%) 61 ( 22%) 61 ( 22%) 62 ( 22%) Cluster 4 percent 44 ( 16%) 44 ( 16%) 44 ( 16%) 44 ( 16%) 30 ( 11%)
35
This graphics illustrates the sum of the error as the number of the removed features increases. Sum of error, which is the Manhattan distance between the objects and the centroids of the clusters, tends to reduce as the number of features decreaes. FS-ACO feature selecting clustering algorithm outperforms Weka with information gain attribute selection.
36
4. CONCLUSION AND FUTURE PLANS
Clustering is a widely studied and complex problem in the literature of data mining. Clustering techniques are applied to many different domains. Lots of techniques are applied to determine the optimal partitioning of a data set. Meta-heuristic and local search techniques are used for clustering.
Unsupervised feature selection is relatively less studied field according to clustering problem. For each feature to be selected of not selected, the feature space becomes 2d complexity. Filter and Wrapper approaches are two categories of unsupervised feature selection. Wrapper methods have better accuracy, but come with the burden of computational complexity.
In this study, ACO clustering wrapping feature selection method is proposed. Algorithm designed using the stochastic nature of the ACO algorithm for clustering problem and combining it with the SBS methods for feature selection. Feature selection and the clustering algorithm are incorporated as wrapper. ACO method used in this study based on the Shelokar’s Ant Colony Clustering model. Nominal attributes are used in this study so the distance metric for clustering is chosen as the Manhattan distance. Also in place of the mean of the features mods are used. The original algorithm’s fitness function is improved by applying the CRIT criterion.
The novelty in this research is the incorporation of ACO clustering algorithm and the SBS method. There were no studies using ACO and SBS wrapper approach before. In order to simultaneously select the features and partitioning the data items, the fittest solution is used. First iteration of the ACO clustering algorithm is done and then SBS algorithm is applied. The next iteration is generated using the selected features.
This technique is used for the customer retention to determine the churn behaviour of the customers. Firstly the attributes of the data set are binned to convert the numerical entities into nominal entities according to their distribution. Then data is sampled into 280 items. This data set is used for the proposed FS-ACO clustering and feature selection process. The results of the clustering algorithm give us information about the
37 characteristics of the customers.
Finally to compare the results of the FS-ACO clustering algorithm, a filter approach is used. The data set with full feature set is clustered. The class labels are used for information gain ranking algorithm in Weka. Attributes are removed according to their ranks in the algorithm.
Finally the FS-ACO clustering algorithm and the information gain feature selecting K-means algorithm’s error rates are compared. FS-ACO algorithm outperformed K-K-means algorithm in sum of the squared errors and the selected feature set quality.
FS-ACO clustering algorithm can be improved by adding a meta-heuristic algorithm for feature selection such as genetic search, ACO or tabu search etc. Clustering algorithm can be modified to take mixed values (numerical, ordinal etc.). Also some improvements can be done to reduce the runtime of the algorithm. FS-ACO clustering algorithm can be parallelised based on the agents using an data structure appropriate for shared memory usage. The most complex part of the algorithm is the fitness value computation, To reduce the cost of computing fitness values a caching data structure can be used.
38
REFERENCES
Agrawal R., Grosky W.I., & Fotouhi, F., 2009 Searching an Appropriate Template Size
for Multimodal Image Clustering. Multimedia Computing and Systems, ICMCS '09. 2-4
April 2009 Ouarzazate, pp. 560 – 564
Bortner, D., & Han J., 2010 Progressive clustering of networks using
Structure-Connected Order of Traversal Data Engineering (ICDE), IEEE 26th International
Conference, 15 April 2010 Long Beach, CA pp. 653 - 656
Chen Y.L., Kuo M.H., Wu S.Y., & Tang K., Discovering recency, frequency, and
monetary (RFM) sequential patterns from customers’ purchasing data. Electronic
Commerce Research and Applications, Vol.8, Issue 5, October 2009, pp. 241-251 Chow, T.W.S., Wang P., & Ma E.W.M., A New Feature Selection Scheme Using a Data
Distribution Factor for Unsupervised Nominal Data. Systems, Man, and Cybernetics,
Part B: Cybernetics, IEEE Transactions Vol.38, Issue 2, 2008, pp. 499 – 509
Colak S., & Isik C. Feature subset selection for blood pressure classification using
orthogonal forward selection. Proceedings of 2003 IEEE 29’th Annual Bioengineering
Conference. 22–23 March 2003, pp.122–123.
Correa-Morris J., Espinosa-Isidrón D., & Álvarez-N.adiozhin D., An incremental nested
partition method for data clustering. Pattern Recognition, Vol.43, Issue 7, July 2010,
pp. 2439-2455
Cotter S.F., Kreutz-Delgado K., & Rao B.D. Backward sequential elimination for
sparse vector selection. Signal Processing 81 (2001). pp. 1849–1864.
Deneubourg J.L., Gross S., Franks N. R., Sendova-Franks A., Detrain C., & Chretien L.,
The dynamics of collective sorting: Robot-like ants and ant-like robots. Simulation of
Adaptative Behavior: From Animals to Animats, pp.356-363, 1991.
Dost B., Wu C., Su A. & Bafna V., 2010. TCLUST: A fast method for clustering
genome-scale expression data. IEEE TRANSACTIONS ON COMPUTATIONAL
39
http://ieeexplore.ieee.org/stamp/stamp.jsp?tp=&arnumber=5467032
Dy J., & Brodley C. Feature Selection for Unsupervised Learning. Journal of Machine Learning Research(2004) pp. 845–889
El Rhazi A., Pierre S., A Tabu Search Algorithm for Cluster Building in Wireless Sensor
Networks. Mobile Computing, IEEE Transactions Vol.8, Issue 4, 2009, pp. 433 – 444
Fukunaga K. Statistical Pattern Recognition. Academic Press, 1990.
Gheyas I. A., & Smith L. S. Feature subset selection in large dimensionality domains. Pattern Recognition, Vol.43, Issue 1, January 2010, pp. 5-13
Gutowitz H. Complexity-seeking ants. In Proc of the Third European Conference on Artificial Life, 1993.
Hadden J., Tiwari A., Roy R., & Ruta D., Computer assisted customer churn
management: State-of-the-art and future trends. 2005 Computers & Operations
Research v34(10) October 2007, pp. 2902-2917.
Handl J., & Joshua K., Feature Subset Selection in Unsupervised Learning via Multiobjective Optimization 2006, International Journal of Computational Intelligence Research. Vol.2, No.3, pp. 217–238
Hruschka, E.R., Campello, R.J.G.B., Freitas A.A., & de Carvalho A.C.P.L.F., 2009 A
Survey of Evolutionary Algorithms for Clustering. Systems, Man, and Cybernetics, Part
C: Applications and Reviews, IEEE Transactions, Vol. 9, Issue 2, March 2009 pp. 133 - 155
Hussain T., & Habib S.J., Optimization of network clustering and hierarchy through
simulated annealing. Computer Systems and Applications, AICCSA 2009. IEEE/ACS
International Conference, pp. 712 - 716
Jain A.K., & Dubes R.C., Algorithms for Clustering Data. Prentice Hall, 1988.
Kohavi R., & John G.H. 1997 Wrappers for Feature Subset Selection. Artificial Intelligence, Vol.97, no. 1/2, pp. 273-324.
40
Li y., Dong M., & Hua J. Localized feature selection for clustering. Pattern Recognition Letters, Vol.29, Issue 1, 1 January 2008, pp. 10-18
Liu H., & Yu L., Toward Integrating Feature Selection Algorithms for Classification
and Clustering. Knowledge and Data Engineering, IEEE Transactions Vol.17, Issue 4,
pp. 491 - 502
Lumer E.D., & Faieta B., Diversity and adaptation in populations of clustering ants. In Proc.Of the Third International Conference on The Simulation of Adaptative Behavior: From Animals to Animats 3, pp. 449-508. Mit Press, 1994.
Marco D. 2004 Ant Colony Optimization. Massachusetts Institute of Technology ISBN 0-262-04219-3
Nakariyakul S., Casasent D. P., An improvement on floating search algorithms for
feature subset selection. Pattern Recognition, Vol 42, Issue 9, September 2009, pp.
1932-1940
Nasim M., & Qaisar S., Hierarchical MIMO: A clustering approach for Ad hoc wireless
sensor networks. Information Sciences and Systems (CISS), 17-19 March 2010
Princeton, NJ pp.1-6
Owczarczuk M. Churn models for prepaid customers in the cellular telecommunication
industry using large data marts. Expert Systems with Applications, Vol.37, Issue 6,
June 2010, pp. 4710-4712
Rui Xu, & Wunsch D.II, 2005 Survey of Clustering Algorithms. Neural Networks IEEE Transactions, Vol. 16, Issue 3, May 2005, pp. 645 – 678
Sheikh, R.H., Raghuwanshi, M.M., & Jaiswal A.N., 2008 Genetic Algorithm Based
Clustering: A Survey. Emerging Trends in Engineering and Technology, ICETET '08.,
pp.314 – 319.
Shelokar P.S., Jayaraman V.K., & Kulkarni B.D.. An ant colony approach for
41
Tsai C.F., & Lu Y.H., Customer churn prediction by hybrid neural network. Expert Systems with Applications, Vol.36, Issue 10, December 2009, pp. 12547-12553
Vizine A., De Castro L.N., Hruschka E.R., & Gudwin R.R., Towards improving
clustering ants: An adaptative clustering algorithm. Informatica Journal, Vol.29, 2005.
Weili Z. An Improved Entropy-Based Ant Clustering Algorithm Information
Engineering. ICIE '09. WASE International Conference on Vol. 2 2009, pp 41 - 44
Weiguo S., Xiaohui L., & Fairhurst M. Niching memetic algoirthm simulatenous feature
seleciton and clustering. Knowledge and Data Engineering, IEEE Transactions Vol.20,
Issue 7, 2008 pp. 868 – 879.
Xiao-bin Z., Feng G., & Hui H. Customer-churn Research Based on Customer
Segmentation. Electronic Commerce and Business Intelligence, ECBI 2009.
International Conference on 2009, pp. 443 – 446
Zeng H., & Cheung Y. M., A new feature selection method for Gaussian mixture
clustering. Pattern Recognition, Vol.42, Issue 2, February 2009, pp. 243-250
Zhou Y., Fleischmann K., & Wallace W. 2010 Automatic Text Analysis of Values in the
Enron Email Dataset: Clustering a Social Network Using the Value Patterns of Actors.
Proceedings of the 43rd Hawaii International Conference on System Sciences 5-8 Jan. 2010 Honolulu, HI pp. 1 – 10
42 VITAE
Name Surname: Emre AKARSU
Address: Merkez mh. Beşiktaş, ISTANBUL Birth place and year: Bursa 1983
Foreign Language: English
High School: Süleyman Çelebi High School
Under Graduate: Istanbul Technical University 2005 Graduate: Bahcesehir University
Institute Name: Institute of Science Program Name: Computer Engineering Working Life: Ibtech 2005-