Comparison of Feature Selection Algorithms for
Medical Data
H. Dağ
1, K. E. Sayın
1, I. Yenidoğan
1, S. Albayrak
2, C. Acar
1 1Information Technologies DepartmentKadir Has University
{hasan.dag, kamranemre.sayin, isil.yenidogan, cagil.acar}@khas.edu.tr
2Computer Engineering Department Yıldız Technical University
Abstract—Data mining application areas widen day by day. Among those areas medical area has been receiving quite a big attention. However, working with very large data sets with many attributes is hard. Experts in this field use heavily advanced statistical analysis. The use of data mining techniques is fairly new. This paper compares three feature selection algorithms on medical data sets and comments on the importance of discretization of attributes.
Keywords-component; data mining, feature selection algorithms: gain ratio, information gain, correlation based feature selection (CFS), discretization.
I. INTRODUCTION
Data mining, a process of extracting any hidden information within a given data set, has been very important lately and its importance is ever increasing as the data gathered systematically in almost every field. Application of data mining techniques is, however, not straight forward. One has to understand the nature of data, the meaning of each attribute. This is necessary since generally the expert of data and the person who applies the data mining techniques to data are from different backgrounds. Data mining expert comes usually from information technologies area and the owner of the data may be from marketing, medicine, electronic, business, etc. Hence, data mining expert should discuss the results with the field expert, to which data belong. Before data mining techniques applied, however, the data has to be preprocessed. Data cleaning, integration, transformation, and size reduction are components of preprocessing techniques, which can substantially improve the overall quality of the patterns and or information sought [1].
Data mining applied to medical data has great potential for discovering the hidden patterns related to the medical area in the data sets (as is the case in any other field). Later, the found patterns can be used for both clinical diagnosis and for designing decision support systems. Data sets in the medical fields include many attributes, most of which either are derived or weakly related to class information. Thus, one needs to reduce the number of attributes in the data under study. This is, however, should firstly be done by the field expert (if necessary by simple observations), and then by the well-tested standard feature selection algorithms. Said it simply, the feature selection (or attribute space size reduction) problem can be
formulated as: find a subset of attributes such that the characteristics of the original data set can be best represented by this selected subset, and thus, any available hidden pattern can be easily obtained. As is clear from the statement this is a very hard problem, where the difficulty strongly depends on the number of attributes from which a subset to be selected. This difficulty is apparent from the vast amount of studies conducted on feature selection subject [2]-[15].
In this study we test three famous feature selection algorithms, namely Information Gain [16]-[18], Gain Ratio [19]-[20] and Correlation based Feature Selection [21]. These three feature selection algorithms are thoroughly studied on four medical data sets: Coronary Artery Calcification (CAC) data set of [22], and three benchmarked data sets: Heart, Hepatitis, and Hypothyroid from UCI [23]. The small summary of data is presented in Table I.
Discretization of attributes, a process of categorizing, (dividing a wide range and/or continues-valued of numbers into intervals) is quite important for the success of classification algorithms. We also test the four medical data sets mentioned above for discretization. We select a subset of attributes first then discretize any numerical-valued attributes followed by testing with a classification method. To see the effect of discretization on medical data sets we study three classification algorithms: J48 (an implementation of C4.5 in Weka, an open-source based data mining package [21]), Support Vector Machine, and Naïve Bayes [1].
The rest of the paper is as follows. In Section II we describe briefly the feature selection algorithms. Section III explains discretization, and section IV discusses the test results, whereas section V provides the conclusions.
II. FEATURE SELECTION ALGORITHMS
Given a data set, the selection of the best feature subset is shown to be an NP-hard problem [16-17]. As the dimension of the data gets bigger, that is the number of attributes is increased, testing and training of classification methods become harder. Thus, before any classification method is applied to the data set at hand a feature selection algorithm needs to be used to reduce the size of the search space. There are many algorithms suggested in the literature for selection of a subset of attributes. We test only three of these on the 978-1-4673-1448-0/12/$31.00 ©2012 IEEE
medical data set. Before presenting the feature selection algorithms, however, we briefly describe the feature selection algorithms and the ranking engine within these algorithms. A. Info Gain
Information Gain method calculates the information gained from an attribute with respect to the class by using entropy measure [20]. The formula for Information Gain is as follows.
Info Gain (Class, Attribute) = H (Class) – H (Class | Attribute),
where H is called Entropy, which is defined as follows ܧ݊ݐݎݕሺܵሻ ൌ െ
ୀ
ୀଵ
݈݃ଶ
where p is the probability, for which a particular value occurs in the sample space S.
Entropy ranges from 0 (all instances of a variable have the same value) to 1 (equal number of instances of each value).
This is a measure of how values of an attribute are distributed and signifies the measurement of pureness of an attribute.
High Entropy means the distribution is uniform. That is, the histogram of distribution is flat and hence we have equal chance of obtaining any possible class [18].
Low Entropy means the distribution is gathered around a point. The histogram of frequency distribution will have many minimums and more than one high makes it more predictable. B. Gain Ratio
The Gain Ratio method is a normalized version of Information Gain. The normalization is done by dividing the information gain with the entropy of the attribute with respect to the class; as a result it reduces the bias of the information gain algorithm. The formula for Gain Ratio is as follows.
Gain Ratio (Class, Attribute) = (H (Class) – H (Class | Attribute)) / H (Attribute).
Although Gain Ratio is closely related to the Information Gain algorithm we wanted to see the effect of normalization of gains of attributes. It turned out that sometimes the order of attributes selected by Information Gain and Gain Ratio changes. As the number of attributes in subset is increased the difference may be more pronounced. For example, as seen from Table III for CAC data within the first seven attributes at least one attribute is different, though this may not have a significant effect on the classification algorithm as seen from Table V for J48 classification algorithm.
1) Ranker algorithm
Both the Information Gain and Gain Ratio algorithms use ranker method. “This algorithm ranks attributes according to average merit and average rank. It has an option to assign a cutoff point (by the number of attributes or by a threshold value) to select the attributes” [24]. We used this option in our benchmarks for selecting the attributes.
C. Correlation Based Feature Selection (CFS) Algorithm CFS is a feature subset selection algorithm found by Mark Hall in 1999 [21] in his PhD study. This feature selection algorithm looks for the best subset of attributes holding the highest correlation with the class attribute but lowest correlation between each attribute.
1) Greedy Stepwise Search Algorithm
The CFS algorithm uses Greedy Stepwise search algorithm. “It performs greedy forward search from an empty set of attributes or greedy backward search from full set of attributes. It adds/deletes attributes to the set until no longer any other attributes changes the evaluation performance” [21]. There is also an option to rank the attributes and use a cutoff point (by number of attributes or by a threshold value) to select the attributes, which we used in our work.
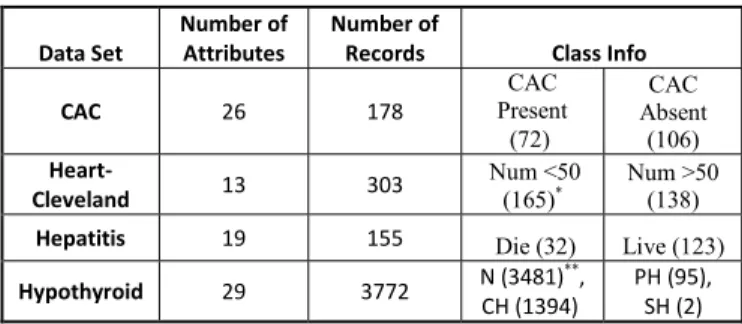
TABLE I. PROPERTIES OF THE DATA SETS
Data Set
Number of Attributes
Number of
Records Class Info
CAC 26 178 CAC Present (72) CAC Absent (106) Heart-Cleveland 13 303 Num <50 (165)* Num >50 (138)
Hepatitis 19 155 Die (32) Live (123)
Hypothyroid 29 3772 N (3481) ** , CH (1394) PH (95), SH (2)
* : Diagnosis of Heart Disease (angiographic disease status), diameter narrowing
** : N: Negative, CH: Compensated Hypothyroid, PH: Primary Hypothyroid, SH: Secondary Hypothyroid
III. DISCRETIZATION
Discretization is the process of transforming numerical attributes to categorical (nominal) attributes that is, dividing a range into subgroups. For example, a range of 10-65 is divided into three subgroups: {(10-23), (24-39), (40-65)} [25].
Discretization can be done by either supervised or unsupervised methods. Supervised techniques take the class information available in the data into consideration whereas unsupervised techniques do not [26]. Supervised methods are mainly based on either Fayyad-Irani [27] or Kononenko [16] discretization methods.
Supervised hierarchical split method uses the class to select borderlines for discretization partitions [26]. Unsupervised methods are applied to data sets with no class information and are categorized into two groups: the basic ones consisting of equal-width and equal frequency binning, and the more complex ones, based on the clustering methods [28].
In our work we used CAC data set extensively for checking the effect of discretization. Since its class information was known we used Fayyad-Irani’s discretization algorithm from the supervised discretization algorithms [27] which uses the class information entropy of candidate partitions to select boundaries for discretization and minimum description length (MDL) principle as stopping criterion.
As an example of discretizing; age, a numeric attribute from CAC dataset, can be taken under consideration. We have 178 samples an CAC dataset and the values of age attribute vary
The first three authors greatly acknowledge the financial support from the
between 20 and 68. Average of the age column is 36.5 and standard deviation is ± 11,2.
After the discretization process, the new distribution of age attribute is given below.
TABLE II. DISCRETIZATION OF THE AGE ATTRIBUTE
No Label Count
1 (-inf – 34.5] 88
2 (34.5 – inf ] 90
When we used Fayyad-Irani's Discretization Method, age values are separated in two groups, which are patients older than 34.5 and younger than 34.5.
Here 34.5 represents the cutoff point for Fayyad-Irani's Discretization Method.
TABLE III. FEATURES SELECTED BY THE ALGORITHMS
Data INFO GAIN GAIN RATIO CFS
CAC
Age Age Age
Time On
Transplantation Diabetes Mellitus
Time On Transplantation Diabetes Mellitus
Time On
Transplantation Diabetes Mellitus
Rose Angina P Rose Angina
P Rose Angina Donor Type
Donor Type
Past Cardiac
Disease P
Past Cardiac
Disease Donor Type Hypertension
He ar t CP CP Thal Thal Thal CA CA CA Exang Oldpeak Oldpeak CP
Exang Exang Oldpeak
Thalach Thalach Thalach
Slope Slope Slope
H
epa
titis
Albumin Ascites Ascites
Bilirubin Bilirubin Albimun
Ascites Albimun Bilirubin
Spiders Varices Spiders
Fatigue Spiders Protime
Histology Fatigue Varices
Malaise Histology Histology
Hy p o th yr o id TSH TSH TSH
FTI FTI FTI
IT4 IT4 IT4
T3 T3 T3
TSH measured TSH measured On Thyroxine
On Thyroxine On Thyroxine Query Hypothyroid
Referral Source Pregnant Goitre
TABLE IV. AGREEMENT AMONG THE ALGORITHMS (INFORMATION GAIN
:IG,GAIN RATIO :GR,CORRELATION BASED FEATURE SELECTION:CFS)
Data Set Ratio of Number of Attributes Selected 5 6 7 CAC IG/GR 5/5 5/6 7/7 IG/CFS 4/5 6/6 6/7 GR/CFS 4/5 5/6 6/7 Heart-Cleveland IG/GR 5/5 6/6 7/7 IG/CFS 5/5 6/6 7/7 GR/CFS 5/5 6/6 7/7 Hepatitis IG/GR 4/5 5/6 5/7 IG/CFS 4/5 4/6 6/7 GR/CFS 4/5 5/6 6/7 Hypothyroid IG/GR 5/5 6/6 6/7 IG/CFS 4/5 5/6 5/7 GR/CFS 4/5 5/6 5/7
TABLE V. CLASSIFICATION PERFORMANCE OF J48(BASED ON THE
ATTRIBUTES SELECTED BY IG/GR/CFSALGORITHMS)
Data Set Number of Attributes
5 6 7
CAC 65/65/65 67/66/67 67/68/67
Heart 80/78/80 78/78/78 78/78/77
Hepatitis 83/83/83 83/83/82 83/83/82
Hypothyroid 98/98/99 99/99/99 99/99/99
TABLE VI. CLASSIFICATION PERFOMANCE OF J48 ON CACDATA SET
Feature Selection
Algorithm Type
Number of Attributes
5 6 7
Info Gain Normal 65 67 68
Discretized 71 72 71
Gain Ratio Normal 65 66 68
Discretized 72 72 71
CFS Normal 65 67 67
Discretized 69 70 71
TABLE VII. CLASSIFICATION PERFORMANCE OF SMO(SUPPORT VECTOR
MACHINE) ON CACDATA SET Feature
Selection
Algorithm Type
Number of Attributes
5 6 7
Info Gain Normal 69 70 69
Discretized 69 68 70
Gain Ratio Normal 70 70 70
Discretized 69 70 69
CFS Normal 70 70 69
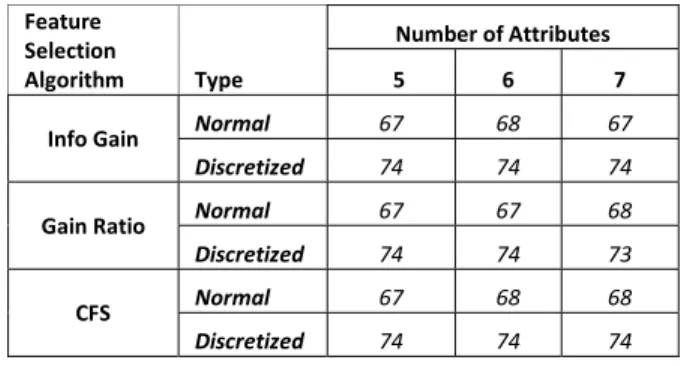
TABLE VIII. CLASSIFICATION PERFORMANCE OF NAÏVE BAYES ON CAC DATA SET Feature Selection Algorithm Type Number of Attributes 5 6 7
Info Gain Normal 67 68 67
Discretized 74 74 74
Gain Ratio Normal 67 67 68
Discretized 74 74 73
CFS Normal 67 68 68
Discretized 74 74 74
IV. DISCUSSION OF TEST RESULTS
We have tested three feature selection algorithms; however, two of them, Information Gain and Gain Ratio, are essentially related. Thus, we can say the real test was between two widely used feature selection algorithms. The reason of testing two related algorithms was to see whether the normalization also affect the results. It turns out that it does slightly, as seen from Table III among the attributes selected by both Information Gain and Gain Ratio.
We started with 5 attributes in the subsets initially and increased the number of attributes gradually until no longer the performance of classifier changes significantly.
We presented test results for subsets of attributes including 5, 6, and 7 attributes each. There is more than 80% agreement among 3 feature selection algorithms as shown in Tables III and IV. The performance of classification method J48, an implementation of C4.5 in Weka, does not change significantly for the three subsets as shown in Table V.
When dealing with the discretization effect we used the CAC data since we had the chance to have the field expert to interpret the results. For the data set again we used three subsets containing 5, 6, and 7 attributes respectively. For each subset of data we tested J48, SVM, and Naïve Bayes classifiers to see the effect of discretization. Both J48 and Naïve Bayes algorithms the classification performance was increased up to 10%, whereas for SVM the discretization did not have a clear advantage.
V. CONCLUSIONS
The study results of this paper are based on two partial experimental tests. The goal of one of the studies was to compare three feature selection algorithms; that of the other one was to evaluate the effect of discretization both on medical data sets. It turns out that the three feature selection algorithms produce almost the same subset of attributes differing in the order of the attributes slightly. Info Gain and Gain Ratio are initially expected to produce almost identical results since both of the algorithms are closely related. However, CFS algorithm has also produced similar results as the other two algorithms. The lowest agreement among all three algorithms was 67%. Thus, one may use any feature selection algorithm on medical data.
Even though the subset selected by the three algorithms tested differed from each other by 0-20% (one case differed
only 33%) the performance of the classification algorithm, J48, was almost the same for each subset (Table V). We set the size of the subsets to 5, 6, and 7 to check whether the size has an appreciable effect on the classifier. It turns out that increasing the size of the subsets of the attributes does not increase the performance of the classifier. It even makes it worse time to time. Hence, one may want to start from small number of attributes initially and increase gradually until the performance of the classifier no longer varies.
Discretization seemed to have significant effect on most of the classification algorithms such as Naïve Bayes and J48, both of which rely more on the categorical attributes. But it does not have a clear effect on SMO (Tables VI-VIII). It may even decrease the performance of SMO, because SMO is a SVM (Support Vector Machine) based algorithm. The performance of SVM and Artificial Neural Network algorithms increases when working with the continuous features. On the other hand, the performance of the logic based algorithms, such as Decision Trees (J48), increases when working with the nominal (discrete) features [30]. The increase in performance of the algorithms after discretization ranged between 5% and 10% in J48 and Naïve Bayes algorithms.
ACKNOWLEDGMENT
The authors thank Dr. Nurhan Seyahi and his colleagues for granting permission to use their CAC data and for his invaluable comments on our research groups’ test results.
REFERENCES
[1] J. Han, M. Kamber, and J. Pei, “Data Mining: Concepts and Techniques”, Second Edition, San Francisco, Morgan Kauffmann Publishers, 2001.
[2] J. Kittler, “Feature set search algorithms”, In C. H. Chen, editor, Pattern Recognition and Signal Processing. Sijhoff an Noordhoff, the Netherlands, 1978.
[3] H. Almuallim and T. G. Dietterich, “Efficient algorithms for identifying relevant features”, In Proceedings of the Ninth Canadian Conference on Artificial Intelligence, pages 38–45. Morgan Kaufmann, 1992.
[4] K. Kira and L. A. Rendell, “A practical approach to feature selection”, In Machine Learning, Proceedings of the Ninth International Conference, 1992.
[5] G. H. John, R. Kohavi and P. Pfleger, “Irrelevant features and the subset selection problem” In Machine Learning, Proceedings of the Eleventh Inter-national Conference, Morgan Kaufmann, 1994.
[6] R. Kohavi and B. Frasca, “Useful feature subsets and rough sets reducts”, In Proceedings of the Third International Workshop on Rough Sets and Soft Computing, 1994.
[7] Holmes and C. G. Nevill-Manning. “Feature selection via the discovery of simple classification rules”, In Proceedings of the Symposium on Intelligent Data Analysis, Baden-Baden, Germany, 1995.
[8] B. Pfahringer, “Compression-based feature subset selection”, In Proceedings of the IJCAI-95 Workshop on Data Engineering for Inductive Learning, pages 109–119, 1995.
[9] R. Kohavi and G. John, “Wrappers for feature subset selection”, Artificial Intelligence, special issue on relevance, Vol. 97, pages 273-324, 1997.
[10] M. A. Hall and L. A. Smith, “Feature subset selection: A correlation based filter approach”, In Springer, editor, Proceedings of the International Conference on Neural Information Processing and Intelligent Information Systems, pages 855–858, 1997.
[11] H. Liu and H. Motoda, “Feature Extraction, Construction and Selection: A Data Mining Perspective”, Kluwer Academic Publishers, 1998.
[12] I. Inza, P. Larranaga, R. Etxeberria and B. Sierra, “Feature subset selection by Bayesian networks based optimization”, Artificial Intelligence, Vol. 123, pages 157–184, 2000.
[13] I. Guyon and A. Elisseeff, “An introduction to variable and feature selection”, Journal of Machine Learning Research, Vol. 3, pages 1157-1182, 2003.
[14] K. Selvakuberan, D. Kayathiri, B. Harini, M.I. Devi, "An efficient feature selection method for classification in health care systems using machine learning techniques," Electronics Computer Technology
(ICECT), 2011 3rd International Conference on , vol.4, no., pp.223-226,
8-10 April 2011.
[15] A. G. Karegowda, A. S. Manjunath and M. A. Jayaram, “Comparative study of attribute selection using gain ratio and correlation based feature selection”, International Mournal of Information Technologoy and knowledge Management, Vol. 2, No. 2, pages 271-277, 2010.
[16] I. Kononenko and I. Bratko. “Information based evaluation criterion for classifier’s performance”, Machine Learning, Vol. 6, pages 67-80, 1991. [17] I. Kononenko, “On biases in estimating multi-valued attributes, pages
1034-1040, 1995.
[18] A. W. Moore, Information Gain, Carnegie Mellon University http://www.cs.cmu.edu/~awm/tutorials.
[19] J. R. Quinlan, “C4.5: Programs for Machine Learning”, San Mateo, Morgan Kaufmann, 1993.
[20] E. Harris Jr., “Information Gain versus Gain Ratio: A Study of split method biases”, Mitre Corporation, 2001.
[21] Mark A. Hall, “Correlation-based Feature Selection for Machine Learning”, PhD Thesis, Dept. of Computer Science, University of Waikato, 1999.
[22] N. Seyahi, A. Kahveci, D. Cebi, M. R. Altiparmak, C. Akman, I. Uslu, R. Ataman, H. Tasci, and K. Serdengecti, "Coronary artery calcification
and coronary ischaemia in renal transplant recipients", Nephrol Dial Transplant, Vol. 26, num. 2, pp. 720-726, 2011.
[23] C. Blake and C. Merz. UCI repository of machine learning databases, 1998.
[24] I. H. Witten, E. Frank, Data Mining: Practical Machine Learning Tools and Techniques, Morgan Kaufmann Series in Data Management Systems, 2005.
[25] L. Jonathan, L. Lustgarten, V. Gopalakrishnan, H. Grover and S. Visweswaran, “Improving classification performance with discretization on biomedical datasets”, AMIA Annu Symp Proc., pages 445-499, 2008. [26] I Mitov, K. Ivanova and K. Markov, “Comparison of discretization
methods for preprocessing data for pyramidal growing network classification method”, Information Science & Computing, International Book Series, Number 14, New Trends in Intelligent Technology, ITHEA, pages 31-39, 2009.
[27] U. Fayyad and K. Irani, “Multi-interval discretization of continuous-valued attributes for classification learning”, Proceedings of the 13th International Joint Conference on Artificial Intelligence, Morgan Kaufmann, San Mateo, CA, pp.1022-1027, 1993.
[28] J. Gama and C. Pinto, Discretization from data streams: applications to histograms and data mining. In Proceedings of SAC., 662-667, 2006. [29] J L Lusrtgarten, S. Visweswaran, V. Gopalakrishnan, G. F. Cooper,
“Application of an Efficient Bayesian Discretization Method to Biomedical Data”, BMC Bioinformatics, 12:309, 2011.
[30] S. B. Kotsiantis, “Supervised Machine Learning: A Review of Classification Techniques”, Proceedings of the 2007 conference on Emerging Artificial Intelligence Applications in Computer Engineering: Real Word AI Systems with Applications in eHealth, HCI, Information Retrieval and Pervasive Technologies, IOS Press, pages 3-24, 2007