Oh hí 6Ğ O* ε< ^^ ζ ■ ,·· ; . ' ' i "'iV ·.- f .t· * · ’ V *·)» T T-T - S.. • ,Γί'^ ' ν. ТіГ'Т'-і.-Ігі.Г■ “яГ : ; Т \ *^·,· :■ V Г л з- ! ; ■ “ ■ ¡ ί 'й - - ■» . . . ' -' '»» v·' ■ ' · · ■ ' -‘»J ^ ·‘ . '»J -· » ■- ■ ' . · ·.· ; чУ : '.:j t. ‘\ .'· . » ; « ι·.· ϊ. г· .i. .-.
yA 6»
DEVALUATION AS A BALANCE OF PAYMENTS CORRECTIVE MEASURE
IN TURKEY
A Thesis
Submitted to The Deportment of Manogement and Graduate School of Business A dm inistration
of B ilkent University
In P artial F u llfillm e n t of The Requirements fo r The Degree of
MASTER OF BUSINESS ADMINISTRATION
By
Zeynep ÖZTÜRK February, 1990
I c e rtify that I hove read th is thesis and in my opinion i t is fu lly adequate, in scope and in quality, os a thesis fo r the degree of Master of Business Adm inistration.
Assist. Prof. Gökhon Qopo^lu
I c e rtify that I hove read th is thesis and in my opinion i t is fu lly adequate, in scope and in quality, os a thesis fo r the degree of Master of Business Adm inistration.
(
Assoc. Prof. Kür?ad Aydogon
I c e rtify that I have read th is thesis and in my opinion i t is fu lly adequate, in scope and in quality, os a thesis fo r the degree of Master of Business Adm inistration.
Approved fo r the Graduate School of Business Adm inistration
ABSTRACT
DEVALUATION AS A BALANCE OF PAYMENTS CORRECTIVE MEASURE IN TURKEY
Zeynep ÜZTÜRK MBA in Management
Supervisor: Assist. Prof. Gôkhan Çapoglu February 1990, 45 Pages
The main purpose of th is study is to examine em ip rically whether or not devaluation could be relied upon as a means fo r correcting the balance of payments d e fic its in Turkey. The tim e period is the years between 1968-1984.
In th is study, an international trade model fo r Turkey is established to find out price and income e la s tic itie s of im port and export demands. Restricted form of Marshal 1-Lerner condition (Harberger condition) is applied to see the effectiveness of devaluation. Import and export demands functions are estimated by both Ordinary Least Square and Two Stage Least Square methods to see how Turkey's case f it s into the methodological controversy. Another issue considered is the choice between s ta tic and dynamic form ulations of the export and im port functions.
It is found that im port demand of Turkey is income e la stic but price in e la stic, whereas export demand fo r Turkey is e la stic both w ith respect to the rela tive prices and income. Devaluation con be used as an e ffe c tiv e tool in correcting the balance of payments in Turkey according to the study’s findings.
Key words ; Balance of payments, im port demand, export demand, price e la s tic ity , income e la s tic ity . Marshal 1-Lerner condition, OLS, 2SLS, Cochrane Orcutt Type Least Square Estimation.
ÖZET
TÜRKİVE’NİN ÖDEMELER DENGESİNE DÜZELTİCİ TEDBİR OLARAK DEVELÜASYON
Zeynep ÖZTÜRK
Yüksek Lisans Tezi, İşletme Enstitüsü Tez Yöneticisi : Yrd. Doç. Gökhan Çapoğlu
Şubat 1990, 45 Sayfa
Bu çalışmanın temel amacı amprik olarak devalüasyonun Türkiye’nin ödemeler dengesi için düzeltici b ir te db ir olup olmadığını araştırm aktır. İncelenen dönem 1968-1984 zaman aralığıdır.
Bu çalışmada ith a la t ve ihracat taleplerinin g e lir ve fiy a t esnekliklerini tahmin etmek için Türkiye’nin uluslararası tic a re t modeli kurulmuştur. Develüasyon’un e tk in liğ in i anlamak için M arshall-Lerner şartının kısıtlanm ış şekli (Harberger şa rtı) uygulanmıştır. Methodsal ta rtışm a ların Türkiye’nin dış tic a re t modeline nasıl uyduğunu anlamak için ith a la t ve ihracat fonksiyonları hem Adi En Küçük Kareler, hem de İki Aşamalı En Küçük Kareler yöntem leriyle tahmin e d ilm iş tir. Dikkate alınan diğer b ir konuda ihracat ve ith a la t fonksiyonlarının s ta tik ve dinamik form ülasyonları arasında seçim yapmaktır.
Türkiye’nin ith a la t talebinin gelire karşı esnek, fiy a ta karşı esnek olmadığı, ihracat talebinin ise hem gelire hem de fiya ta karşı esnek olduğu bulunmuştur. Çalışmanın bulgularına göre develüasyon Türkiye’nin ödemeler dengesini düzeltmekte e tk ili b ir araçtır.
Anahtar Sözcükler: Ödemeler dengesi, ith a la t talebi, ihracat talebi, fiy a t esnekliği, g e lir esnekliği, M arshall-Lerner şa rtı, AKK, 2AEKK, Cochrane Orcutt T ipi En Küçük Kareler Tahmini
I would like to thank to my supervisor Assist. Prof. Dr. Gökhan Çapoğlu fo r his support, encouragement fo r the preparation of th is thesis.
I would also like to thank to Assoc. Prof. Dr. Kürşad Aydogan and Assist. Prof. Dr. Osman Zalm fo r th e ir comments and th e ir suggestions.
I also have many thanks to my friend Sezgin fo r his help during preparation of th is thesis and fo r the use of his PC.
ACKNOWLEDGEMENTS
Finally, I would like to express my appreciation to my parents fo r providing an environment and encouragement necessary to prepare th is thesis.
CONTENTS ABSTRACT ÖZET ACKNOWLEDGEMENT LIST OF TABLES Page i i i iv V v iii 1. INTRODUCTION 1
1.1 The Problem Statement 1
1.2 The Methodology 3
1.3 Some Consideration About Data 4
1.3.1 Time Period 4
1.3.2 Quantity of Exports and Imports 4 1.3.3 Unit Value of Import and Export 5 1.3.4 Consumer Price Index of Turkey 6 1.3.5 Gross National Product of Turkey 7 1.3.6 Consumer Price Index of OECD 7 1.3.7 Gross Domestic Product of OECD 7
2.LITERATURE REVIEW 8
3. RESEARCH METHODOLOGY 14
3.1 The Model 14
3.1.1 Import Function
3.1.2 Export Function 17
14
3.2 The Methodology of Estimation 3.3 Findigs of The Study
3.3.1 Import Function 3.2.2 Export Function 3.3.3 E la sticitie s
3.3.4 Application of Marshal 1-Lerner Condition 4. CONCLUSION 5. REFERENCES 20 22 22 30 36 40 42 44 V i i
L IS T OF TABLES
Table Page
l.a OLS Result of Equilibrium Import Demand Function 24 1. b 2SLS Result of Equilibrium Import Demand Function 25 2. Cochrane Orcutt Type Ite ra tive Technique Estimation 26 of Import demand Function
3. a OLS Result of Dynamic Import Demand Function 28 3. b 2SLS Result of Dynamic Import Demand Function 29 4.0 OLS Result of Equilibrium Export Demand Function 31 4. b 2SLS Result of Equilibrium Export Demand Function 32 5. a OLS Result of Dynamic Import Demand Function 34 5.b 2SLS Result of Dynamic Import Demand Function 35 6 Equilibrium E la s tic itie s of Export and Import Demand 36 7 Long run E la s tic itie s of Export and Import Demand 39
1.1. The Problem S tatem en t
The d e fic its in balance of payments (BOP) have always been a problem fo r the Turkish economy. Hence, reducing the BOP d e fic its has been one of the main policy objectives fo r governments. However the d e fic it increased exponentionally during the s ix tie s and seventies, and i t was more than four b illio n dollars at the beginning of the eigthies.
Terms of trade (TOT), the ra tio of export prices to im port prices, showed declining trend during the planned period. Between 1960-1978, TOT deteriorated at an average of 1.4 percent annually. However d rastic deterioration in TOT appeared a fte r 1979. This was not only due to an increase in petrol prices but also unfavorable developments in exports of agricultural products a fte r 1979 . Although the quantity of agricultural product exported increased export revenue decreased (Kazgan, 1985:434).
1. INTRODUCTION
Investment and interm ediate goods consisted 95 percent of imports. Especially the rise in the oil prices during the seventies led to incease in the shares of interm ediate goods and raw m aterials. On the other hand, Turkey’s exports consisted of agricultural products and the share of industrial products did not change despite many incentives were offered (Kepenek, 1986:355).
The economic structure of Turkey which was based on the im port substitution policies led to the depression of the economy in the middle of the 1970's. There was a decrease in foreign exchange reserves and an increase in in fla tio n . Government took some sta b iliza tio n measures in 1978. Devaluation of Turkish lira was one of them. This policy improved the BOP d e fic it re la tiv e ly , i t declined to 2310.8 m illio n dollars which was the 50 percent of the
1977‘s trade d e fic it.
Continuous depression of the economy resulted in the application of the new economic policies in January 1980. This new economic program based on the liberation of the domestic market, and the export orientation in foreign trade.
In the f if t h fiv e years development plan, i t was stated that the BOP was the most im portant area in which the foreign outward open development policy reflected. Export sector was given importance to improve the BOP. To increase the volume of exports, some measures were taken such as devaluation of TL, export subsidies and incentives. During the application of these policies, the value of TL w ith respect to US dollars was reduced at a ra tio of 48-60 percent. A fte r January 1981, the value of TL was being adjusted daily.
Foreign trade noted spectacular development along w ith the 1980 economic s ta b ility measures and w ith outward orientations.
Turkey's foreign trade volume rose from $7.3 b illio n in 1979 to $19.3 b illio n in 1985. The balance of trade d e fic it standing at $3.4 b illio n s as of the end of 1985, rose only by 20 percent when compared w ith 1979. The most im portant development in exports was the sig n ifica n t s h ift to industrial products, th e ir share in overall exports rose to 75.3 percent in 1985 (Economic report,
1986:125).
This study estimates the price and income e la s tic itie s of im port demand of and export demand fo r Turkey, and tests the hypothesis whether or not the devaluation could be relied upon as a means of correcting the BOP d e fic its in Turkey.
1.2. The Methodology of Study
The present study is an investigation into the export and im port demand e la s tic itie s fo r Turkey. The m ajor consideration is to te st the hypothesis about effectiveness of the devaluation as a policy tool in correcting the BOP d e ficits.
To te s t the hypothesis, the im port and the export functions fo r Turkey are established. These functions are stated both in equilibrium and in disequilibrium forms. The re stricte d form of M arshall-Lerner condition is applied to see whether the devaluation improves the BOP d e fic its in Turkey^
(1) Нм^*П2«г (omliltioii
M
whtr« M = Mpotts; X 3 E liotts; ш s m tip iu i proptsslty o f import; i^ p rie« «btfticity o f txpott; Aji^spric« tlistieity of import
This study uses Ordinary Least Square (OLS) and Two Stage Least Square (2SLS) methods to see how Turkey's cose f it s into the methodological controversy. The tim e period covered is the years between 1968 and 1984.
1.3. Some Considerations about Data :
1.3.1. The Tim e Period Covered
The years between 1968 and 1984 are covered in th is study, on an annual basis. We do not take the years before 1970 because of the existence of s im ila r study done by M. Khan fo r the years 1951-1969. The years a fte r 1984 ore not token because of some missing data. For Turkey price and quantity Indices fo r im ports and exports hove not been calculated a fte r 1984. So the tim e period of the study is lim ite d by 1984.
1.3.2. Q uantity of Exports and Im ports
The volume index of export is taken from International Financial S ta tis tic s (IFS). The words volume and quantity ore used interchangable to re fe r to the physical amount of goods measured by the units or aggregated by the use of index numbers.
Th export quantity index is calculated according to Poocshe quantity index formula of
2 Pn
2 PnQo
where n refers to the current year price and quantity, w hile 0 refers to the base year (1980) quantity.
The volume index fo r im ports is determined by dividing TL value of im ports to unit value of im ports specified in terms of TL. This can be indicated as,
2 Pn^n
Pm
Foreign trade data resources are the "custom enterance and e xit decleration" presented to the custom adm inistration by im porters and exporters in accordance w ith the customs law. Foreign trade s ta tis tic s are mainly based on special trade system and include im ports, im ports w ith waiver, and exports, exclude certain commodities in non-trade status or legally re stricte d ones.
1.3.3. U n it Value of Im ports and Exports :
These are the unit value indices calculated according to Laaspayres price index form ula of
SPn^O
2 Po PO
where n refers to the current year prices and 0 refers to the base year (1980) price and quantity. The unit value fo r im ports is specified in terms of TL, considering TL value of im ports is interested by Turkish importers. The unit value fo r exports is determined in terms of US dollars, considering the export demand is according to the dollar value of Turkey’s export. The source of these data is IFS.
1.3.4. Consumer P rice Index of Turkey :
Consumer Price Indices are the most frequently used indicators of in fla tio n and re fle c t the changes in the cost of acquiring a fixed basket of goods and services by the average customer.
It was obtained in terms of TL from IFS year books and converted into the US dollar value by using the o ffic ia l exchange rate. Base year fo r th is index is taken as 1980 average.
1.3.5. Gross N ational Product of Turkey
Real GNP data in terms of 1980 average was taken from the IFS year books. It was converted into the US dollar value by using the
o ffic ia l exchange rate from IFS year books.
1.3.6. OECD Consumer P rice Index :
Since OECD countries took great part in Turkish foreign trade during the tim e period of th is study, OECD consumer price index was used in place of world price index level. As the index was available w ith d iffe re n t base years in OECD Main Economic indicators, i t was converted into a common base (1980).
1.3.7. OECD Gross Dom estic Product (GDP)
OECD to ta l real GDP was used fo r the w orld income level. Since the index was obtained w ith d iffe re n t base years, i t was converted into a common base of 1980. This data was collected from OECD Main Economic Indicator year books.
Orcutt (1950) discussed the effectiveness of the depreciation in improving the trade balance . He attempted to prove that the estimated price e la s tic itie s u n til that tim e were unreliable fo r such a proof. Since they were low er than expected.
Harberger (1958) made general survey of econometric works in the international trade area. His main attention was on the studies related to the price mechanism. The result of survey indicated that there was a pow erfull price mechanism in the international trade. He also concluded that long run e la s tic itie s of the export demand were greater than tw o fo r typical countries.
Ball and Mavwah (1962) estimated the series of im port demand functions fo r United States based on quarterly data from 1948-1958. Estimates were made fo r the six groups of imported goods. Single equation least square technique was used. The result of th is study was consistent w ith the hypothesis that the US im ports was e la stic both w ith respect to the rela tive prices and output. He concluded that the tim e series analysis could be used reliab ly in the estim ation of international trade models.
Dutta (1964) constructed a foreign sector model fo r India. His model consisted of six equations and one identity. Two of these equations were related to im ports and four of them were the export
2 . L it e r a t u r e R e v ie w :
equations. Payment balance was shown in identity. Imports were separated as merchandise and service imports. Exports were grouped according to dollar, ste rlin g, OECD and remaining w orld areas.
In im port demand functions, industrial output index was used as a proxy fo r income. Other explanatory variables were price, tim e trend, lagged im ports and index of trade barriers. Exports were determined os a function of industrial output, re la tive prices, tim e trend and export promotion index. In most of the coses he found rela tive price c o e fficie n t os insignificant.
Turnovsky (1968), estimated annual aggregate im port and export demand functions fo r New Zeland, fo r the years between 1947-1963. He aimed at finding out international trade relationship fo r a small country.
He considered the relationship between im ports and exports in terms of stock flo w model. Import demand was w ritte n os a function of the real private disposable income, the rela tive prices of im ports, the level of overseas assets lagged, the supply of New Zeland exports lagged and the stock of im ports in existence at the end of proceeding year. For supply equation explanatory variables were the foreign exchange available, the logged exports and the level of production abroad. The export equation was determined os a function of re la tive prices, income and net stocks.
He used both simultaneous and single equation techniques (OLS, 3PLS, 2SLS) to estim ate im port demand functions. He concluded that OLS was valid procedure fo r estim ating the im port demand functions fo r a small country. He found that im port demand was more sensitive to income, but export demand was more sensitive to price in New Zeland. Also he indicated an adverse long run e ffe c t of devaluation fo r th is country.
Hauthakker and Magee (1969) estimated the demand e la s tic itie s fo r both im ports and exports w ith respect to the income and price fo r some countries, most of them were developed. They also mode more detailed study fo r US.
Import and export equations were the function of rela tive prices and income in loglineor form. They used OLS method considering the fa ilu re of simultaneous equation techniques in th is area. Observation period was the years between 1951-1966, on an annual basis.
They concluded that d isp a ritie s in the income e la s tic itie s of im port demand caused secular improvement or deterioration in the trade balance, eventhough a ll countries grew and infla te d at the same rate. Another conclusion of th e ir study was that US had the same income e la s tic ity fo r demand of im port like the other developed countries but the other countries export demand fo r US was abnormally low. They also Indicated the re lia b ility of
tred ltlon a l least square method.
Khan (1974) made a study to provide estim ation of im port and export demand functions fo r fifte e n developing countries, one of them was Turkey. His aim was to te st the e ffe c t of price changes on the trade flo w s of these countries fo r the period of 1951-1969.
Import and export demands were determined as a function of rela tive price level and income. Unit value, price level and income were explanatory variables fo r the export and im port supply equations. He substituted OECD price and income level in the place of world income and price level. Equations were in double log form. Both equilibrium and disequilibrium cases were estimated by using 2SLS method.
It was found that the simple equation results were adequate. The price e la s tic itie s of exports and im ports were found greater than expected whereas the income e la s tic itie s were low. For many cases, the c o e fficie n t of autocorrelation was sign ifican t and th is was accepted as an indicator of omission of quantitative re strictio n s. He concluded that prices played an im portant role in the determination of im ports and exports of developing countries and Marshal 1-Lerner condition was sa tisfie d in these countries.
Ghartey (1987) examined whether or not the devaluation could be means in correcting the BOP d e fic its in Ghana. His export and im port
demand equations were s im ila r to Khan. He estimated both s ta tic and dynamic cases fo r exports and im ports by OLS and 2SLS methods.
The OLS results were best. Price e la s tic ity fo r im port demand was fa irly high but i t was low fo r export demand. Income e la s tic itie s were greater than unity fo r both export and im port demands. His basic conclusion was that the devaluation can be used in Ghana to correct BOP d e fic its but i t must be applied frequently w ith sm aller percentage changes and w ith other appropriate policy instruments.
Tansel and Togan (1987) examined the behaviour of im port and export demands of Turkey at an aggregate level. They aimed to analyse the sim ultaneity problems and to make a choice between s ta tic and dynamic form ulations.
The export and im port demands were specified as an increasing function of the level of real income in the im porting region and as a decreasing function of the re la tive price of the imported goods own price to the price of domestic substitutes. Export supply equation was w ritte n as a function of the ra tio of export prices to domestic prices in term s of TL, and domestic income. Import and export demands were specified in term s of TL and US $ respectively. The tim e period covered was 1960-1985.
They treated im port prices as exogenous, accepting in fin ite ly e la stic supply curve, and used OLS method to estimate im port function. They also estimated the im port function in terms of growth rate. T heir estim ation in log s ta tic and dynamic form indicated the serial correlation. In the dynamic growth rate model one period logged Import rate were insignificant. The best result was obtained from the s ta tic growth rate.
OLS result of export demand function fo r log s ta tic , log dynamic, and dynamic growth rate models did not indicate good result considering parameter constancy, and autocorrelation. So simultaneous estim ation was done. The best result was obtained from the s ta tic model in growth rates.
The present study d iffe rs from the previous studies in two respects. The f ir s t is the tim e period covered. Khan did s im ila r study fo r the years between 1951 and 1969, however the covered period is between 1968 and 1984 in th is study. The second is the estim ation method. Khan used only 2SLS, andTansel andTogan used only OLS fo r the estim ation of the im port function. However th is study estim ates im port and export functions both w ith OLS and 2SLS.
3.1. The Model :
3 .1 .1 . Im p o rt Function :
The most w idely used form ulation fo r the im port demand function is that the quantity of im ports demanded is explained by the ra tio of im port prices to domestic price level and domestic real
income The state of the im port function can be
w ritte n in double logarithm form as fo llo w s;
In mJ = Bo + Bi In (PMt/PDt) + 02 In +uj 1
In Mt = bo + bi In PMt + b
2
In P^^ + b3
In Yy,^ + u j 2In M js In M* 3
where
M = quantity of im ports of Turkey PM = unit value of im ports of Turkey PD = domestic price level of Turkey
Y = real gross national product of Turkey P^= w orld (OECD) price level
Y^= w orld (OECD) income level
3 . RESEARCH METHODOLOGY:
1. See Hauthakker and Magee (1969), Khan (1974), Ghaney (1985)
U Is a stochastic e rror term and superscripts d and s re fe r to demand and supply respectively.
The im port demand equation specifies that the quantity demanded is the loglinear function of the ra tio of im port prices to domestic price level, assuming a degree of s u b s titu ta b ility between imported and domestic goods, the domestic income and the additive stochastic disturbance term. Because of the logarithm ic specification, the parameters B^ and B
2
are the price and income e la s tic itie s respectively. According to the theory negative sign fo r B^ and positive or negative sign fo r B2
are expected. The la tte r is the result of whether the im port good is regarded as a normal or an in fe rio r good. Import supply is given as a loglinear function of im port price, w orld price level, world real income and stochastic disturbance term. The la st equation is equilibrium condition.In th is system there are three endogenous variables, PM, M^, №, and fo ur exogenous variables, PD, Py^, V, Yyy. In equation (1), the number of excluded predetermined variables (Pyy and Yw) are greater than the number of the endogenous variables (PM) on the rig h t hand side , so i t is overidentified. Equation (1) can be estimated by OLS and by 2SLS using PD, V, P ^ and as instrumental variables. One must also consider the line ar constraint that B^ is the same fo r PM and PD.
In the OLS estim ation all values of Im port demand equation ore specified In term s of TL. This Indicates that the Im porters response according to the TL value of outpayment. However In the 2SLS estim ation, since we have to consider the supply side, the determination Is done In terms of US $. Volume of Import In m illón of US $ Is regressed on a real GNP of Turkey In terms of TL and the rela tive prices In terms of $. Relative prices must be expressed In a common currency unit because of the adjustment fo r the foreign exchange rate changes.
Introducing the lagged values of Imports and Import price leads to the dynamic form of the Import demand and supply equations.
D ynsm ic form can be w ritte n as fo llo w s;
d d
In
= S
q+ 6, In (PMt/PDt) + 62ln V^ + S jln
+ v^
4
In
= go + g 1 In Pvt + 92 In PMt + gs In Y^t + 94 In PMt_i + v*
5
ln M j= ln M t 6
Equilibrium relationship Im plies Instantaneous adjustment by the Im porters to the changes In the relative price of Imports and real Income. However there may be costs In adjustment of actual Imports to desired Imports, or Imports may be tied to the contracts extended over a period of time. So these result In probable delayed response. So to te st the possible Incorrect specification results
from the estlm otlon of equilibrium relationship when true relationship is a disequilibrium ; im port function is determined in the content of p artial adjustment mechanism, in which the changes in im ports ore related to the difference between the demand fo r im ports in period t and the actual level of im ports in the previous period.
In th is system the endogenous variables ore the some w ith the previous cose but the tw o more predetermined variables are added, P ^ t-1 ' ’^ t - l · stochastic e rror terms of the demand and supply equations respectively.
Since the number of excluded predetermined variables (3) is greater than the number of included endogenous variables (1) at the rig h t hand side of equation (4), i t is overidentified. Equation (4), therefore, con be estimated by 2SLS. It is also estimated by OLS.
3 .1 .2 . Export Function :
The e g t/ilW rw m cose demand and supply model of Turkey’s exports is specified as fo llo w s ;
d d In =(Xq + <x^ In (PX^/P^t) +(X
2
ln + u S i In X^ = 'll PXt + PDt+ Osln Yt+ u d s In X^ = In X^ 7 6 9 17where
X = quantity of exports of Turkey PX= unit value of exports of Turkey
The other variables are as explained in im port demand function.
Export demand is specified as a function of the ratio of export prices to the world price level, indicating substitution between exported goods and foreign goods, the world income, and the additive stochastic disturbance term. The parameters (X| andot
2
are the price and income e la s tic itie s respectively. The sign of is expected negative , whereas the sign of <X2
is expected positive or negative depending on whether the export good is seen as a normal or an in fe rio r good. The export supply equation is specified as a loglinear function of the export prices, the domestic price and income level and the stochastic disturbance term. The last equation is equilibrium condition.Export demand equation can be estimated by OLS and 2SLS methods. When we determine model simultaneously, we take PX, X*^ and X® as endogenous and PD, P ^, Y, Yy^ as exogenous variables. Equation (7) is overidentified , since the number of excluded predetermined variables (PD, Y) is greater than the number of endogenous variables (PX) at the right hand side. Equation (7) is
estimated by 2SLS using PD, Py^, Y and Yyy as instrumental variables; considering the linear constraint of ct| is being both export and domestic price e la s tic ity . A ll the values in the export demand and supply equations are w ritte n in terms of US $.
The dynsm ic form export function is determined os fo llo w s;
d d In =
00
+ 0, In (P X /P ^t) +02
In Y^t +03
In Xt_i + V* s s In X^ = do + di In PDt + d2
In Y^ + d3
In PX^ + d4
In PX^-^ + v^ d s In X^ = In X^ 10 11 12As in the case of im port function, there is an adjustment function. This function relates the change in exports to the difference between demand fo r exports in th is period t and actual exports in the previous period to overcome the possible m isspecifaction due to the equilibrium.
X^_l and PX^-i are the lagged value of exports and unit value of exports respectively. Dynamic export demand is determined as the equilibrium case except the lagged value of exports is added to the rig h t hand side. Also in the supply equation the lagged value of export price index is added as an explanatory variable.
The three endogenous variables are PX, X^ , X® , w hile the six predetermined variables in the model are PD, Y, x^_|, and PX|_|. Equation (10) is overidentified and can be estimated by 2SLS. This equation is also estimated by OLS.
3.2. Methodology of Estim ation;
In the international trade area export and im port demand relationships are determined m ostly in linear and loglinear form. Linear specification is used i f the prim ary aim is forecasting (Khan and Rose, 1977:150). However loglinear form performs superior f i t and provides easy interpretation, therefore i t is prefered to linear form. Loglinear specification provides the constant e la s tic itie s , that means i t prevents the change in the e la s tic ity as the dependent variable changes. In th is way we avoid the problem of drastic fa lls in price e la s tic ity as im ports or exports rise. Also loglinear specification allow s the dependent variable to react proportionally to a rise or fa ll in the explanatory variables (Italianer, 1986:21).
Import and export demand equations can be estimated by using OLS method. However, unless we assume that supply price e la s tic itie s are in fin ite or at least large, so that price of im port can be treated as exogenous, there is p o s s ib ility of obtaining biased and inconsistent e la s tic ity estim ates (Khan, 1975:680).
Simultaneous relationship between price and quantity can be described by introducing the supply function and inconsistency can be removed by using simultaneous equation techniques like 2SLS.
Omission of the role of quantitative re s tric tio n s on im ports and exports can lead to m isspecification in the estimation. Correlation between quantitative re s tric tio n s and e ith e r of the explanatory variables causes the estimated e la s tic itie s to be biased and inconsistent. Even th is does not occur, i f there is a serial correlation in re s tric tio n s then the e rror terms w ill not be independent. So the co e fficie n t of autocorrelation can be considered as an indicator of re strictio n s. A f ir s t order autoregressive process fo r the e rror term s can be specified as;
Pi tit-1 ■·■
* ®2t
| p j < l ; | p j < i
where
Crt«ND(0,a^) i = 1,2
Adjustment fo r autocorrelation, therefore, w ill correct fo r bias in the co e fficie n ts and th e ir standard errors (Khan, 1974:683).
In the case of a serial correlation, we must do reestim ations of these equations using the f ir s t order Cochrane-Orcutt ite ra tiv e
technique. This p a rticu la r method could be used conveniently os on option in the regression program used.
In Cochrane estim ation we set
where the u‘s are the errors from the tranformed estim ating equations . Both dependent (e.g. M) and independent variables in the transformed equations can be w ritte n as - pM^_|. The equation above and the transformed equation are estimated a lterna tive ly u n til successive values of p d iffe r by no more than 0.001 (Hauthakker& Magee, 1969:124).
3.3. Findings of Study :
3.3.1 Im p o rt Function :
The OLS and 2SLS results fo r equilibrium im port demand are presented in table l.a. and l.b. respectively.
OLS results indicate that the regression co efficie nts of price and income are sig n ifica n t at 5 X and 1 % significance levels. They have expected signs. determinant indicates that there is serious m u ltic o llin e a rity between explanatory variables. Besides DW s ta tis tic s and Geary te st at 1i? and 5% levels show that there is a
So the model is estimated again by using Cochrane-Orcutt type procedure. Results of th is estim ation are shown in table 2. We see that the estimated price and income co efficie nts are sig n ifica n t at 1/5 and 5/5 levels, and they have expected signs. The R^ is 0.8650, indicating moderate f i t of the model. This shows that about 8 7 ^ of variation in im port demand is explained by the relative price and domestic income variations.
The re su lt of F te st shows that model is sign ifican t as a whole at 5 X and 1 % levels fo r th is estimation. The determinant approaches to one, therefore there is no serious m ulti col line arity. DW s ta tis tic s is greater than the upper c ritic a l bounds of d test. So th is indicates that there is no autocorrelation. Geary te st result also agrees w ith the DW s ta tis tic s .
serial correlation in the model.
2SLS results of the estimated co efficie nts show that they have expected signs, however price co e fficie n t is insignificant at 5 ^ level. R^ in the case of simultaneous estim ation does not show fitn ess of equation, because i t is bounded w ith (-oo,1), not (0,1). R^ between observed and predicted gives more accurate result fo r the fitn e ss of the model, and i t is 0.7436. DW s ta tis tic s and geary te st show that there is autocorrelation at 5 ^ and 1^ levels. Rj^ determinant shows no m u ltic o llin e a rity .
T ABLE 1 .a OLS R esult o f E quilibrium Im port Demend Function R-square Verience of estimate· F DW 0.8009 0.034501 28.152 0.846 explained unexplained total Analysis of variance 1.9426 0.48302 2.4256 variable name Iprt lydt intercept Estimated coefficient -0.49004 1.9751 -14.656 standard error t-ratio 12 df 0.18176 0.30682 2.60216 -2.6961 6.4373 -5.6335
variance -covarienoe matrix of coefficients
Iprt 0.03304
lydt -0.04393 0.09414
int 0.3786 -0.7979
Iprt lydt int
correlation matrix of coefficients
Iprt 1 ywt -0.78776 1 int 0.80073 -0.99962 Iprt ydt 0.6769 24
T ABLE 1 .b 2SLS R«su1t o f E quilibrium Im port Demand Function
R-square bet. o&p »
Variance of estimate· F DV = 0.7436 0.037007 0.7384 explained unexplained total Analysis of variance 1.5349 0.5293 2.0642 variable name Iprt lydt intercept Estimated Doeffioient -0.273 1.5685 -7.1968 standard error t-ratio 12 df 0.19542 0.30944 2.0137 -1.3969 5.0688 -3.574
variance -covariance matrix of coefficients
Iprt 0.03819
lydt -0.0465 0.09575
int 0.2307 -0.6035
Iprt lydt int
0.4055
correlation matrix of coefficients
Iprt 1
y v t -0.7689 1
int 0.58619 -0.9685
Iprt ydt
T ABLE 2 Result of Least Square Estimation by Cochrane-Orcutt Type Procedure of Equilibrium Import Demand Function
R-square Variance of estimate· F DV 0.865 0.023392 1.7088 explained unexplained total Analysis of variance 2.0981 0.32749 2.4256 variable name Iprt lydt intercept Estimated coefficient -0.47483 2.0146 -14.963 standard error t-ratio 12 df 0.17086 0.37351 3.1297 -2.779 5.3938 -4.781
varience -covarience matrix of coefficients
Iprt 0.02919
lydt -0.03928 0.1395
int 0.3381 -0.01168
Iprt lydt int
0.9795
correlation matrix of coefficients
Iprt 1
ywt -0.61555 1
int 0.6322 -0.99942
Iprt ydt
So i t is clear that least square estim ation by Cochrane-Orcutt type procedure performs w ell in estim ating equilibrium im port demand, however 2SLS result does not perform as w ell.
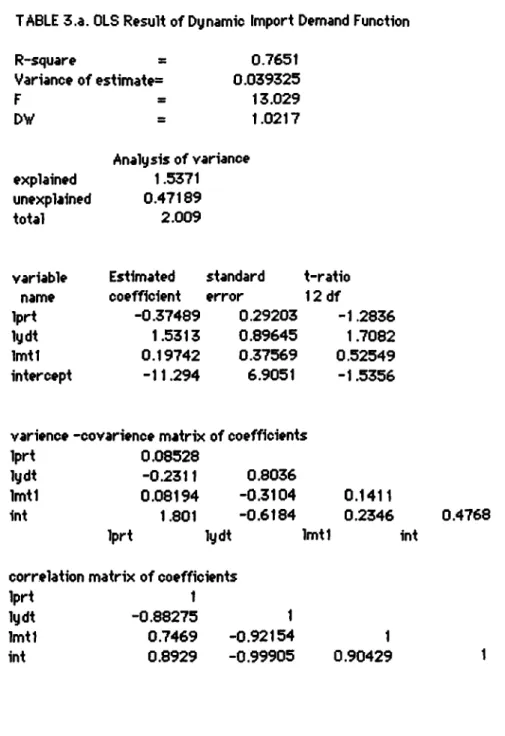
The results fo r dynamic case of im port function, estimated by both OLS and 2SLS, are shown in table 3.a. and 3.b. respectively.
Although regression co efficie nts fo r price and income have the expected signs, they are both in sig n ifica n t at 5 ^ level in both OLS and 2SLS estim ations. Also logged value of im ports is in sig n ifica n t at th is level. As we look at the correlation m atrix, i t is apparent that there is a high correlation between explanatory variables. The high and in sig n ifica n t explonotory variables also indicate this. The h te st illu s tra te s that there is negative autocorrelation. We con conclude that the dynamic model is not suitable fo r estim ating the im port demand function fo r Turkey.
So based on the least square estim ation by Cochorone-Orcutt ite ra tiv e technique, the estimated im port demand equation is w ritte n as;
PMt
In Mt= - 14.963 - 0.47483 In (-----)+
2.0146 In YD* ^ PDt (3.1297) (0.17086) (0.37351) 27TABLE 3.a. OLS R esult o f Dynam ic Im port Demand Function R-square = 0.7651 Variance of estimate» 0.039325 F s 13.029 DV = 1.0217 Analysis of variance explained 1.5371 unexplained 0.47189 total 2.009
variable Estimated standard t-ratio
name coefficient error 12 df
Iprt -0.37489 0.29203 -1.2836
lydt 1.5313 0.89645 1.7082
Im tl 0.19742 0.37569 0.52549
intercept -11.294 6.9051 -1.5356
varience -covarience matrix: of coefficients
Iprt 0.08528
lydt -0.2311 0.8036
Im tl 0.08194 -0.3104 0.1411
int 1.801 -0.6184 0.2346
Iprt lydt Im tl
correlation matrix of coefficients
Iprt 1 lydt -0.88275 1 Im tl 0.7469 -0.92154 1 int 0.8929 -0.99905 0.90429 0.4768 int 28
TABLE 3 .b . 2SLS R esult o f Dynamic Im port Demend Function
R-square bet. o&p =
Variance of estimate= F DV 0.7731 0.032695 0.9749 explained unexplained total Analysis of variance 1.3367 0.39234 1.729
variable Estimated standard t-ratio
name coefficient error 12 df
Iprt -0.070665 0.2419 -0.29213
lydt 0.59385 0.70942 0.8371
Im tl 0.567589 0.35054 1.6192
intercept -2.5648 3.6483 -0.70301
varience -covarience matrix of coefficients
Iprt 0.05851 lydt -0.1442 0.5033 Im tl 0.05857 -0.2262 int 0.6868 -0.2539 Iprt lydt Im tl 0.1299 0.1069 0.1331 int correlation matrix of coefficients
Iprt lydt Im tl int 1 -0.84022 0.69076 0.77825 1 -0.90946 -0.98105 1 0.83581 29
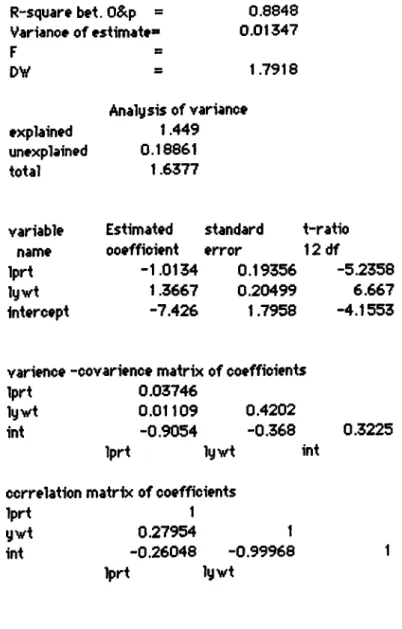
Table 4.0. and 4.b. indicate results of the equilibrium export demand function estimated by OLS and 2SLS respectively.
Regression co e fficie n ts of price and income ore both sig n ifica n t individually at 5 X and 1 % significance levels. The parameter estim ators fo r the price and income hove the expected signs from the theory.
is 0.8848 fo r OLS. This re su lt shows that the OLS estim ation of demand equation fo r Turkey’s exports yields a w ell f it . This means alm ost 89 percent of variation in export demand fo r Turkey is explained by variations in the re la tive prices and world income level. As explained e a rlie r R^ is not w ell indicator of fitn e ss fo r 2SLS estim ations. R^ between observed and predicted is 0.8848.
Since calculated F value is greater than the table F value, the model is s ig n ific a n t as a whole at 5% and significance levels fo r OLS estim ations. There is no correlation between explanatory variables, since Rj^ determinant approaches to one. This indicates that there is no serious m u ltic o llin e a rity in the models estimated by OLS and 2SLS.
The DW s ta tis tic s also perm its us to re je c t any hypothesis of autocorrelated e rro r terms at 5% and ]% significance level. Since
3 .3 .2 . E x p o rt F u c tio n :
T ABLE 4 .a. OLS R esult o f E quilibrium E xp o rt Demand Function R-square Variance of estimate= F DV 0.8848 0.01347 53.788 1.7918 Analysis of variance explained 1.4491 unexplained 0.18858 total 1.6377 variable name Iprt lywt intercept Estimated coefficient -1.006 1.3689 -7.4798 standard error t-ratio 12 df 0.1689 0.203 1.7806 -5.9879 6.7434 -4.2008
variance -covariance matrix of coefficients
Iprt 0.02823
lywt 0.008357 0.04121
int -0.06822 -0.9394
Iprt ly v t int
0.317
correlation matrix of coefficients
Iprt 1
ywt 0.24504 1
int -0.22803 -0.99972
Iprt lywt
TABLE 4.b.2SLS R esult o f E quilibrium E xp o rt Demand Function
R-square bet. O&p =
Variance of estimate» F DV 0.8848 0.01347 1.7918 explained unexplained total Analysis of variance 1.449 0.18861 1.6377 variable name Iprt lywt intercept Estimated ccefficient -1.0134 1.3667 -7.426 standard errcr t-ratio 12 df 0.19356 0.20499 1.7958 -5.2358 6.667 -4.1553
varience -covarience matrix of coefficients
Iprt 0.03746
lywt 0.01109 0.4202
int -0.9054 -0.368
Iprt lywt int
ccrrelation matrix of coefficients
Iprt 1 ywt 0.27954 1 int -0.26048 -0.99968 Iprt lywt 0.3225 3 2
calculated d is greater than the upper c ritic a l bound fo r positive autocorrelation. Also geary te st gives the same result.
The closeness of OLS and 2SLS results indicates that there is no sim ultaneity bias in OLS estim ation fo r Turkey’s export demand. Both methods are reliable in measuring e la s tic itie s .
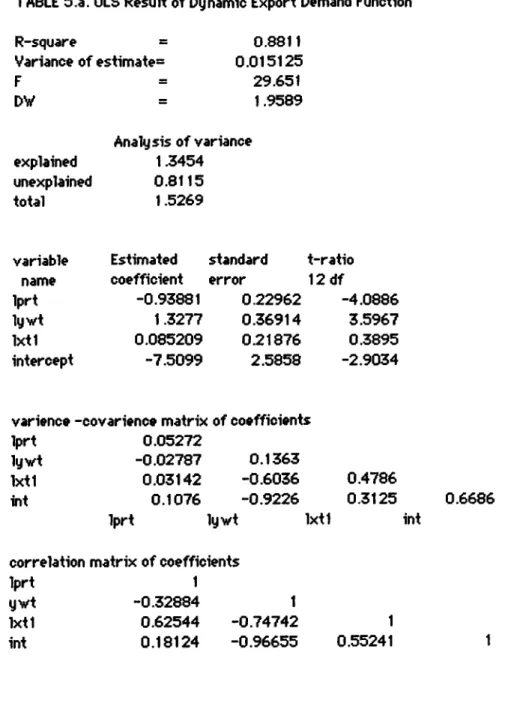
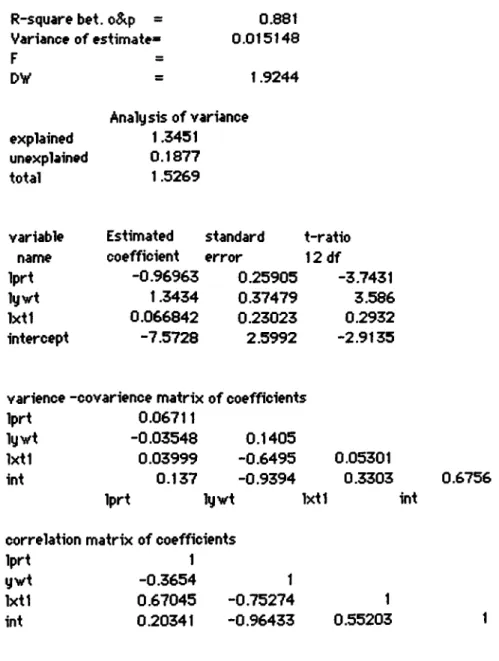
Dynamic case results are given in table 5.a. and 5.b. Only income and price term s are s ig n ifica n t individually at 5 S significance level and have the expected signs. Lagged export value is found in sig n ifica n t fo r both OLS and 2SLS estim ations.
is 0.8811 and between observed and predicted is 0.8810 fo r OLS and 2SLS estim ations. F te st shows that the models ore s ig n ifica n t as a whole at 5% and IS levels. So the significance of the models as whole but in sig n ifica n t lagged export values are the indication of serious m u ltic o llin e a rity . The h te st indicates that there is no autocorrelation fo r both OLS and 2SLS estimations. Although the models are sig n ifica n t as a whole and there is no serial correlation, insignificance of the lagged export value and existence of m u ltic o llin e a rity indicate that dynamic case does not w ell explain export demand function.
Consequently considering the closeness of OLS and 2SLS results we can take the result of OLS estim ation as the explanation of export demand function fo r Turkey. The found equation is;
TABLE 5 .a. OLS R esult o f Dynam ic E xp o rt Demand Function R-square c 0.8811 Variance of estimate^ 0.015125 F 29.651 DV = 1.9589 Analysis of variance explained 1.3454 unexplained 0.8115 total 1.5269
variable Estimated standard t-ratio
name coefficient error 12 df
Iprt -0.93881 0.22962 -4.0886
lywt 1.3277 0.36914 3.5967
Ix tl 0.085209 0.21876 0.3895
intercept -7.5099 2.5858 -2.9034
variance -covariance matrix: of coefficients
Iprt 0.05272
ly v t -0.02787 0.1363
Ix tl 0.03142 -0.6036 0.4786
int 0.1076 -0.9226 0.3125
Iprt lywt Ix tl
correlation matrix of coefficients
Iprt 1 y v t -0.32884 1 Ix tl 0.62544 -0.74742 1 int 0.18124 -0.96655 0.55241 0.6686 int 3 4
TABLE S.b. 2SLS R esult o f Dynam ic E xp o rt Demand Function
R-square bet. o&p = 0.881
Variance of estimate* 0.015148 F = DV = 1.9244 Analysis of variance explained 1.3451 unexplained 0.1877 total 1.5269
variable Estimated standard t-ratio
name coefficient error 12 df
Iprt -0.96963 0.25905 -3.7431
lywt 1.3434 0.37479 3.586
Ix tl 0.066842 0.23023 0.2932
intercept -7.5728 2.5992 -2.9135
varience -covarience matrix of coefficients
Iprt 0.06711
lywt -0.03548 0.1405
Ix tl 0.03999 -0.6495 0.05301
int 0.137 -0.9394 0.3303
Iprt lywt Ix tl
correlation matrix of coefficients
Iprt 1 ywt -0.3654 1 Ix tl 0.67045 -0.75274 1 int 0.20341 -0.96433 0.55203 0.6756 int 35
d PX*
In Xi = -7.4798 - 1.0060 In (— + 1.3689 In
(1.7806) (0.16801) (0.20300)
3 .3 .3 E la s tic itie s :
Table 6: Equilibrium E la s tic itie s of Import and Export Demand Parameters_________ Imports___________ Exports
Price Income .47483 2.0146 1.0060 1.3689
From table 6, the aggregate price and income e la s tic itie s fo r im port demand is .0.47483 and 2.0146 respectively. This results disagree w ith Khan’s results but agrees w ith Tansel and Togan’s findings.
This low price e la s tic ity means i f im port prices increase, im port demand w ill fa ll less than th is increase. This shows that the re la tive prices have no sig n ifica n t e ffe ct on Turkey’s imports. So one can not expect improvement in the BOP os a resu lt of devaluation. As a developing country, Turkey is expected to have in e la stic price e la s tic ity , considering the composition of imported goods. Turkey’s im ports consists m ostly of raw m aterials and interm ediate goods which have ine lastic demands. Our results seems to re fle c t the im port structure of the country.
In the developing countries the income e la s tic ity of im port demand is usually greater than the income e la s tic ity of th e ir export demand. The re su lt of our study is consistent w ith th is fact. The income e la s tic ity of demand fo r im ports is greater than unity. Since Turkey is in growth process, she needs more investment to increase income level of the country. In other words, she has high marginal ca p ita l/ou tp ut ratio. In order to create one additional unit income, she must increase her investment more than one unit. This means an increase in im ports of capital goods as income grows.
The resu lts of th is study show that increase in income w ill lead to 2.145K increase in im port demand. So th is w ill lead to the trade d e fic it expectation in the case of income growth. In addition, the income e la s tic ity of exports is less than the income e la s tic ity of im ports . So i f the growth rate in Turkey is in line w ith the rest of the w orld and prices remain the same, trade balance turns unfavor of Turkey (Johnson, 1958:chp 4).
The estim ated price and income e la s tic itie s of export demand fo r Turkey ore 1.006 and 1.3689 respectively. This result is s im ilia r to Khan’s, and Tansel and Togon’s findings in respect to be greater than unity.
Since Turkey faces w ith the price e la stic export demand, price variations w ill e ffe c t the export demand. If export prices increase
one percent, th is w ill lead to decrease in quantity demanded s lig h tly more than one percent.
Turkey is m ostly primary commodity exporter. The great part of her exports is made up of agricultural products like hazelnut, cereals, cotton, tobacco, orange e tc ., and agricultural products hove in e la stic demand in nature. However our results indicate that she has e la stic demand. This may result from that Turkey supplies only port of the p a rticu la r commodities in the w orld trade. Although prim ary commodities have ine lastic demand, i f a country supply only small part of these, then she can face w ith e la stic demand curve. If th is country makes devaluation, im porters w ill buy from her (Wells, 1973:182). Also, we con odd that the shore of the manufactured goods in exports increased from 36 percent to 72.1 percent and the shore of the ogricultured goods in exports deceased from 57.4 percent to 24.5 between 1980 and 1984. So the changing composition of the export goods from ine lastic agricultural products to e la stic manufactured products may also result in the e la stic demand fo r Turkey’s exports.
The income e la s tic ity fo r Turkey’s exports is greater than unity. This means i f the income in the rest of the world increases by one percent th is w ill lead to 1.3689 percent increase in export demand fo r Turkey other things being equal.
The long run price and income e la s tic itie s fo r export and im port
demonds con be calculated from the dynamic form os fo llo w s;
Price/lncome e la s tic ity 1- Lagged export/Im port
e la s tic ity
of
Table 7. Long run Estimates of The Price and Income E la sticitie s
Export and Import Demands
pqre.mQt.er?_______ Imports Exports
Price 0.467 1.026
Income 1.9079 1.450
Table 7 gives the calculated long run e la s tic itie s . These results are very s im ila r to the equilibrium e la s tic itie s . In the long run im port demand is again price ine lastic but Income ela stic, and export demand is price and income elastic.
To measure speed of response when the equation is displaced from equilibrium , the median lag is used. It is calculated as;
_________log 0.5_________ log of e la s tic ity of lagged
export and im port
The median lags fo r im ports and exports are 0.472 and 0.28 periods respectively. Thus Turkey's speed of response in the event of a s h ift from equilibrium in the case of devolution policy is found to be very slow and adjustment w ill be very d iffic u lt in the export and
the Im port sectors.
3 .3 .4 A p p lic a tio n of Marshal 1-Lerner Condition
The re s tric te d form of Marshal 1-Lerner condition (Harberger condition), which is necessary and s u ffic ie n t condition fo r successful devaluation, is M nm + Hx > 1 + m n^= 0.47483 n^= 1.006 m = ^ = 2.014(^) In 1978, b illio n of lira s M =113.29 X = 55.36 V = 1290.7 Therefore m=2.014( 113.29/1290.7)=0.1768
So, the Marshall-Lerner condition is;
(113.29/55.36)*0.47483+1.006= 1.9777 > 1.1768
Thus the M arshall-Lerner condition is fu llfile d in Turkey.
In th is study, the price and income e la s tic itie s fo r im port demand of and export demand fo r Turkey ore estimated. We also te st the effectiveness of the devaluation in correcting BOP d e fic it in Turkey.
The results of the study show that Turkey has ine lastic im port demand function, indicating rela tive prices have no role in the determination of the volume of imports. However, estimated price e la s tic ity fo r export demand is greater than unity,indicoting e la stic demand. So favorable changes in re la tive prices w ill resu lt in increasing export demand fo r Turkey.
Income e la s tic itie s fo r export and im port demand both ore greater than unity. So income is an im portant fa c to r in determining Turkey’s export and im port demands. The results also illu s tra te that i f Turkey and the rest of the world grow and in fla te at the same rote, the trade balance w ill turn unfovor of Turkey. This is due to fa ct that the income e la s tic ity of im port demand is higher than the income e la s tic ity of export demand.
The equilibrium cases yield b etter f i t than disequilibrium cases, on a yearly bases. OLS and 2SLS results ore both e ffic ie n t and close to each other in the estim ation of the export demand function. This may be the indication of that OLS estim ation does not create
4 . CONCLUSION :
sim ultaneity bias in a small country case. However, th is is not the case in im port demand function. OLS resu lt indicates best estimation. It was found that the degree of autocorrelation, which is accepted as an indicator of om itted quantitative re s tric tio n s in the study, is greater in the im port function than the export function. This re su lt is consistent w ith the view that re strictio n s are more
im portant in the determination of im ports than of exports.
As a basic conclusion. Marshal 1-Lerner condition is sa tisfie d in correcting Turkey's balance of payment problem through devaluation.
REFERENCES
Ball, R. J. & Mavwah, K. 1962 " The US Demand For Imports 1940-1958“ Review of Economics and S ta tis tic s vol 44:395-401 Dutta, M. 1964 "A Prototype Model Of Indian's Foreign Sector" International Economic Review . vol 5:82-103
Economic Report 1985,1986 Union of The Chambers Of Commerce Industry M aritime, Trade and Commodity Exchanges of Turkey
Oandolfo, Oiancarlo 1987 International Economij 2 New Vork: Springer-Verlag
Ghartey, E. Edward 1987 "Devaluation as a Balance of Payment Corrective Measure in Developing Countries: A Study Relating to Ghana" Applied Economics ,vo1 19:937-947
Harberger , A. C. 1959 "Some Evidence in The International Price Mechanism" Review of Economics and S ta tis tic s .vol 40:123-127 Hauthakker , H. S. and Magee S. P. 1969 " Income and Price E la s tic itie s in The World Trade" Review of Economics and S ta tis tic s , vol 51:111-125
Hazard, R. Baharat 1986 International Trade . Theoratical Issues. Newyork: Newyork U niversity Press
Hodgson, Johns and Herrander, Mark 1983 International Economic Relations , New Jersey: Prentice Hall Press
International Financial S ta tis tic s , various issues
Italianer, Alexander 1986 Theory and Practice of International Linkage Models. Boston: M. Nishoff
Johnson, Harry 1958 International Trade and Economic Growth. Massachusettes: Harvard U niversity Press
Kozgon, Gülten 1985 Ekonomide Pisa Acık Büyüme. İstanbul: A ltın K ita p lo r Yayınları
Kepenek, Yahya 1986 Türkiye Ekonomisi. Ankara: Savaş Yayınları Khan, S. M. 1974 “ Import and Export Demand in Developing Countries“ IMF S ta ff Papers, vol 21:678-692
Khan, S. M. and Rose Z. K. 1977 “ The Functional Form of Aggregate Import Demand Equation“ Journal of International Economics vol 30:149-160
Kreinin, M 1971 International Economics. A Policy Approach· New York: Harcourt Brace Jovanovich, Inc.
OECD Main Economic Indicators, various issues
Orcutt, G. H. 1950 “Measurement of Price E la s tic itie s in International Trade“ Review of Economics and S ta tis tic s vol 32:117-132
Tansel , A and Togan S. 1987 “Price and Income Effects in Turkish Foreign Trade“ W e ltw irtsch a ftlich e s Archiv vol 123:521:534
Turnovsky, Stephan J. 1968 “ International Trading Relationship fo r a Small Country: The Case of New Zeland“ Canadian Journal of Economics, vol 1:772-792
Wells, J. Sidney 1973 International Economics , New York: Atherton Press, Inc.
Wiliamson, John 1983 The Open Economy and World Economy. New York: Basic Books