Detection of Microcalcifications in Mammograms Using
Nonlinear Subband Decomposition and Outlier Labeling
M. Nafi Gürcan, Yasemin Yardimci, A. Enis cetin
Bilkent University,
Dept. of Electrical and Electronics Engineering,
Bilkent, Ankara TR-06533, Turkey
E-mail: cetin©ee.bilkent.edu.tr
Rashid Ansari
Univ. of Illinois at Chicago
Department of Electrical Engineering
Chicago ,
Illinois,
60607-7053
ABSTRACT
Computer-aided diagnosis (CAD) will be an important feature of the next generation
Pic-ture Archiving and Communication Systems (PACS). In this paper, computer-aided detection of microcalcifications in mammograms using a nonlinear subband decomposition and outlier label-ing is examined. The mammogram image is first decomposed into subimages uslabel-ing a nonlinear subband decomposition filter bank. A suitably identified subimage is divided into overlapping
square regions in which skewness and kurtosis as measures of the asymmetry and impulsive-ness of the distribution are estimated. A region with high positive skewimpulsive-ness and kurtosis is
marked as a region of interest. Finally, an outlier labeling method is used to find the locations of microcalcifications in these regions. Simulation studies are presented.
1 Introduction
Computer-aided diagnosis (CAD) will be an important feature of the next generation Picture Archiving and Communication Systems (PACS) . In this paper, computer-aided detection of
microcalcifications in mammograms is considered. Presence of microcalcification clusters is an
early sign of breast cancer in women though they can be easily overlooked by an examining
radiologist due to their small sizes.
Recently a variety of schemes based on the wavelet transform for the computerized detection of microcalcifications have been proposedY3 In these schemes, the mammogram image is first passed through a subband decomposing filter bank. The subband images are weighted to enhance the microcalcification locations. A new image is reconstructed from the weighted sub-images.
In the detection step, global and local gray-level thresholds are applied to the reconstructed
image to extract possible microcalcification locations. These locations are grouped to identify microcalcification clusters. 1n13 the reconstructed image corresponds essentially to a bandpass
filtered version of the original mammogram image and it should be noted that the detection
techniques proposed in13 are based on subband decomposition using linear filter banks.
In our method microcalcification detection is carried out using a signal decomposition based on nonlinear filters. The method takes advantage of the recently proposed methods of
nonlin-ear filter banks for application in compression.69 The study was motivated by the impulsive nature of the data characterizing the microcalcifications which are isolated well by nonlinear
filters. The processing is simple, and does not require a full decomposition and reconstruction. Microcalcifications vary in size from 0.01 mm2 to 1.0 mm2 and they appear as short pulses. Since microcalcifications are small and isolated regions, they produce outliers in the high-band
sub-signal. The problem is then reduced to that of detecting outliers in the high-band component,
obviating the need for signal reconstruction. Statistical procedures for detection of the microcal-cifications are applicable at this stage. The highband subsignal is first divided into overlapping
square regions in which skewness and kurtosis as measures of the asymmetry and impulsive-ness of the distribution are estimated. A region with high positive skewimpulsive-ness and kurtosis is
marked as a region of interest. Finally, an outlier labeling method5 is used to find the locations of microcalcifications in these regions. The block diagram of the detection scheme is shown in Figure 1.
In Section 2, various nonlinear subband decomposition methods are briefly reviewed. The statistical detection procedure used in our method is described in Section 3. Simulation studies are presented in Section 4. Finally, conclusions are presented in Section 5.
INPUT
x
Figure 2: Nonlinear Subband Decomposition Structure in [6]
2 Nonlinear Subband Decomposition Structures
The subband decomposition using linear filters have been widely used in signal analysis and coding. Recently, the subband decomposition using nonlinear filters have been proposed and used in image coding.69 In this paper, the use of nonlinear subband decomposition in the analysis of mammogram images is investigated.
A nonlinear subband decomposition structure with perfect reconstruction property is shown
in Figure 2.6 In the decomposition part, the input signal x is just downsampled in the upper
branch, while it is filtered by the nonlinear filter I —M(.) and then downsampled in the lower branch. The outputs after the downsampling by two are x1 and Xh which represent the low- and high-band sub-signals, respectively. The class of nonlinear filters providing perfect reconstruction is described in Reference.6
Another nonlinear subband decomposition structure with perfect reconstruction property is
shown in Figure 39 In this structure H and G are nonlinear operators, and they produce the
low subband signal, Ya, and the detail high subband signal, Yd from the input signal x(n)9:
where xi(n) =x(2n—
1),x2(n) =x(2n) and
Yd(fl) = X2(fl)+ H(xi (n)) (1)
Ya(fl) =
x(n)
—G(yd(n)) (2)
xi(n) = (x1(n
—
N1),.. . ,xi(n),.. . ,xi(n
+
N2)),Yd(fl) = (yd(n—N3),...,yd(n),...,yd(n+N4)),
andN,, N2, N3, N4 are positive integers. This structure can be extended to two dimensions using
either rectangular or quincunx subsampling methods."2
In this work H is chosen to be a median filter with an M x M square region of support and
_______ ________________LOW SUBBAND BOXPLOT INPUT ________ _________________
I SUBBAND STATISTICAL
_______________ OUTLIER NONLINEAR HIGHER ORDER
HH__DETECTION
IMAGE _______________
ANALYSIS DECOMPOSITION
HIGH SUBBAND
Figure 1: Microcalcification Detection Scheme
x (n)
y(n)
y(n)
d
are chosen in accordance with typical dimensions of the microcalcifications. It should be noted
that erosion and lower-a trimmed mean type filters can also be used for the H filter. After the
subband decomposition, the sub-signal Ya will contain an enhanced version of the original signal while mainly microcalcifications are observed in the so-called highband sub-signal Yd•
3 Statistical Detection Method
An outlier is "an observation (or subset of observations) which appears to be inconsistent with the remainder of that set of data." Generally, due to the random nature of data, iden-tifying and handling outliers is not an easy task. Nevertheless, there are numerous techniques
available to detect and handle outliers.5 Since microcalcifications are tiny isolated regions, they produce outliers in the high-band subsignal. Therefore the microcalcification detection problem is equivalent to outlier detection in the high-band subimage.
In this paper, the detection is carried out in two steps. First, the highband subimage is
divided into overlapping square regions. In these regions, skewness and kurtosis, measures of the asymmetry and impulsiveness of the distribution are estimated. If a region has high positive
skewness and kurtosis then it is marked as a region of interest. In the second stage an outlier
labeling method is used to find the locations of microcalcifications in these regions.
The computational complexity of the overall system is low. Rather than searching the whole
image for outliers only regions with high susceptability are processed by the outlier labeling
method.
3.1 Skewness and Kurtosis Based Tests
Skewness and kurtosis are higher order statistical parameters.'3 For a random variable x, the skewness is defined as'4
E[(x —E[x])3]
=
(E[(x
-
E[x])2J)3/2 (3)and is a measure of the symmetry of the distribution. An estimate of the skewness is given
by:
_________
73=(N—1)&3 (4)
where 7:17, and & are the estimates of the mean and standard deviation over N observations x
(i=1,...,N).
Similarly, for a random variable x the kurtosis is defined as
E[(x —E{x])4]
4-
(E[(x-E[x])2])2-3
(5)and is a measure of the heaviness of the tails in a distribution. An estimate of the kurtosis is
given by:
_______
74—
(N—1)&4 (6)
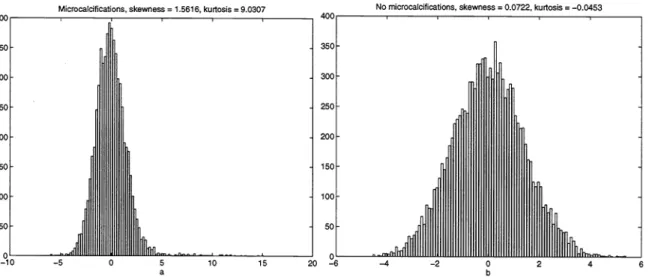
where n-i and 8- are defined as before. For the Gaussian distribution 'y3 and are equal to zero. If a region contains microcalcifications then due to the impulsive nature of microcalcifications
the symmetry of the distribution of highband subirnage coefficients is destroyed as shown in Figure 4. It is also evident that the tails of the distribution are heavier and hence the kurtosis
assumes a high value. Therefore a statistical test based on skewness and kurtosis is effective in finding regions with asymetrical and heavier tailed distributions. The detection problem is posed as an hypothesis testing problem in which the null hypothesis, H0, corresponds to the case of no microcalcifications against the alternative H1:
•H0
:y3<T1or74<T2•H1
whereT1 and T2 are experimentally determined thresholds.
Once the regions containing microcalcifications are determined by the above test the locations
of the microcalcifications are estimated by the outlier labeling method described in the next subsection.
3.2
Boxplot Outlier Labeling Method
In this work, we used the so-called boxplot outlier labeling method5 which is available in most of the statistical software packages. In this method data x is first rank ordered,
350 300 250 200 150 100 50
Microcalcifications, skewness = 1.5616, kurtosis = 9.0307 No microcalcificstions, skewness = 0.0722, kurtosis = —0.0453
______________________________ 40C
-,
5 10 15 20 —6
Figure 4: Sample value distributions in regions with cification in the bandpass subband image
* * *
Qi =
X(f)Q3 =
Median * :Outliers k RF(a) microcalcifications and (b) no
microcal-Q3
* * * *
Q3+kP
Figure 5: Boxplot outlier labeling method definitions
350 300 250 200 150 100 50 0 —10 —5 —4 —2 0 2 4
x = {x1,x2 ,
x}.
Next, the median, the lower quartile, Qi and the upper quartile Q valuesare determined through the following formulas in Equations 7-9.
I =
[(n+ 1)/2] + 1(7) (8) (9)
where [y] represents the greatest integer less than or equal to y. The interquartile range RF is defined to be Q _Qi. Theboxplot method determines the outliers to be the part of data which
is outside the region (Q —kRF,Q + kRF). The parameter k is usually taken to be 1.5 or 3.0.
4 Simulation Results
In this paper, simulation studies are carried out on mammogram images taken from a set
digitized by Nico Karssemeijer of University Hospital Nijmegen, The Netherlands. Each image
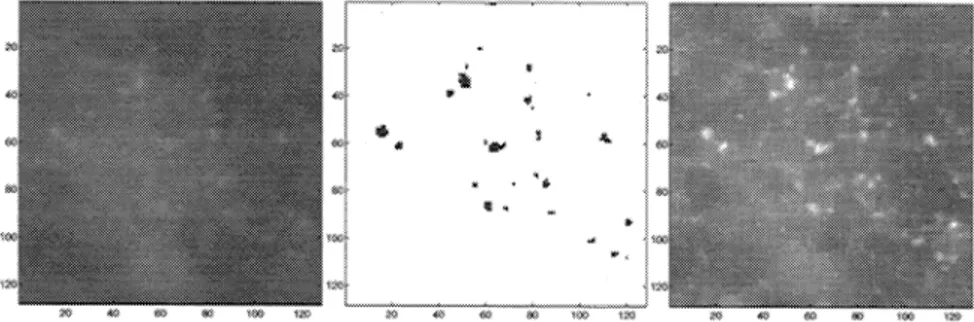
in the set also contains a ground truth file, in which the regions with microcalcifications are indicated by expert radiologists. In Figure 6(a) a part of a mammogram image is shown. This particular image contains a cluster of microcalcifications. The image is first processed by the
nonlinear filter bank and the highband subimage is produced. The support of the median filter
is a 21 x 21 region. In Figure 6(b), the result of the higher order statistical hypothesis testing algorithm is shown. The black squares indicate suspicious regions. The proposed detection
scheme is successful in finding all the critical regions in this example and in tests with 10 different mammogram images of size 2048x2048. The size of the square regions is chosen to be 30x30 with an overlap of 15. The experimentally determined thresholds for skewness 'y and kurtosis are
1.0 and 2.0, respectively.
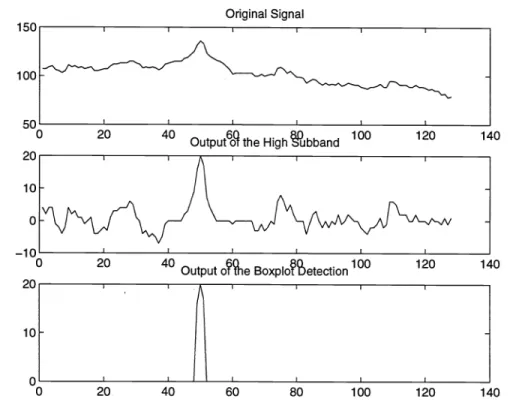
Boxplot outlier labeling method is applied to the suspicious regions determined by the hy-pothesis testing. For example, Figure 7 shows a horizontal line of mammogram image which is known to contain a microcalcification. In the same figure the middle plot depicts the difference between the original signal and its median filtered version. This difference plot corresponds to the
high-subband of the nonlinear decomposition structure. The bottom plot illustrates the output
of the outlier detection scheme. Figure 8 shows the output of the detection scheme on a part of Figure 6: (a) A part of a mammogram image, (b) Regions with microcalcificati ons
1u I I I I 100 50 I 0 20 40 OutputtheHighubband 100 120 14 20
5 Conclusions
Computer-aided diagnosis (CAD) will be an important feature of the next generation Picture Archiving and Communication Systems (PACS). In this paper, automatic detection of microcal-cifications in mammogram images is considered. The mammogram image is first processed by a nonlinear subband decomposition filter bank. Microcalcifications, tiny, isolated regions, produce outliers in the highband subimage. Next, the so-called highband subimages is divided into over-lapping square regions in which skewness and kurtosis are estimated. The higher order statistical parameters, skewness and kurtosis are measures of the asymmetry and impulsiveness of the dis-tribution. Therefore a region with high positive skewness and kurtosis is marked as a region of interest. Finally, an outlier labeling method is used to find the locations of microcalcifications in these regions.
Simulation results show that this method is successful in detecting regions with microcalcifi-cations.
Original Signal
0
ij]\11
20 40Output o?be Boxplo?etection100 120 140
140
Figure7: (a) A horizontal line of the mammogram image which is known to contain a
microcal-cification, (b) high-band sub-signal Xh, (c) output of the outlier detection method.
Figure 8: (a) A region of a mammogram image containing microcalcifications, (b) output of the detection scheme (c) enhanced image Ya(thelow subband image) in Figure 3.
6 REFERENCES
[1] H. Yoshida, K. Doi, R. M. Nishikawa, "Automated detection of clustered microcalcifications
in digital mammograms using wavelet transform techniques," Proc. SPIE Tnt. Conf. on
Visual Commun. and Image Proc., 2167:868-886, 1994.
[2] H. Yoshida, W. Zhang, W. Cai, K. Doi, R. M. Nishikawa and M. L. Giger, "Optimizing
Wavelet Transform Based On Supervised Learning For Detection of Microcalcifications in Digital Mammograms," Proceedings of IEEE International Conference on Image Processing,
pp. 152-155 1995.
[3] R. N. Strickland, H. I. Hahn, "Wavelet Transform Matched Filters For the Detection and Classification of Microcalcifications in Mammography," Proceedings of IEEE International
Conference on Image Processing, pp. 422-425, 1995.
[4] Y. Barnett, T. Lewis, Outliers in Statistical Data, 3rd Ed. New York: John Wiley & Sons,
1994.
[5] B. Iglewicz, D. C. Hoaglin, How to Detect and Handle Outliers, ASQC basic references in quality control; v.16, 1993.
[6] 0. Egger, M. Kunt, "Embedded Zerotree Based Lossless Image Coding," IEEE ICIP'95,
vol. II pp. 616-619., June 1995.
[7] D. E. F. Florencio, R. Schafer "Perfect Reconstructing Nonlinear Filter Banks," in Proc. of IEEE mt. Conf. on Acoust., Speech, Signal Proc., 1996.
[8] R. L. de Queiroz, D. A. F. Florencio, "A Pyramidal Coding Using a Nonlinear Filter Bank," in Proc. of IEEE Irtt. Conf. on Acoust., Speech, Signal Proc., 1996.
[9] F. J. Hampson, J. C. Pesquet, "A Nonlinear Subband Decomposition with Perfect Recon-struction," in Proc. of IEEE mt. Conf. on Acoust., Speech, Signal Proc., 1996.
[10] I. Pitas, A. N. Venetsanopoulos, Nonlinear Digital Filters - Principles and Applications, Massachusetts: Kiuwer Academic Publishers, 1990.
[11] R. Ansari, A. E. Cetin, S. H. Lee, "Sub-band Coding of Images Using Nonrectangular Filter Banks," SPIE Vol. 974, pp. 315-322, Applications of Digital Image Processing XI, 1988.
[12] M. Phoong, C. W. Kim, P.P. Vaidyanathan and R. Ansari, "A new class of two-channel
biorthogonal filter banks and wavelet bases," IEEE Trans. on Signal Proc., March 1995, pp.
649-665, vol. 43, No. 3.
[13] C. L. Nikias, A. Petropulu ,Higher Order Statistical Analysis, Prentice Hall, 1994. [14] P. J. Bickel, K. A. Doksum, Mathematical Statistics, Holden-Day California: 1977.
![Figure 2: Nonlinear Subband Decomposition Structure in [6]](https://thumb-eu.123doks.com/thumbv2/9libnet/5668489.113438/3.918.203.705.125.339/figure-nonlinear-subband-decomposition-structure-in.webp)
![Figure 3: Nonlinear Subband Decomposition Structure in [9]](https://thumb-eu.123doks.com/thumbv2/9libnet/5668489.113438/4.918.177.709.131.247/figure-nonlinear-subband-decomposition-structure-in.webp)