Detecting User Types in Object Ranking Decisions
Xiaohui Lu
Dep. of Computer Science Rensselaer Polytechnic Inst.
Troy, NY 12180, USA
[email protected]
Markus Schaal
Dep. of Computer EngineeringBilkent University 06800 Ankara, Turkey
[email protected]
Sibel Adalı
Dep. of Computer Science Rensselaer Polytechnic Inst.Troy, NY 12180, USA
[email protected]
Anand Kishore Raju
Télécom ParisTech 75013 Paris, France
[email protected]
ABSTRACT
With the emergence of Web 2.0 applications, where informa-tion is not only shared across the internet, but also syndi-cated, evaluated, selected, recombined, edited, etc., quality
emergence by collaborative effort from many users becomes
crucial. However, users may have low expertise, subjective views, or competitive goals. Therefore, we need to identify cooperative users with strong expertise and high objectivity. As a first step towards this aim, we propose criteria for user type classification based on prior work in psychology and derived from observations in Web 2.0. We devise a statistical model for many different user types, and detec-tion methods for those user types. Finally, we evaluate and demonstrate both model and detection methods by means of an experimental setup.
Categories and Subject Descriptors
H.5.3 [Information Interfaces and Presentation]: Group and Organization Interfaces—Collaborative Computing; H.4.3 [Information Systems Applications]: Communications Applications; H.1.1 [Models and Principles]: Systems and Information Theory
General Terms
Human Factors, Experimentation, Theory
Keywords
Collaborative Quality Assessment, User Type Model, User Type Detection
1. INTRODUCTION
For quality assessment in Web 2.0, human computing or collaborative effort can be exploited. Human computing is
Permission to make digital or hard copies of all or part of this work for personal or classroom use is granted without fee provided that copies are not made or distributed for profit or commercial advantage and that copies bear this notice and the full citation on the first page. To copy otherwise, to republish, to post on servers or to redistribute to lists, requires prior specific permission and/or a fee.
MEDES 2009 October 27-30, 2009, Lyon, France Copyright 2008 ACM 978-1-60558-829-2/08/0003 ...$5.00.
understood here as implicit knowledge extraction from hu-man responses, cf. e.g. Law and Ahn [9], whereas collab-orative quality emergence is the entire process of quality creation by collaborative efforts as seen in e.g. Wikipedia.
During exploitation of individual contributions towards higher quality, we should not forget that each user may suffer from individual limitations and the resulting errors may not cancel each other in all cases. So, it becomes important to understand the individual user and her contribution to the shared quality goal. Both implicit and explicit feedback may help towards this end.
Individual preferences and value assessments may vary among users for a variety of different reasons, e.g. bias,
mis-information, missing context, malicious behavior, difference of opinion, etc. We propose a model and detection methods
for those differences.
In the semantic web and more recently in so-called Web 2.0 applications, the need arises for a distinction between those users that increase the quality for others and those that do not. Many investigations for collaborative envi-ronments address issues like attacks against the shared goal (specifically in P2P-networks), personal recommendations, or trust and reputation. Solitary solutions for these issues exist. However, we observe that none of these solitary so-lutions solve the overall problem of trust and quality in a sustainable and generalizable manner. In order to develop quality modules for collaborative Web 2.0 applications, we want to know how to learn user types, their abilities and intention over time, much the same way a super-intelligent human would learn from his social environment.
As a first step, in this work we want to distinguish types of data differences, in particular differences in user’s ob-ject ranking decisions. We want to understand whether two agents (or users) have a deviation due to (1) personal prefer-ence, (2) malicious behavior or (3) personal bias and error. A successful detection of those differences can help towards treating user feedback in an automatic or semi-automatic way for e.g. malicious human user inhibition, etc. In this paper, we first distinguish and characterize different user types. We then propose a number of methods for detecting specific characteristics of the users. For evaluation, we sug-gest a statistical model that allows us to create different user types, simulate their decision making process and test the applicability of our detection methods. We then present an
extensive number of experiments to test our method using the statistical model and show how we can detect differences in user preferences.
The work will be presented as follows: (1) Related Work (Section 2), (2) User Model for Web 2.0 (Section 3), (3) Detection Methods (Section 5), (4) Statistical User Model (Section 6), (5) Experimental Setup (Section 7). The dis-cussion is concluded in Section 8.
2. RELATED WORK
The estimation of user types in collaborative web portals has not yet been systematically investigated. Prior work in the domain of computer and systems engineering includes solutions for specific problems in the Web 2.0, e.g. collabo-rative filtering for recommender systems [6, 17], trust mod-els for the defense of malicious attacks on P2P systems [2, 14, 7] and ranking methods for collaboratively created and hyperlinked content [5, 11]. Avesani [3] described a trust-based recommender system where they proposed models of trust that were built from the direct feedback from users. A trust model was generated from the resulting graph of relationships, termed as web of trust.
On the other hand, systematic research has been con-ducted on the psychology of decision-making, cf. e.g. Tver-sky and Kahneman [16] and Kollock [8]. TverTver-sky and Kah-neman [16] provide a concise discussion of relevant influ-ence factors for correct human assessment and deviations resulting from human biases respectively. Kollock [8] stud-ies causes for the emergence of (trading) relationships among actors in a free-choice network. In addition, Shanteau [15] reports on systematic deviations of expert users who employ cognitive heuristics to reduce the complexity of judgments. Nickerson [12] studies confirmation bias as a preference to adopt information which support one’s own view.
Furthermore, an user’s willingness to accept a given piece of information into a decision-making process is influenced by the trust given to the provenance of this information. Norris and Sanders [13] studied how the user acquires infor-mation and is persuaded in his preferences and thus gained insights into relevant cognitive processes and the properties of influencing agents. Leggatt and McGuinness [10] devised an extensive study into patterns of information trust in the context of a military sensemaking task. The issue of trust in a social context is also examined by Barbelet [4].
Our aim in this paper is to bring the insights from this research into collaborative information systems.
3. USER MODEL FOR WEB 2.0
In the following, we propose a user model derived both from psychology and by observation of state-of-the-art Web 2.0 applications.
3.1 Preferences, Rankings & Value Assessment
Users assess quality either by comparison or by value as-signment. Preferences (x1 is preferred over x2) and range
votings (numerical judgements between e.g. 0 and M ) are
the methods reflecting these ways of quality assessment di-rectly. Rankings (permutations of all objects) are reflecting these ways only indirectly - they are overspecified with re-spect to comparison (some pairs may not be comparable) and underspecified with respect to value assignment (dis-tances between values remain unclear).
Formally:
• Preferences: a judgement for a pair of objects, o1> o2
(or o1≥ o2) such that o1 is better than o2.
• Rankings: a permutation of all objects such that ranks
1 . . . N are assigned to each object.
• Range voting: a numerical judgement for each object r(o). In this ranking, each user is allowed to rank or
not on an object. Each vote is a number in the range of 0 to M .
Rankings do not allow objects to have the same ranks, while preferences and range votings may allow the users to do so. Note that preferences are generally between pairs while range votings are made as a result of a value assess-ment. Also, we assume rankings to be derived from value assessments. Value assessments may be complete or incom-plete, i.e. users may or may not rank on all objects.
In this paper, we will only consider rankings, since they provide a lot of information about preferences in a very com-pact way.
3.2 User Types
The following list is a collection of issues according to which we wish to classify user types:
Expertise Level: A user might be novice or expert, the latter with respect to a particular context or domain. Also, there is a continuous range between novice and
expert. We assume that novices have higher and more
frequent deviations than experts. Note, Experts often rely on heuristics to cope with uncertainty, which in turn leads to unintended systematic deviations (bias). Collaboration Level: A collaborative user will be truly hon-est, and contributes according to his full ability. A dishonest or competitive user may neglect the goal of evaluation or even undermine (attack) it.
Subjectivity: A subjective user may deviate for subjective reasons, even in the absence of bias.
Herding Effect: A user might prefer independent judgment or he may be influenced by the judgment of others. This quality needs to be considered if the feedback of other or aggregated feedback is available to the user prior to voting, ranking or feedback.
Learning Capacity: A user could learn over time. If she is a good learner, expertise level may increase and herding
effect may diminish over time.
These issues are not fully independent, and it is unclear to which extend they can be inferred from the data. In this paper, we will focus experimentally on the following
aspects and their relationship to aforementioned issues and
user properties.
Error Rate: Users may have different capability to assess the properties of evaluated objects accurately. This relates to both expertise and learning capacity.
Views and Outliers: Users may have different views, i.e. ways of evaluating objects. Users’ views may or may not correlate with others. In the first case we will have clusters of similar users, in the latter case we will have outliers. This relates to both subjectivity and herding effect.
Heuristics: User may consider different properties of their objects equally, or they may apply so-called heuristics, considering certain factors more strongly if a particu-lar factor surpasses a threshold value. This is a sim-ple model for cognitive heuristics, as reported by e.g. Shanteau [15]. This relates to expertise level and to learning capacity.
Note, the relationships between these aspects and the afore-mentioned issues of interest are not straightforward and not one-to-one. The computation of e.g. subjectivity or
collabo-ration level is still far ahead, if not unreachable.
4. USER MODEL
We assume all the users have some internal set of factors they care about and they use these to different degrees to score each object. These factors are measured on a scale from −3 to 3 and will be observed by the user. Note, the observations for this factor may differ on a particular object due to the different algorithms used by users. Each user aggregates her observations into a single score, e.g. by means of a weighted sum. Then, the scores determine the ranking, range voting or preference.
Weighted sum is a hard model for users though good for
search engines. People may not be rational, judging each factor independently. Generally, one can foresee a more drastic method, such as if one factor has a value about a threshold, then it dominates the ranking (positively or neg-atively). People may be restricted to certain factors or they may change their weights according to the context. All of these variations in user behavior are considered in our uni-fied statistical model of users.
4.1 Deviation Types
We want to trace user properties by differences observed in the data. Clearly, this is a very difficult area touching cognitive science and psychology beyond the mathematical
user model that mediates between user properties and data differences, cf. Fig. 1.
With respect to our mediating user model, we distinguish the following types of deviations:
• value deviation: deviations in the value observations
for individual factors of objects
• model deviation: differences in the model used to
ag-gregate the individual factors into a single value for each object
• behavior deviation: this is the distribution of
disagree-ments over a set of queries.
In the statistical model (cf. Section 6) user type differ-ences will be modeled as follows:
• Error Rate: If factors are modeling objective and
ob-servable properties, then one can say that experts will have smaller variations in those than others. This will be modeled by differences in the value deviation.
User Properties User Model Error Rate Subjectivity Heuristics Data Difference Ranker Value
?
Factors Observations AggregationsFigure 1: Detecting User Properties from Data Dif-ferences
• Subjectivity (View Differences): A subjective user may
deviate systematically even if she is an expert. Dis-agreement based on subjectivity will be modeled by different importance for different factors for all objects, i.e. by model deviation, in particular by a different weight scheme per view.
• Outliers (Independent View): Users who disagree with
the majority on almost all topics. This will be modeled by variation of the number of users with a particular weight scheme for evaluation.
• Heuristics (e.g. Flip-Floppers): We model some simple
heuristics by changing the weight scheme completely if certain factors are below (or above) a threshold. As a result, we create so-called flip-floppers, i.e. users who strongly agree with one group for a set of topics or with another group for a different set of topics.
• Herd Mentality: We model users who always agree
with one or a group of users on almost all topics. The following deviation types are foreseen in the user type model, but will not be studied in this paper:
• Sensitivity (model): Suppose a threshold is used in the
model where users consider a factor only if it higher than a certain threshold. Then, users may disagree on the value of the threshold. For example, novice users may have very high thresholds for certain factors as they do not understand the nuances in the lower values. However, experts may have lower thresholds, being able to incorporate the lower values of the score into their overall value judgement.
• Learners (behavior): Users who have a strong herd
mentality or strong flip flopping in the beginning and slowly become outliers in more and more topics.
• Gamers (model, behavior): Users may have set
for-mula for certain factors based on their value. For ex-ample, if a factor is high, then set its weight to zero. Similarly, users may simply move a specific object to a given rank regardless of its score.
5. DETECTION METHODS
In this section, we will discuss a list of methods we de-veloped to identify different characteristics of users. In this paper, we assume that users rank a series of objects for a specific decision problem. The information system has ac-cess to rankings for many different problems by the same users. The users need not rank the same objects at each round. For any given problem, a ranker r (modeling a user) is a list of top-k objects r = o1, . . . , ok where o1 is the
iden-tifier of the object with rank 1 and okis the identifier of the
object of rank k. The precision between two rankers r1, r2
is given by the total number of common objects between them, denoted by prec(r1, r2). We use rank(o, r) to denote
the rank of object o for ranker r. If o is not returned by the ranker r in the top k, we assume its rank is k + 1. The kendall-tau kd(r1, r2) between two rankers r1, r2 is given by
total number of pairs of objects (o1, o2) that are ranked by
one of the rankers such that the rankers disagree on the or-dering of the objects, divided by the total number of pairs compared. As a minimization function, kd is a natural dis-tance function. As precision is a maximization function, we use k −prec(r1, r2) when we use precision as a distance
func-tion. We normalize both measures so that values returned by them is between 0 and 1, 0 being the lowest distance and 1 being the highest.
Clustering. Clustering of users allows us to find the different opinions. In this paper, we use a simple single link clustering of rankers based on average precision as follows: For each problem, the similarity between two sets C1and C2
of rankers is given by sim(C1, C2) = P
r1∈C1,r2∈C2 d(r1,r2)
|C1|∗|C2| where d is any distance function such as precision or kendall-tau.
We first start by placing each ranker in its own cluster and merge the two most similar clusters until there are exactly
z clusters. In our tests, we use z = 2, 4, i.e. two or four
different points of view. Even though the number of clusters is an input to this algorithm, it is not unrealistic for someone asking a question to have an idea on how many “major” points of view exists for that question as it is the case for most political decision making. Another way to think of this problem is to analyze how the users behave assuming there are z different points of view.
Cluster quality. The presence of clusters is not a guar-antee that there is a big difference of opinion between rankers in one cluster and the others. In fact, most users may have more or less the same opinion. To this end, we would like to measure the quality of the clusters. If there are true group-ings of similar opinion, the rankers in the same cluster will be very similar to each other but rankers in different clusters will be very different from each other.
To capture this idea, we define cluster quality cc as follows (given z clusters C1, . . . , Cz):
cc =PC
1,C2∈{C1,...,Cz})
sim(C1,C1)+sim(C2,C2)
sim(C1,C2)∗z∗(z−1) .
This measures the normalized difference of inter- and intra-cluster similarity and between all pairs of intra-clusters. In case
sim returns zero, we replace it with a small constant ² to
avoid division by zero. Again, it is possible to use either precision or Kendall-tau for this measure. Values close to zero signal a high cluster quality.
Persistance of opinion. The next question is then whether users always agree with each other, i.e. place in the same cluster or frequently change “camps”. If users
ran-domly changed opinion, then what answer they will give to a new problem is unpredictable. This may be a desirable mea-sure if our aim is to find independent thinkers or an undesir-able measure if we want to predict the consensus in a group as unpredictable users do not necessarily help with this task. So, the first task is measuring the “unpredictability” of a user which we will denote as the flip-flop measure. Given a problem p, let Clusters(p) be the set of clusters for this problem computed as given above. Then, we compute the following quantity: same cluster(ri, rj) is the total number
of problems where ranker ri and rJ are in the same cluster
(except for ri= rjin which case this quantity is equal to 0).
Then, for each ranker ri, we obtain a normalized distribution
of same cluster(ri, ∗) by T (ri) = P rjsame cluster(ri, rj) and by computing same cluster0(r i, rj) = same cluster(ri, rj)/T (ri).
Now, we would like to compute unpredictability of this distribution. The most unpredictable distribution would be the uniform distribution where the user can agree with any-one (assuming of course that there is more than any-one clus-ter). Hence, the more different this distribution is from the uniform, the more predictable it is. To capture this, we use the Kullback-Leibler divergence of the given distribu-tion from the uniform distribudistribu-tion to find the flip-flop mea-sure (f f ) as follows: f f (i) = Pr
jsame cluster
0(r i, rj) ∗
logsame cluster0(ri,rj)
1/N where N is the total number of rankers.
We note that instead of log 0, we substitute log ² where ² is a very small value. In case a ranker is a loner, i.e. never in the same cluster with anyone, we consider that ranker exhibiting a uniform distribution with respect to the others. The f f value illustrates to which degree a user is unpre-dictable. The distribution of the f f values shows whether there is a difference between the different users. If all the users disagree more or less the same amount, then the dis-tribution of f f values will be fairly uniform.
Rank variance. The final measure we introduce is called the rank variance. This shows how much the ranks of the objects for this given ranker differs from the others. We compute the variance of the difference in the ranks of each object between two rankers. We compute this variance be-tween pairs of rankers, averaging over all rankers (rvAll). We also look at the rank variance of the rankers within the same cluster (rvC) which is useful for comparing with rvAll. Finally, we also compare the rank variance as a function of an aggregation algorithm f (denoted by rvAgg(f )): we first find the aggregation of all the rankers, then exclude the cur-rent ranker and aggregate again. We then look at the vari-ance of ranks for these two aggregations. This computes to which degree a ranker effects the final outcome of the aggre-gation. Even though it is impossible to learn whether the intent of the user is malicious, it might be possible to check to which degree different users effect the final outcome of an algorithm to find the users that are outliers for a given algorithm. By choosing different aggregation algorithms, we are able to measure the impact of the ranker for a specific algorithm.
Note that none of these measures are sufficient to identify a specific property of a user. However, taken together, they can be used to identify different types of users or different characteristics. To be able to study this phenomenon fur-ther, we setup a statistical testbed that we will introduce in the next section.
In addition to the measures introduced in this section, it is possible to develop a new set of measures aimed at dis-covering which factors effect users’ decision. However, to be able to use these measures in a real life scenario, we need access to rankings of the same users for different problems as well as the values of the factors for these problems. Further-more, the different problems have to be fairly similar so that the users take the same factors into account when deciding on these problems. As this is a fairly involved scenario and hard to replicate in real life applications, we decided to limit our attention to the simpler scenario of only having access to the ranks in this paper.
6. STATISTICAL USER MODEL
To test whether we can detect various user properties, we implemented a statistical model of user decisions. In this model, we assume that users make their decisions based on a number of factors, F . For each factor, users determine a value between -3 and 3, where low values denote undesir-able values. We assume that factors are independent of each other unless specific correlations are considered (as we will see in some of the tests below). Users pass judgement on a set of alternatives which we will call a set of objects O. Users assign a value for objects in O and factors in F , de-termining how desirable the object is for that factor. Users combine these factors using a weighted sum. The weights are assumed to be positive and add up to 1. The weighted sum returns a combined score for that object. The scores are used to ranks the objects, the highest score determining the object with rank 1. We assume users return the top k objects from the set O with ranks. We refer to users as rankers and use the two terms interchangeably in the follow-ing discussion.
To model how users differ from each other, we assign a ground truth value to the factors uniformly at random. Hence, we assume the existence of a basis ranking BASE where BASE(o, f ) denotes the score of object o for factor
f . We assume this ground truth values represent the basis
for estimating the value of the scores of factors. We assume users deviate from these ground truth values in one of two ways: randomly or based on a statistical relationship. For the time being, we will assume that deviations are random. This models the case where the factors represent objective and observable features of the problem being considered. In other words, if a large number of users are polled, we expect the majority to agree on the ground truth values. However, each user may have different value functions that would differ from the ground truth. If the deviations are random, then this represents a user uninformed about this given factor. The amount and the shape of the deviation is determined by a function that assumes small errors for factors with high value, i.e. the user normally knows a good factor is good, but may occasionally think a bad factor is much better than it actually is.
Each ranker ri is generated as follows: We first generate
deviations for each factor based on a given level of “error” which we call maxvar or noise. The score of each factor is given by the sum of its ground truth value and its error. Then, each ranker is assigned a weight vector W and the final score of the object o is given by weighted sum of its factor values with the weights in W . The objects are then ranked with respect to these scores. rank(o, ri) denotes the
rank of object o for ranker ri. We assume that we select the
top k objects for each ranker.
Using this model, we are able to generate different types of deviations in the assessment of the factors. Random er-rors as we discussed can be considered erer-rors. However, more systematic errors can also be modeled by introducing various correlations. These deviations are considered value assignment deviations. For example, if the deviations of two rankers are correlated, then this represents a collusion. Note that a large number of models of cooperation are possible, for a single factor, a specific object or a combination of both. If the deviations are always positive or negative for certain objects, this represents a bias.
In this model, we can therefore control the following pa-rameters: the magnitude of the deviation function for differ-ent users and factors or for specific objects; the correlation between the deviations of different users for the same factor; the correlation between the deviations of a specific user for different objects; the correlation between the deviations of different users for different objects. The correlations can be positive or negative.
The differences in the weights represents a difference of opinion or a difference of models. Users’ models may differ from this model in a variety of ways.
Different Weights. Users may have different weights than
the basis, considering different factors as more or less im-portant.
Heuristic Models. Users may have a different combination
model that is based on the perceived values of the factors. For example, they may disregard a factor if its value is be-low a threshold instead of incorporating it into the overall formula. Similarly, certain factors may dominate the overall score if they are too high to the detriment of the remaining factors.
7. EXPERIMENTAL SETUP
To test whether our measures can be used to capture the different characteristics of the users, we have designed a number of tests using our statistical model. In all our tests, we use five factors, twenty rankers, 100 objects and users return their top 10 objects. In our setup, we assume the deviations from the ground truth are random though they may be correlated. We introduce five types of users: Type 1 uses weights 5/15, 4/15, 3/15, 2/15, 1/15 and type 2 uses weights 1/15, 2/15, 3/15, 4/15, 5/15. Type 3 uses the heuris-tic: if factor 5 < 0.7 then use type 1 weights, else use type 2 weights. Type 4 uses the heuristic: if factor 1 < 0.7 then use type 2 weights, else use type 1 weights. Type 5 uses the heuristic: if factor 1 > 0.2 and factor 2 < 0.5 , use type 1 weights, if factor 2 ≥ 0.5 then use type 2 weights, else use weights 1/5, 1/5, 1/5, 1/5, 1/5. Note that types 3,4 and 5 evaluate their heuristic for each object separately. As a result, they end up being very different from type 1 and 2, even though they use the same weights.
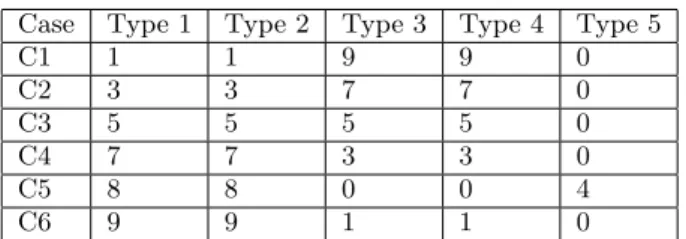
In our initial set of test cases, we vary the number of users of each type according to Table 1. For the first run, we assume all the rankers have the same amount of deviation value (maxvar) for each question. Then we vary the amount of deviation from very low (0.01) to high (5). For each test case and maxvar value, we create 10,000 datasets and report on the average of these data sets.
Cluster Quality. For each dataset, we find 2 and 4 clus-ters in each of the above test cases. Tables 2 and 3 show the cluster quality values for each case. The first thing we
no-Case Type 1 Type 2 Type 3 Type 4 Type 5 C1 1 1 9 9 0 C2 3 3 7 7 0 C3 5 5 5 5 0 C4 7 7 3 3 0 C5 8 8 0 0 4 C6 9 9 1 1 0
Table 1: Test Cases defined by User Type Counts tice is that the cluster quality goes down as the amount noise (maxvar) increases. This is to be expected, as there is more noise, the different types of rankers make errors which make them seem more like each other. However, given the four clusters especially in the low noise cases have significantly higher cluster quality than the equivalent 2 cluster case, we conclude that the heuristics result in a significantly differ-ent ranking behavior, even though the heuristic used in this case was on one factor only and involved a fairly high (0.7) threshold. In high noise cases, the distinction between 2 and 4 clusters disappears as the distinction between type 1 and 3, 2 and 4 fades. For 4 clusters, all clusters have roughly the same quality value for a specific noise value, which means that our algorithm is able to find the four distinct user types in each case. For 2 clusters, we see that cases with fewer the type 3 and 4 type users have higher the cluster quality val-ues. However, this distinction quickly disappears as noise goes up. As a result, 2 clusters, i.e. broad categorization is a good substitute for the finer tuned 4-cluster results.
Maxvar C1 C2 C3 C4 C5 C6 .01 .09 .18 .20 .16 .12 .07 .1 .11 .19 .21 .17 .13 .08 1 .26 .31 .30 .26 .24 .18 3 .54 .52 .65 .63 .64 .60 5 .66 .66 .65 .63 .64 .60 Table 2: Cluster Quality for 2 clusters Maxvar C1 C2 C3 C4 C5 C6 .01 .001 .002 .002 .002 .000 .000 .1 .016 .027 .028 .024 .007 .010 1 .19 .23 .23 .21 .19 .12 3 .43 .42 .39 .35 .39 .30 5 .51 .50 .49 .46 .49 .44 Table 3: Cluster quality for 4 clusters Flip-floppers. Next we look at whether the f f value captures the rankers who are flip floppers accurately in Ta-bles 4 and 5. We show the average f f value for rankers of each type in each case. Note that f f value is zero when the distribution is uniform and higher when a user flip flops. Types 1 and 2 and types 3 and 4 generally have similar f f values. For all cases, we report on the average ff values of type 1 and 2 vs. the remaining ones. We can see that there is a clear distinction in the f f values between rankers who use a heuristic value and the others. As a direct result of the f f formula, the more users who do not flip flop, the higher the f f values for them. We note however that the distinction between the different cases become smaller when
the noise increases. We also notice that the differences are not that large for 4 clusters, as the possibility of accidental flip flop increases (a type 1 user may be classified as a type 3 user in a cluster accidentally or vice-versa).
Maxvar C1 C2 C3 C4 C6 .01 .56/.43 .59/.40 .64/.47 .71/.52 .76/.53 1 .58/.45 .64/.50 .70/.54 .75/.60 .77/.58 5 .20/.19 .27/.24 .33/.28 .43/.37 .50/.41 Table 4: FF value for type 1&2 users vs. 3&4 users, 2 clusters
Maxvar C1 C2 C3 C4 C6
.01 .79/.87 1.4/1.04 1.22/1.22 1.04/1.4 .89/.79 1 .77/.79 .90/.84 .91/.86 .88/.86 .83/.78 5 .46/.41 .52/.44 .57/.48 .63/.52 .67/.55 Table 5: FF value for type 1&2 users vs. 3&4 users, 4 clusters
Rank variance. In Table 6, we see that rank variance captures the noise, as the average rank variance of the all rankers goes up as the noise goes up. Furthermore, the av-erage rank variance of rankers goes down considerably when we consider only the rankers in a cluster. This is due to the fact that rank variance and precision are correlated factors. We also note that the rank variance of rankers of type 1 and 3, as well as 2 and 4 are much smaller than the overall rank variance, but still larger than the rank variance of rankers of the same type. Hence, we conclude that rank variance cor-rectly captures two factors: the similarity of the underlying user models (the more similar the rankers, the lower the rank variance) and the amount of noise. We notice that as the noise goes up, the different user models seem to look equally dissimilar as the differences in the models are masked by the noise. Maxvar rvAll rv(∗) rvC(1) rvC(2) 20/0.1 - 5.2 1.80 2.1 20/3 - 6.24 3.3 4.0 20/5 - 6.60 4.9 5.4 1/3-19/.1 6.19 5.24 2.1 2.1 3/3-17/.1 6.3 5.40 2.37 2.1
Table 6: Rank variance values, rv(∗) values shows the rvAll value of the users with higher rank vari-ance than the rest, rvC(1) value average for type 1&2 users and rvC(2) value for 3&4 users, 2 clusters
Next, we increase the maxvar value of 1 and 3 rankers of type 1 to 3, while keeping the rest of the rankers at 0.1. In Table 6, we use the notation 1/3 − 19/.1 to denote the first case of 1 ranker with maxvar 3 and the rest at 0.1, similarly 3/3 − 17/.1 to denote the second case. The f f values for these rankers remain unchanged, meaning that the noise does not change the model of behavior significantly and hence, rankers usually end up in the same clusters as the rankers of the same type. However, the rank variance for the rankers with the high noise goes up considerably. This effect is most visible when we look at the rank variance of
rankers in the same cluster. The value is 4 for high noise rankers while it is close to 2.5 for the remaining rankers.
Cooperation between rankers. We investigate the case when the rankers cooperate, i.e. make decisions in-fluenced by the decisions of the others. One can consider this a sort of bias or a collaborative effort to produce a cer-tain outcome. However, it is not possible to infer the intent just from the decisions made by the users. As a result, we will treat them as same in this section. We model the coop-eration in three different ways:
A: correlation of the final scores of the objects: rankers alter their final scores to make them similar or dissimilar to each other depending on whether the correlation is positive or negative,
B: correlation of the noise of two rankers for two factors of the same object are correlated: rankers confuse the meaning of one factor for another (positive correlation) or interpret one factor as opposite of the other (nega-tive correlation),
C: the noise for the same factor for different objects are correlated: the rankers evaluation of a factor has a systematic deviation for all the objects, a positive cor-relation means that all the objects have either high or low noise, a negative correlation means that a low noise in one object means a high noise in another.
Case cc f f rvAll rvC Base (C3) 0.21 0.58 5.3 2.0 A, 0.6 0.21 0.58 5.2 1.9 A, -0.6 0.30 0.58 7.9 4.3 B, 0.6 0.21 0.58 5.4/5.4 1.8/1.7 B, -0.6 0.19 2.2/0.2 11.2/6.2 0.7/4.5 C, 0.6 0.21 0.58 5.4/5.4 1.8/1.7 C, -0.6 0.20 2.2/0.2 11.3/5.5 1.1/5.2 Table 7: The values of measures for different correla-tion experiments based on 2 clusters, values x/y in-dicate the value for correlated rankers vs. the other rankers
Table 7 shows results for a series of correlation tests. For these tests, we fixed the test case to C3 and the maxvar value to 0.1. For A, we consider correlation values of 0.6 and -0.6. For -0.6, we notice that clustering quality goes down slightly (from 0.21 to 0.30), the average rank variance goes up considerably (from 5.40 to 8.04). The f f measure changes only slightly as this is a change that effects all the rankers equally. For positive correlation, 0.6 and even for 0.8, we do not see a noticeable change in any of the measures. Only for a value as high as 0.95, there was a small change in rank variance and cluster quality, both values went down.
For B, we introduce correlation between three rankers of type 1. We test both 0.6 and -0.6. For -0.6, the f f value for the correlated rankers goes up considerably (from 0.6 for all rankers to 2.2 for correlated rankers and 0.2 for other rankers) as well as the average variance from other rankers (from 5.40 to 11.25). However, we notice that the average variance of these rankers in the same cluster goes down con-siderably (from 1.86 down to 0.79) while the average rank variance of all the other rankers in the same cluster goes up
(from 1.86 to 5). Furthermore, the cluster quality goes down as well (from 0.21 to 0.19). This is a puzzling result. The negative correlation causes the rankers to be very similar to some other rankers, but the ranker they are most similar to changes drastically from one test case to another. However, this results in the overall system being confused, forming overall bad clusters. To examine this case further, we look at the rank variance for a specific aggregation. We note that average aggregation is most effected by these rankers (the rank variance of the correlated rankers is 1.16 while the rank variance values for other rankers range between 0.13-0.54). However, median is not effected as it is able to dis-regard these rankers as outliers (all rankers have the same rank variance). The same is true for aggregations propt and pagerank that are also more robust to noise. Due to space restrictions, we do not describe these algorithms in detail here, however in a previous study, we have shown [1] that different rank aggregation algorithms perform well un-der different noise conditions and based on the existence of different types of rankers. With positive correlation, we do not see a significant change in any of the factors reported here.
Finally, for C, we again introduce correlation between three rankers. This case behaves almost identical to case B. For both B and C, there was no detectable change in our measures for positive correlation values as high as 0.95. The reason that the positive correlation in this case is hard to detect as in our model the deviations are random, though correlated. If deviations are systematic such as always in one direction for specific objects or a difference in the weights, it is much easier to detect these changes by clustering of the results.
8. CONCLUSION
We have shown that it is possible to distinguish users with different models, users with heuristic models and users with different amounts of error in their assessment in factors. First of all, clusters can be effectively used to distinguish be-tween different ranker weight functions. The amount noise (deviations) does not mask the weight function unless the noise is very high. Cluster quality is a good way of iden-tifying whether the different ranker groups differ from each other greatly or not. The f f value is indicative of more significant differences between the users such as existence of heuristics and negative correlations. In general, positive correlations or bias are harder to detect than negative cor-relations. The rank variance function on the other hand is a good indicator of amount of deviation a ranker has from the others. These methods together can be used to classify the users after appropriate thresholds are determined by an ad-ditional metric. Determining these threshold values remains an application dependent issue. These methods provide an application developer with a new set of tools with which to assess users. It is possible to incorporate these methods into a rank aggregation algorithm in many ways, such as disre-garding or giving higher value to different users’ opinions, or deciding when to aggregate different points of view sepa-rately. It is also possible to use this information in other con-tent management algorithms that find similar users, guess their future decisions or measure how much they trust each other. Our methods do not consider the expertise of the user. We believe it is not possible to assess this without explicit knowledge of the factors involved in the decision.
Investigating this issue is a topic of future work.
In this paper, we have concentrated on ranking of alter-natives instead of other types of user decisions such as pref-erences or range voting. Ranks provide more information about users’ decisions than preferences and they are incom-parable to range voting (in range voting equal ranks are possible but individual scores are more informative). It is possible to develop measures similar to precision (for clus-tering), f f and rank variance for these methods as well. One expects the methods to work similarly, but their effective-ness will be diminished as less and less information about the users is processed. However, in a real world scenario, users act much less randomly, making detection much eas-ier. The testing of our methods for real world applications is a topic of future research.
9. REFERENCES
[1] S. Adalı, B. Hill, and M. Magdon-Ismail. Information vs. robustness in rank aggregation: Models,
algorithms and a statistical framework for evaluation.
Journal of Digital Information Management (JDIM), special issue on Web information retrieval, 5(5), 2007.
[2] R. Andersen, C. Borgs, J. Chayes, U. Feige, A. Flaxman, A. Kalai, V. Mirrokni, and M. Tennenholtz. Trust-based recommendation systems: an axiomatic approach. In Proceedings of
WWW, pages 199–208, 2008.
[3] P. Avesani, P. Massa, and R. Tiella. A trust-enhanced recommender system application: Moleskiing. In SAC
’05: Proceedings of the 2005 ACM symposium on Applied computing, pages 1589–1593, New York, NY,
USA, 2005. ACM Press.
[4] J. Barbalet. A characterization of trust, and its
consequences. Theory and Society (In Press), 2009.
[5] C. Dwork, R. Kumar, M. Naor, and D. Sivakumar. Rank aggregation methods for the web. In Proceedings
of the ACM WWW Conference, pages 613–622, 2001.
[6] J. L. Herlocker, J. A. Konstan, L. G. Terveen, and J. T. Riedl. Evaluating collaborative filtering recommender systems. ACM Transactions on
Information Systems (TOIS), 22(1):5 – 53, 2004.
[7] S. Kamvar and M. Schlosser. The eigentrust algorithm for reputation management in p2p networks. In
Proceedings of the 12th international conference on World Wide Web, pages 640–651, 2003.
[8] P. Kollock. The emergence of exchange structures: An experimental study of uncertainty, commitment and trust. American Journal of Sociology, 100:313–345, 1994.
[9] E. Law and L. von Ahn. Input-agreement: a new mechanism for collecting data using human computation games. In CHI ’09: Proceedings of the
27th international conference on Human factors in computing systems, pages 1197–1206, New York, NY,
USA, 2009. ACM.
[10] A. Leggat and B. McGuinness. Factors influencing information trust and distrust in a sensemaking task. In 11thInternational Command and Control Research
and Technology Symposium, Cambridge, UK, Sept
2006.
[11] W. Meng, C. Yu, and K.-L. Liu. Building efficient and effective metasearch engines. ACM Computing
Surveys, 34(1):48–89, 2002.
[12] R. S. Nickerson. Confirmation bias: A ubiquitous phenomenon in many guises. Review of General
Psychology, 2:175–220, 1998.
[13] P. Norris, D. Sanders, and John. Knows little, learns less? an experimental study of the impact of the media on learning. Social Science Research Network
Working Paper Series, August 2001.
[14] J. O’Donovan and B. Smith. Trust in recommender systems. In IUI ’05: Proceedings of the 10th
international conference on Intelligent user interfaces,
pages 167–174, 2005.
[15] J. Shanteau. Cognitive heuristics and biases in behavioral auditing: Review, comments and
observations. Accounting, Organizations and Society, 14(1/2):165–177, 1989.
[16] A. Tversky and D. Kahneman. Extensional versus intuitive reasoning: the conjunction fallacy in probability judgement. Psychological Review, 90(4):293–315, 1983.
[17] J. Wang, A. P. de Vries, and M. J. T. Reinders. Unifying user-based and item-based collaborative filtering approaches by similarity fusion. In
Proceedings of the 29th annual international ACM SIGIR conference on Research and development in information retrieval, pages 501 – 508, 2006.