i
DEVELOPMENT AND VALIDATION OF METHODS FOR THE
DIAGNOSIS OF LUNG CANCER VIA SEROLOGICAL BIOMARKERS
A THESIS SUBMITTED TO
THE GRADUATE SCHOOL OF ENGINEERING AND
SCIENCES OF BILKENT UNIVERSITY
IN PARTIAL FULFILLMENT OF THE REQUIREMENTS
FOR THE DEGREE OF MASTER OF SCIENCE
IN
MOLECULAR BIOLOGY AND GENETICS
By
Abbas Güven Akçay
February 2019
ii
DEVELOPMENT AND VALIDATION OF METHODS FOR THE DIAGNOSIS OF
LUNG CANCER VIA SEROLOGICAL BIOMARKERS
By Abbas Güven Akçay
2019
We certify that we have read this thesis and that in our opinion it is fully adequate, in
scope and in quality, as a thesis for the degree of Master of Science:
Ali Osmay Güre (Advisor)
Murat Alper Cevher
Zeliha Günnur Dikmen
Approved for the Graduate School of Engineering and Science:
Ezhan Kara¸san
iii
ABSTRACT
DEVELOPMENT AND VALIDATION OF METHODS FOR THE DIAGNOSIS OF LUNG CANCER VIA SEROLOGICAL BIOMARKERS
Abbas Güven Akçay
M.Sc. in Molecular Biology and Genetics
Advisor: Ali Osmay Güre
February 2019
Over 10% of all new cancer cases are lung cancer. Moreover, estimates till 2030 indicate that already increasing lung cancer incidences will keep increasing, especially in developing countries like Turkey. Lung cancer, the leading cause of cancer deaths, has two large divisions: Small Cell Lung Cancer (SCLC) and Non-Small Cell Lung Cancer (NSCLC). SCLC is the most aggressive subtype of lung cancer. And although, the treatment options and median survival time is more favorable in Limited Disease (LD), high tumor growth rate and metastatic tendency of SCLC even in the early stages, makes the diagnosis troublesome. Similarly, if NSCLC is diagnosed in early stages, surgery option is open and this increases the patient survival rate. However, current methods in screening and diagnosis, such as computed tomography (CT) and positron emission tomography (PET), are all limited by false positivity rates. Additionally, biopsy methods used in histological evaluations are both invasive and prone to false negativity. Therefore, new diagnostic tools which are cheap, accurate and non-invasive are in high demand. Autologous antibodies are abundantly elicited and stably exist in patient sera years before the clinical diagnosis of disease. Several such antibodies were reported by our group and other groups in lung cancer. Therefore, new diagnostic methods incorporating autologous antibodies can be a huge step forward in early diagnosis of lung cancer. Moreover, miRNAs, with their unique hormone like features such as circulation in serum and their regulatory effects in cell, are another good candidate for the early diagnosis of lung cancer. Therefore, in this study I aimed to develop a reliable, robust and automated evaluation method to re-evaluate custom Protein Array (cPA) screenings previously performed in our lab, and to determine the autologous antibodies with highest discriminatory power between SCLC patients & healthy controls. Moreover, I aimed to develop a Quartz Crystal Microbalance with Dissipation (QCM-D) based immunoassay to be incorporated later in the validation of cPA results. Lastly, in a parallel study I aimed to identify and validate novel miRNA biomarkers NSCLC. My results indicate that cPAs can have better sensitivity and specificity than ELISA and that QCM-D can be developed as an alternative to ELISA. miRNAs identified in silico, can also be validated ex vivo.
iv
Previously, Protein Arrays (PAs) and cPAs were screened using 49 SCLC patient’s and 50 healthy serums in our laboratory, incorporating visual and manual evaluations. Sensitivity and specificity values were calculated for individual antibodies and a number of autologous-antibody panels. Moreover, validations of cPA results were carried via ELISA. However, large discrepancies between cPA and ELISA results, as well as inconsistencies among ELISA results urged me to consider re-evaluation of cPA results with a more robust way, and to focus on developing a method superior to ELISA in autologous-antibody evaluations. Therefore, I incorporated AIDA to generate numeric values out of cPA screening images and filtered low quality data with optimized cut-off values. Several Receiver Operating Characteristic (ROC) curves were plotted using evaluated data. Improved results were evident by the increased Area Under Curve (AUC) values in both individual and combined ROC curves. Moreover, I developed a QCM based immunosensor for detection of anti-SOX2 antibody to be incorporated later in validation of cPA results. Binding interaction between anti-SOX2 antibody and SOX2 protein was modelled using 1:1 Langmuir Isothermal Binding and standard curves generated in QCM. In a parallel study, I also investigated miRNAs significantly upregulated in NSCLC when compared to high risk controls. For that purpose, miRNA expression datasets were gathered from GEO. Selected 2 datasets with the same sample type were analyzed for common significantly upregulated miRNAs among these two datasets. Significantly upregulated miRNAs were subjected to logistic regression analysis with LASSO regularization (error metrics: AUC and MSE) to select best panel of miRNAs that can distinguish NSCLC patients from healthy controls in given datasets. Moreover, selected miRNAs were analyzed with qRT-PCR to validate the panel.
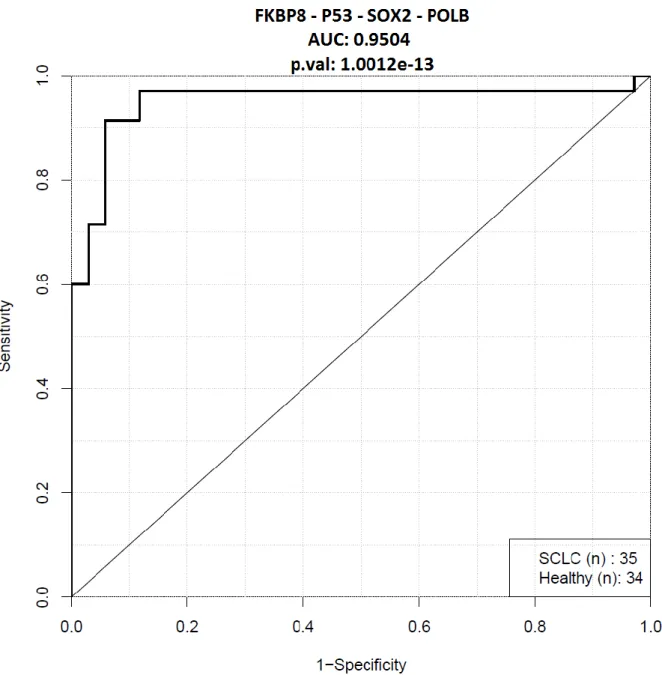
I was able to re-evaluate cPA results by eliminating low quality data from numeric values generated via AIDA software from cPA images. I identified a panel of 4 autologous antibodies (FKBP8 – P53 – SOX2 – POLB) which resulted in 60% sensitivity at 100% specificity in discrimination of SCLC from controls. ROC of this autologous antibody panel had an AUC of 95.04%. Given panel surpassed diagnostic power of the only commercially available diagnostic kit of the same kind; EarlyCDT-Lung. Moreover, proof of concept for measurements of anti-protein antibodies were carried successfully in QCM, using anti-SOX2 antibody-SOX2 protein pair in PBS buffer as an example for it. Early results of anti-SOX2 mAb QCM indicate a linear assay range comparable to ELISA. Langmuir Isothermal Binding model revealed a strong interaction between antibody and protein in our QCM anti-SOX2 measurement experiments. Lastly, I was able to select 5 miRNAs using logistic regression and LASSO regularization that can best discriminate between NSCLC patients and high risk controls. However, validation experiments using qRT-PCR needs to be repeated as low Ct values and prominent hemolysis in serum samples prevented drawing meaningful conclusions.
Keywords: Lung cancer, SCLC, NSCLC, custom protein array, early diagnosis, serum, serological, autologous antibodies, miRNA, biomarker, ELISA, QCM, ROC, sensitivity, specificity, logistic regression, LASSO, qRT-PCR.
v
ÖZET
AKCİĞER KANSERİNİN SEROLOJİK BİYOBELİRTEÇLER İLE TEŞHİSİNE YÖNELİK YÖNTEM GELİŞTİRİLMESİ VE DOĞRULANMASI
Abbas Güven Akçay
Moleküler Biyoloji ve Genetik, Yüksek Lisans
Tez Danışmanı: Ali Osmay Güre
Şubat 2019
Yeni tespit edilen kanser vakalarının %10’u akciğer kanseridir. Dahası 2030 için yapılan öngörüler halihazırda artmakta olan akciğer kanseri vakalarının tüm dünyada ve özellikle Türkiye gibi gelişmekte olan ülkelerde daha da artacağını göstermektedir. Şu an en ölümcül kanser tipi olan akciğer kanserinin alt tipleri iki başlık altında toplanır: Küçük Hücreli Akciğer Kanseri (KHAK) ve Küçük Hücreli Dışı Akciğer Kanseri (KHDAK). KHAK akciğer kanserinin en agresif tipidir. Erken Aşama (EA) hastalıkta tedavi seçenekleri ve ortalama hayatta kalma süreleri daha çok olmasına karşın, KHAK’deki hızlı tümör büyüme hızı ve hastalığın çok hızlı metastaz yapma eğilimi erken teşhisi zorlaştırmaktadır. Benzer şekilde KHDAK’de da Erken Aşama hastalıkta cerrahi operasyon seçeneğinin mümkün olması dolayısıyla hasta hayatta kalma oranı artmaktadır. Fakat şu an tarama ve erken teşhiste kullanılan Bilgisayarlı Tomografi (BT) ve Pozitron Emisyon Tomografisi (PET) gibi yöntemler verdikleri sonuçlarda yüksek hatalı pozitiflik olması sebebiyle yetersizdir. Ek olarak tümör cinsini tespit ederken histolojik değerlendirmede kullanılan biyopsi yöntemleri hem hasta için invazivdir hem de örnekleme hataları dolayısıyla verdikleri sonuçlar yüksek hatalı negatiflik içerebilmektedir. Bu yüzden teşhiste kullanılmak üzere ucuz, hassas ve invaziv olmayan yöntemlere büyük ihtiyaç bulunmaktadır. Otolog antikorlar kanserin klinik teşhisinden yıllar önce hasta serumunda bolca ve yüksek stabilitede bulunmaktadır. Akciğer kanserinde bu tür antikorların varlığına hem bizim grubumuz hem de diğer bilimsel çevrelerce değinilmiştir. Dolayısıyla otolog antikorların ölçümüne dayalı teşhis yöntemleri akciğer kanserinin erken teşhisinde büyük gelişmeler sağlayabilecek potansiyel içermektedir. Bunun dışında miRNA’lar vücutta yaptıkları hormon benzeri etkiler, serumda sirkülasyonları ve
vi
hücrelerdeki düzenleyici etkileriyle akciğer kanserinin erken teşhisinde kullanılabilecek bir diğer adaydır. Bu sebeplerle, çalışmamda labımızda yapılmış cPA çalışmalarının tekrar değerlendirilmesi için güvenilir ve otomatize bir değerlendirme yöntemi geliştirmeyi amaçladım. Ek olarak, daha sonra cPA sonuçlarının doğrulamasında kullanılmak üzere QCM temelli bir immünosensör geliştirmeyi planladım. Son olarak, bunlara paralel bir çalışmada KHDAK’nin erken teşhisinde kullanılmak üzere miRNA temelli biyobelirteç tespit ve doğrulama çalışmaları yapmayı planladım. Aldığım sonuçlar cPA’ların ELISA’ya kıyasla daha iyi hassaslık ve özgünlük değerlerine sahip olabileceğine ve ELISA’ya alternatif olarak QCM-D temelli yöntemlerin geliştirilebileceğine işaret etmektedir. Ayrıca in silico tespit ettiğim miRNA’ların ex vivo validasyonu mümkündür.
Labımızda gerçekleştirilen öncül çalışmalarda cPA ile 49 KHAK hastasına ve 50 sağlıklı kontrole ait serumlar taranmış ve sonuçları manuel ve görsel şekilde değerlendirilmişti. Bu çalışmada tek tek otolog antikorların ve bazı otolog antikor panellerinin hassaslık ve özgüllük değerleri hesaplanmıştı. Daha sonra cPA çalışmaları ELISA yöntemi ile doğrulanmıştır. Fakat cPA ve ELISA sonuçları arasındaki bazı büyük uyumsuzluklar ve ELISA yöntemi ile alınan ölçümlerin kendi içinde çelişkiler barındırması bu çalışmayla cPA sonuçlarının daha stabil bir yöntemle tekrar değerlendirilmesinde ve otolog antikorları ölçmede ELISA’dan daha başarılı bir yöntem geliştirme çabamda teşvik edici sebep oldu. Bu yüzden AIDA ile cPA tarama görüntülerinden numerik ölçüm değerleri elde edip düşük kalite sinyallerin belli bir eşik değer ile elimine edilmesi sağlandı. Elde edilen veriler kullanılarak çok sayıda ROC eğrisi çizildi. Çizilen tekli otolog antikor ve panel ROC eğrilerindeki artan AUC değerleri uyguladığımız yeni değerlendirme yönteminin başarısı gösterdi. Ayrıca bu çalışmada anti-SOX2 antikorunu PBS solüsyonundan ölçebilen QCM temelli bir biyosensör geliştirildi. Bu yöntemin daha sonra cPA sonuçlarını doğrulamada kullanılması planlanmakta. SOX2 ile anti-SOX2 arasındaki bağlanma etkileşimi QCM standart eğri değerlerinin 1:1 Langmuir İzotermal Bağlanma modeline oturtulmasıyla incelendi. Bunlara paralel ve ek olarak KHDAK’de yüksek riskli kontrollere kıyasla anlamlı şekilde yukarı yönlü değişen miRNA’lar incelendi. Bunun için miRNA ekspresyon datasetleri GEO sitesinden belirlendi. Bunların içinden aynı örnek tipine sahip 2 KHDAK dataseti seçilip bu iki datasette de ekspresyon değerleri anlamlı ve yukarı yönlü değişim gösteren miRNA’lar gerekli analizlerle tespit edildi. Tespit edilen miRNA’lar lojistik regresyon ve LASSO düzenlileştirme yöntemleriyle (Hata metriği: AUC ve MSE) analiz edilip hastaları kontrollerden ayırmada en başırılı olan miRNA paneli seçildi. Seçilen miRNA paneli için qRT-PCR ile doğrulama çalışması yapıldı.
vii
cPA görüntülerinden AIDA programıyla elde edilen sayısal değerlerdeki düşük kaliteli verileri başarılı bir şekilde eleyip cPA sonuçlarını tekrar değerlendirebildim. 4 otolog antikordan (FKBP8 – P53 – SOX2 – POLB) oluşan bir panel belirledim. Belirlenen panelin KHAK hastalarını kontrollerden ayırma gücü %100 özgüllükte %60 hassasiyet olarak belirlendi. Bu panel için çizilen ROC eğrilerinin AUC değeri %95.04 olarak hesaplandı. Bahsi geçen panelin teşhis gücü halihazırda piyasada bulunan benzer tek kit olan EarlyCDT-Lung kitinin teşhis gücünün üstünde yer aldı. Anti-SOX2 antikoru ve SOX2 proteini imunojenik çiftini kullanarak PBS solüsyonunda gerçekleştirilen QCM ölçümleriyle bu yöntemin otolog antikorların ölçülmesinde kullanılabilirliği gösterildi. Ön çalışmalar anti-SOX2 mAb QCM yönteminin lineer ölçüm aralığının ELISA ile kıyaslanabilir seviyelerde olduğunu gösterdi. QCM anti-SOX2 yöntemiyle alınan ölçümlerin 1:1 Langmuir Izotermal Bağlanma modeline oturtulmasıyla kullandığım antijen antikor çifti arasında güçlü bir bağlanma etkileşimi tespit edildi. Ayrıca lojistik regresyon ve LASSO düzenlileştirme yöntemiyle KHDAK hastalarını yüksek risk kontrollerden en iyi ayıran 5 miRNA tespit edildi. Fakat, qRT-PCR doğrulama deneylerinde elde edilen düşük Ct değerleri ve serumlarda tespit edilen yüksek hemoliz değerleri dolayısıyla deney sonuçlarından anlamlı çıkarımlar yapmak mümkün olmadı. Dolayısıyla yapılan doğrulama deneylerinin tekrarlanması gerekmektedir.
Anahtar Kelimeler: Akciğer kanseri, KHAK, KHDAK, özel yapım protein mikrodizilim, serum, serolojik, otolog antikor, miRNA, biyobelirteç, ELISA, QCM, ROC, hassaslık, özgüllük, lojistik regresyon, LASSO, qRT-PCR
viii
ACKNOWLEDGEMENTS
The solution to life’s “absurdity” as suggested by Camus in Myth of Sisyphus is to create our own meanings in life. Actualizing through the personal goals in life, we can create our own meanings and have the fulfillment of “a” purpose. As an individual beginning to his journey through the academia, I already set goals for myself to achieve. However, the paths towards these goals are not always free of obstacles. Needless to say, I definitely felt the rough start with my 3.5 years long MSc journey, in which I had to overcome problems that most of my peers did not have to. This is not a bad thing! Because as stated by Molière: “the greater the obstacle, the more glory in overcoming it”. Luckily, sometimes the exact “overcoming” part or the burdens that “overcoming” lay on our body are eased by the touch of people in our lives. I am honored to be in the minds of these great people. With the opportunity at hand, here I would like to share my gratitude towards them by at least mentioning their names.
First of all, I would like to express my deep gratitude to my supervisor Assoc. Prof. Dr. Ali Osmay Güre. I am grateful to have such a kind supervisor who created a space for me to learn by trial and error. I appreciate how he always bared with me on my failures. His strong support and everlasting belief in my abilities I felt, it was what gave me the willpower to push beyond myself and transcend through what I thought was a dead end. I learned so much through his supervision not only in subjects related to academia but also in my personal life.
I also owe my best regards to Prof. Dr. Zeliha Günnur Dikmen and Asst. Prof. Murat Alper Cevher for their valuable counseling and insights in preparation of this thesis and being a part of my thesis committee.
I am sincerely thankful to Dr. Özlem Ertekin and Dr. Mehmet Altay ÜNAL for their ongoing intellectual help and immense support in development of the QCM immune assay. Without their valuable experiences, guidance and optimistic attitude it would be quite difficult, if ever possible for me to continue to the currently ongoing autologous-antibody QCM project.
I also would like to thank Assist. Prof. Urartu Özgür Şafak Şeker for allowing me to use his lab area and the QCM-D device in QCM related parts of the project. I am also thankful to him for finding time demonstrating QCM and helping with the analysis within the tight time schedule he has.
I appreciate Prof. Dr. Burçak Vural’s and Prof. Dr. Zeliha Günnur Dikmen’s efforts in providing us the serum samples for this study.
I sincerely appreciate all the support Muhammad Waqas Akbar provided to me. This one is especially dear to me. He not only patiently thought me several important things in the field as a colleague, but also been a great friend. After enduring the troubles of graduate life,
ix
sharing all the laughter and tea together on a daily basis, I now see him as a big brother to myself. And with all honesty, if I am able to finish this study, his help was undeniable. I hope we can keep these memories fresh and add new ones in the future.
I also would like to thank to Hamza Yusuf Altun, my partner in TUBITAK 1512 project, for his help in the evaluation of cPAs as well as his hard work in actualization of our TUBITAK 1512 project.
I would like to thank to Barış Küçükkaraduman for his support both inside and outside our lab, in addition to his kind and understanding nature.
I would like to thank to Farid Ahadli for his contributions in NSCLC part of this project as a senior student. He helped the project with conducting several in silico analysis, requiring great attention and precision in addition to intensive labor. With his diligent work expect a great future ahead of him.
I would like to repeat names of some new and old lab members and extend my warm feelings towards the rest of the AOG members, Muhammad Waqas Akbar, Barış Küçükkaraduman, Ege Dedeoğlu, Seçil Demirkol, Şükrü Atakan, Kerem Mert Şenses, Alper Poyraz, Mehdi Ghassemi, Seyhan Türk, Farid Ahadli, Hamza Yusuf Altun and others who might have slipped from my mind.
I also would like to thank to my friends who never left my side and with whom I share a great deal of memories. I especially want to mention Murat Yaman and Fatma Seyhun Üstün, but also the remaining part of the “Kalabalık Grup” Seniye, Suphi, Berhan, Zeynep, Naz, Arzu, Elif, Yasin, Hakan, İbrahim, Cem and the rest who I might have slipped from my mind.
Penultimately, I also want to mention my deep appreciation to Deniz Esen, my beautiful and loving girlfriend, for being someone with whom I can forget everything and have the ease of mind in the darkest hours. Her mental, emotional and actual workwise help throughout the sleepless nights was far beyond mere support. I, frankly, could not expect more. Thank you for all the times we shared together and will share in the future.
Last but not least, I would like to thank to my family, Yasemin Akçay, Kani Akçay and Eren Akçay. No matter where I am, I always felt their love and caring, which has been a major source of determination in whatever I achieved till now.
x
TABLE OF CONTENTS
List of Figures ... xiii
List of Tables ... xiv
INTRODUCTION ... 1
Lung Cancer ... 1
1.1.1. Statistics & Clinical Staging of Lung Cancer ... 1
1.1.2. Imaging and Screening Options in Lung Cancer ... 2
Role of Immune System in Cancer ... 3
1.2.1. Immunoediting ... 3
1.2.2. Tumor Associated Antigens and Autologous Anti-Tumor Antibodies in Cancer Diagnosis ... 4
1.2.3. Importance of Longitudinal Studies in Serological Biomarker Studies of Cancer ... 4
miRNAs in Cancer ... 6
AIMS OF THE STUDY ... 7
Developing a reliable, robust and automated evaluation method to re-evaluate cPA screenings of SCLC patients and healthy controls. ... 7
Developing a method in Quartz Crystal Microbalance to validate cPA screening results. ... 7
Identification and validation of novel miRNA biomarkers in Non-Small Cell Lung Cancer. 7 MATERIALS AND METHODS ... 8
RE-ANALYSIS AND RE-EVALUATION OF SCLC AND HEALTHY SERA CUSTOM PROTEIN ARRAY SCREENINGS... 8
3.1.1. Protein Array ... 8
3.1.2. Processing of cPA images in Photoshop ... 9
3.1.3. AIDA Signal Analysis Software ... 10
3.1.4. Data Filtration & Generation of Receiver Operating Characteristic Curves ... 11
QUARTZ CRYSTAL MICROBALANCE (QCM) METHOD DEVELOPMENT ... 12
3.2.1. Serum Collection ... 12
3.2.2. ELISA Measurements ... 12
xi
3.2.4. QCM Measurements ... 13
3.2.5. Surface Characterization via ATR FT-IR ... 14
3.2.6. QCM and ELISA Comparison ... 14
DISCOVER AND VALIDATION of miRNA BIOMARKERS in NON-SMALL CELL LUNG CANCER ... 14
3.3.1. Dataset Selection ... 14
3.3.2. miRNA Selection Incorporating Logistic Regression and LASSO Regularization ... 15
3.3.3. Serum Samples ... 16
3.3.4. Hemolysis Assessment ... 16
3.3.5. RNA Extraction and Quantification ... 16
3.3.6. cDNA Generation and Quantification ... 16
3.3.7. Quantitative Real Time Polymerase Chain Reaction (qRT-PCR) ... 17
3.3.8. Data Analysis ... 17
RESULTS ... 18
RE-ANALYSIS AND RE-EVALUATION OF SCLC AND HEALTHY SERA CUSTOM PROTEIN ARRAY SCREENINGS... 18
4.1.1. Protein Array ... 18
4.1.2. Processing of cPA images in Photoshop ... 18
4.1.3. Data Filtration & Generation of Receiver Operating Characteristic Curves ... 19
QUARTZ CRYSTAL MICROBALANCE METHOD DEVELOPMENT ... 26
4.2.1. ELISA Measurement ... 26
4.2.2. QCM Chip Modification ... 27
4.2.3. QCM Measurement ... 28
4.2.4. Surface Characterization via ATR FT-IR ... 29
4.2.5. QCM and ELISA Comparison ... 35
DISCOVER AND VALIDATION of miRNA BIOMARKERS in NON-SMALL CELL LUNG CANCER ... 36
4.3.1. Dataset Selection ... 36
4.3.2. miRNA Selection Incorporating Logistic Regression and LASSO Regularization ... 37
xii
4.3.4. RNA Extraction and Quantification ... 45
4.3.5. Quantitative Real Time Polymerase Chain Reaction (qRT-PCR) ... 45
DISCUSSION & FUTURE PERSPECTIVES ... 47
PA Screening Evaluations ... 47
Literature Search for the Autoantibodies in the Selected Panel ... 48
5.2.1. FKBP8 ... 48
5.2.2. P53 ... 48
5.2.3. SOX2 ... 48
5.2.4. POLB ... 48
QCM Development for Auto-Antibody Measurements ... 49
miRNA Biomarkers in NSCLC ... 50
Literature Search for the miRNAs in Selected Panel ... 51
5.5.1. hsa-miR-130b-5p ... 51 5.5.2. hsa-miR-132-5p ... 51 5.5.3. hsa-let-7d-3p ... 51 5.5.4. hsa-miR-1227-3p ... 51 5.5.5. hsa-miR-199a-5p ... 52 BIBLIOGRAPHY ... 53 APPENDIX ... 58
xiii
List of Figures
Figure 1.1: Schematic illustration of immunosurveilance theory...3
Figure 1.2: Anti-p53 autologous antibody seropositivity in relation to development of cancer....5
Figure 3.1: 12 distinct protein spotting patterns and a reference InkDot on a PA unit...8
Figure 3.2: Selection of Individual cPA Sections in Photoshop via Rectengular Marquee Tool
and an Example of Images Employed in Generation of Unified Images ...10
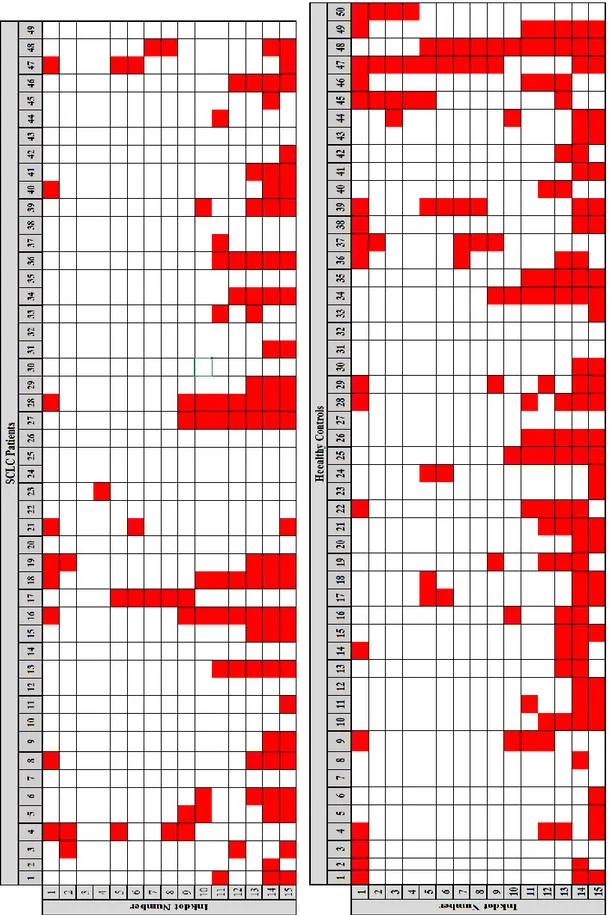
Figure 4.1: All cPA strips used in screening of SCLC patients and Healthy Controls...18
Figure 4.2: An Example of Signal Harboring Unit Elimination Using 1.5x StDev Cut-off...19
Figure 4.3: Pattern of discarded and analyzed signal harboring units in each cPA strip...20
Figure 4.4: Individual antibody ROC curves with highest AUC values...22-23-24
Figure 4.5: Combination ROC curve of proteins selected for QCM analysis...25
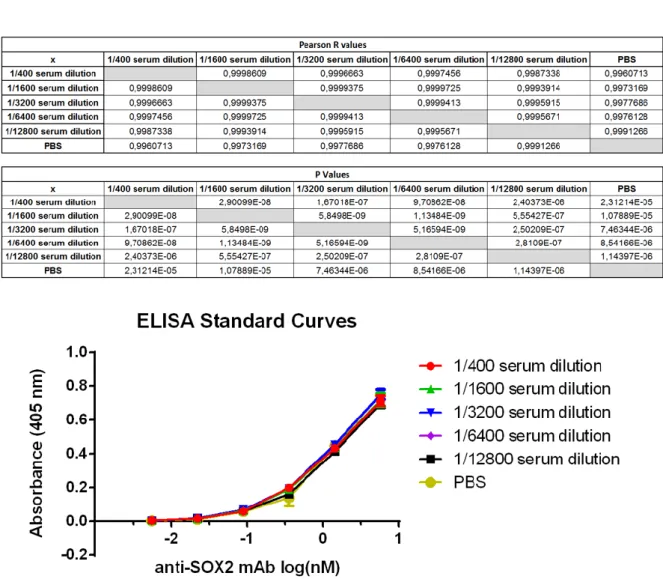
Figure 4.6: ELISA anti-SOX2 Standard curves prepared in different serum dilutions and PBS
buffer & Pearson R correlation of each standard curve...26
Figure 4.7: QCM chip measurements throughout the surface modification...27
Figure 4.8: QCM measurements of anti-SOX2 mAb binding on SOX2 protein immobilized on
AT-cut 5MHz QCM chip...28
Figure 4.9: Illustration of chip surface modification ...29
Figure 4.10: Absorbance spectrum of 11-MUA polimerized QCM chip surface measured via
ATR FT-IR...32
Figure 4.11: Absorbance spectrum of SOX2 immobilizedQCM chip surface measured via ATR
FT-IR...33
Figure 4.12: Absorbance spectrum of QCM chip surface after anti-SOX2 measurement,
analyzed via ATR FT-IR...34
Figure 4.13: Comparison of ELISA and QCM standard curve measurements for anti-SOX2
mAb in PBS Buffer...35
Figure 4.14: Common miRNAs between all datasets...37
Figure 4.15: Error metric for Logistic Regression training in Training Group of
GSE61741...39
Figure 4.16: ROC curve plotted from Training group of GSE61741 using LASSO generated
model...40
Figure 4.17: ROC curve plotted from Validation group of GSE61741 using LASSO generated
model with 5miRNAs...41
Figure4.18:Error metric for Logistic Regression training in Training Group of GSE24709…42
Figure 4.19:ROC curve plotted from GSE24709 using LASSO generated model with 4
miRNAs. ...43
Figure 4.20:Mean Expression of LASSO Selected miRNAs in GSE61741 and GSE24709...44
Figure 4.21: Relative miRNA expressions prepared for 5 miRNAs in 7 NSCLC patients and
their matched high risk controls. ...46
xiv
List of Tables
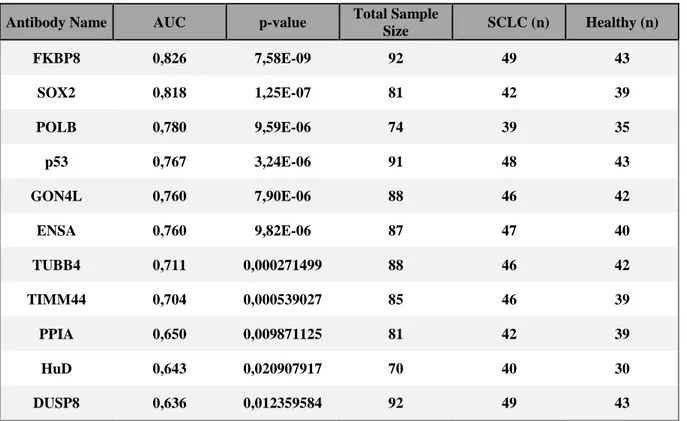
Table 4.1: 11 Best ROC curve results according to AUC values...21
Table 4.2: Signal peaks obtained after chip surface characterization with ATR FT-IR and their
attributed chemical structure...30-31
Table 4.3: List and details of the datasets selected for further analysis...36
Table 4.4: List of 18 significantly upregulated miRNAs common between GSE61741 and
GSE24709...38
Table 4.5: List of 5 miRNAs selected by LASSO training in GSE61741 Training Group...39
Table 4.6: List of 4 miRNAs selected by LASSO training in GSE24709 dataset ...44
xv
Abbreviations
NSCLC Non-Small Cell Lung Cancer SCLC Small Cell Lung Cancer
NE Neuro-endocrine
TNM Tumor-Node-Metastasis
VALSG Veterans Administration Lung Study Group LD Limited Disease
ED Extensive Disease
PET Positron Emission Tomography MRI Magnetic Resonance Imaging
CT Computed Tomography
LDCT Low Dose Computed Tomography
USPSTF United States Preventive Services Task Force HIV Human Immunodeficiency Virus
TAA Tumor Associated Antigens miRNA micro Ribonucleic Acid PCR Polymerase Chain Reaction
RT-PCR Reverse Transcription Polymerase Chain Reaction qPCR Quantitative Polymerase Chain Reaction
qRT-PCR Quantitative Real Time Polymerase Chain Reaction cPA custom Protein Array
QCM Quartz Crystal Microbalance PBS Phosphate Buffered Saline
ELISA Enzyme Linked Immunosorbent Assay
LASSO Least Absolute Shrinkage and Selection Operator
FB Fetal Brain
cDNA Complementary Deoxyribonucleic Acid IPTG Isopropyl β-D-1-thiogalactopyranoside
E. coli Escherichia coli PVDF Polyvinylidene fluoride SAS Signal Analysis Software
ROC Receiver Operating Characteristic TIF Tagged Image File Format JPEG Joint Photographic Experts Group StDev Standard Deviation
AUC Area Under Curve LDH Lactate dehydrogenase AP Alkaline Phosphatase DHFR Dihydrofolate Reductase IgG Immunoglobulin G
xvi mAb monoclonal Antibody
11-MUA 11-Mercaptoundecanoic Acid
EDC 1-Ethyl-3-(3-dimethylaminopropyl)carbodiimide NHS N-Hydroxysuccinimide
QCM-D Quartz Crystal Microbalance with Dissipation Monitoring BSA Bovine Serum Albumin
ATR
FT-IR Attenuated Total Reflection Fourier Transform Infrared Spectroscopy GEO Gene Expression Omnibus
TCGA-LUAD The Cancer Genome Atlas Lung Adenocarcinoma
TCGA-LUSC The Cancer Genome Atlas Lung Squamous Cell Carcinoma NIH National Institutes of Health
MPEA Microfluidic Primer Extension Assay COPD Chronic obstructive pulmonary disease MSE Mean Squared Error
HRG High Risk Control
SAM Self-Assembled Monolayer
1
INTRODUCTION
Lung Cancer
1.1.1. Statistics & Clinical Staging of Lung Cancer
Estimates point out to above 18 million cancer diagnosis and almost 10 million cancer related deaths in 2018 [3]. This high cancer incidences were expected to continuously increase till 2030 in all cancers but colon and prostate, and the rate of increase is expected to be more dramatic in developing countries like Turkey, when compared to developed countries [4; 5]. Lung cancer, consisting of 10% of all cancer cases, is not only one of the most prevalent cancer types but also the deadliest with being the leading cause of cancer deaths [6]. Moreover, lung cancer is expected to hold this position as the cancer type with highest fatality until the end of estimation period at 2030 [4].
Diagnosis and treatment of lung cancer is still an ongoing problem, as several morphological phenotypes and genetic abnormalities seen throughout this cancer reminds the profile of a heterogeneous disease [6]. Therefore, the disease is divided into many sub-types. The two largest divisions encompassing many subtypes are Non-Small Cell Lung Cancer (NSCLC) and Small Cell Lung Cancer (SCLC). NSCLC has a variety of subtypes such as adenocarcinoma, squamous cell carcinoma and large cell carcinoma [6], whereas SCLC is differentiated by its neuro endocrine (NE) characteristics [7]. SCLC comprises 15% of all cancer cases and is the most aggressive subtype of this cancer with its less than 7% 5-year survival rate [6; 8].
There are 2 systems currently used in clinical staging of SCLC: 4 stage Tumor-Node-Metastasis (TNM) classification system and Veterans Administration Lung Study Group (VALSG) Limited (LD) and Extensive Disease (ED) system. The LD – ED system does its categorization based on metastatic status of the cancer within or outside of thorax. Therefore, it is more informative about the response to treatment and clinically more useful [9]. Conversion between the two systems can be done easily. The first three stages (I-II-III) in 4 stage TNM system corresponds to Limited Disease in VALSG and TNM stage 4 (IV) is equivalent to Extensive Disease in VALSG system [7].
Several researches conducted using VALSG system shows that prognosis of patients in Limited Disease SCLC is better than those in Extensive Disease [10-13]. While the median survival time in Limited Disease is 18 months, it drops to 9 months in patients with Extensive Disease and to 2-4 months for untreated patients [14]. Although, prognosis is better and treatment options are more abundant in Limited Disease [9; 14], high tumor growth rate and tendency of distant metastasis in SCLC starting from the early stages of the disease makes the early diagnosis of SCLC quite challenging [15; 16].
2
Situation is similar with NSCLC. If the cancer diagnosed in early stages, radical surgery is the gold standard treatment and has good results [17]. Moreover, despite the developments seen in NSCLC through targeted therapies, such developments are lacking in SCLC Furthermore, even though there has been improvements in targeted therapies in NSCLC, there are no such advancements in SCLC [18]. According to Byers et al. (2015), one of the hindrances in the development of targeted therapies against SCLC is the lacking of diagnostic methods [18]. Therefore, diagnosing of the disease at early stages before spreading to adherent and distant tissues is important for both patient prognosis and development of treatment options in the future.
1.1.2. Imaging and Screening Options in Lung Cancer
Imaging options currently available in screening of SCLC are chest radiography, positron emission tomography (PET), magnetic resonance imaging (MRI) and computed tomography (CT) [19-21]. However, due to quick progression of the disease, two thirds of the patients are diagnosed in the late stages of the disease after onset of symptoms [15; 22; 23]. After patients are symptomatic, these screening methods require further histological evaluation and validation of the samples taken via bronchoscopic biopsy techniques and transthoracic biopsy techniques for the proper diagnosis of the disease [24-27]. Moreover, fine needle aspiration based methods are prone to false negativity due to sampling errors [26; 28].
A large longitudinal study conducted using low dose computed tomography (LDCT) with over 31500 asymptomatic people for a duration of 11 years were concluded in year 2006 with diagnosis of 484 cancer patients. Initially, the fact that 85% of the patients were diagnosed in 1st Stage and they had a 5 year survival rate of 92% gave the impression that LDCT screenings was successful [29]. However, later studies revealed a group of patients within these early diagnosed ones which had cancer growing in such a slow rate that they would not require any treatment [30]. Operating such people who would not require treatment increased morbidity rates, thus raising skepticism towards screening studies among clinicians. Although, US Preventive Services Taskforce (USPSTF) advice LDCT screenings for high risk group people, unnecessary radiation exposure of people without cancer and most importantly high false negativity rates, keeps the debate on utility of suggesting LDCT screenings going [31-33]. However, with standardizations in screenings and analysis, it is still highly expected that LDCT screenings will be widespread [34]. In the case of widespread LDCT screenings, one of the most important subjects will be cost/benefit relationship. This can be improved with development of cheap non-invasive diagnostic methods that can be used in conjunction with LDCT.
3
Role of Immune System in Cancer
1.2.1. Immunoediting
Protein expression patterns change during tumorigenesis and this triggers the release of specific antibodies by the immune system to counteract the tumor differentiation [35]. The immunosurveillance theory formulated by Frank MacFarlane Burnet and Lewis Thomas suggests an interaction between the tumorigenic cells and the immune system as the cancer develops, which pressures the tumorigenic cells to adapt to escape detection by the immune system to survive in three phases: elimination, equilibrium and escape (Figure 1.1) [35]. In a healthy individual, the immune system is constantly monitoring the body for onset of cancer to be able to generate an early innate and humoral immunogenic response before the tumorigenic cells can evolve to avoid recognition. This is supported by the increased occurrence of cancer in immunosuppressed individuals, such as those infected with human immunodeficiency virus (HIV) [36]. In addition to that, immunosuppressed people have an increase in cancer sub-types when compared to immunocompetent people [37]. Therefore, with the involvement of humoral immune system, tumor-targeting autoantibodies can be found in higher concentration in serum than the tumor-associated antigens themselves, which presents them as a valuable target for early detection of cancer [37; 38]. However, the capability of the immune system to detect tumor cells decreases throughout tumorigenesis due to cancer immunoediting. The selective pressure on the tumor to escape the immune system’s response to it results in adaptation of its cells specifically to become increasingly undetectable throughout the equilibrium and escape phases of immunosurveillance and establish their immunosuppressive tumor microenvironment [35; 39].
4
1.2.2. Tumor Associated Antigens and Autologous Anti-Tumor Antibodies in
Cancer Diagnosis
Immune system has the ability to differentiate between self and foreign. However, this system is not perfect and in certain conditions can react to self-antigens [38]. Cancer patients, being an example of the phenomena, many times respond to self-antigens most of which is expressed by the tumors. These self-antigens expressed in tumor microenvironment, later released into extracellular space and bodily fluids are called tumor associated antigens (TAAs) [38]. These antigens can be from proteins that are mutated like p53, overexpressed like NY-ESO-1, abnormally glycosylated like MUC-1, ectopically present or more [38; 40]. Utilizing tumor associated antigens (TAAs) and especially their complementary autologous antibodies for diagnosis and immunotherapy purposes has clinical advantages. From a therapeutic standpoint, tumor-targeting vaccines can be developed using TAAs commonly found in cancer patients, as well as in a personalized manner [41]. Moreover, working with TAAs is not ideal for prognostic purposes as their retrieval from the tumorigenic tissue is often only possible with an invasive biopsy procedure, which is costly and uncomfortable for the patient. Moreover, TAAs, present in low concentrations only, are expected to differ from patient to patient and are not consistently expressed by the same tumor due to cancer immune-editing. On the other hand, autologous anti-tumor antibodies are abundant in the blood serum even in early stages of cancer and are more stable than TAAs, which makes them easier to obtain from the patient in large volumes to be used in diagnostic experiments [38]. Indeed, breast and lung studies show that, autoantibody measurements against TAAs can be made 5 year before the symptomatic disease [42]. With amplifying the aberrant signals from TAAs and having the potential for compensating heterogeneity in tumor when checked in antibody panels, the autoantibodies might be the robust biomarkers for early detection of cancer [42-53] Therefore, rapid and accurate identification of such autologous antibodies is essential for the reliable development of immuno-oncogenic diagnostic methods.
1.2.3. Importance of Longitudinal Studies in Serological Biomarker Studies of
Cancer
It is important to design studies in a way that allow monitoring of biomarkers from samples of the same patients in following years. There are many studies showing importance of measuring biomarkers in following years for early diagnosis. In 2013, it was shown that incorporating change over time in a longitudinal screening of serological CA125 biomarker can diagnose more ovarian cancer patients than non-longitudinal single threshold methods. In this study, longitudinal CA125 screening was able to detect aberrant biomarker levels 10 months earlier and at 42% lower concentrations than
5
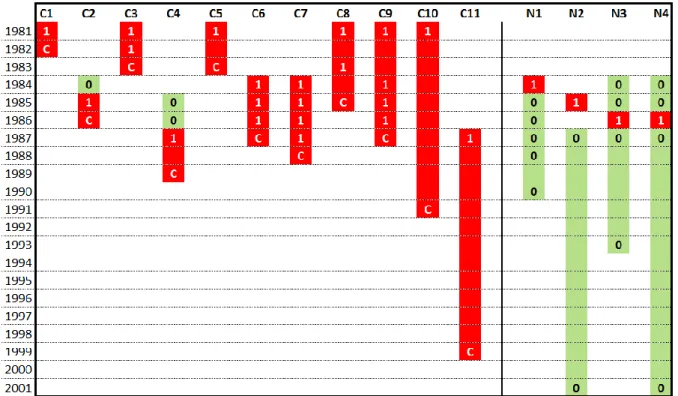
single threshold measurements [54]. Importance of longitudinal biomarker studies were also shown for mesothelioma early diagnosis [55-57]. In our previous studies autologous antibodies seem to be very effective in lung cancer diagnosis [58; 59]. Even though there are not many longitudinal studies carried with autologous antibodies, in one of the most important studies it has been shown that longitudinal serum positivity is a clear biomarker for cancer development in patient while sporadic serum positivity is an evidence for cancer to be not progressing (Figure 1.2) [2]. There are many other biomarkers detected that has possible roles in early diagnosis of other cancers, and those biomarkers can be used to detect people require application of preventative therapies [60]. If large longitudinal cohort studies can be designed to detect power of those autologous biomarkers in early diagnosis and detection of cancer recurrence, they can be of use for early diagnosis of lung cancer in conjunction with screening methods.
Figure 1.2: p53 autologous antibody seropositivity in relation to development of cancer. Anti-p53 autologous-antibody seropositivity followed between 1981 and 2001 in people with asbestos exposure. 11 people with positive serum anti-p53 antibody levels were later diagnosed with cancer (C) (C1,2,4-8,10,11: lung cancer; C3: mesothelioma; C9, lymphoma); but 4 people (N) were not diagnosed with cancer. In 11 cases where antibody positivity (“1”) was observed 1 to 12 years before the cancer diagnosis. Although, measurements were not taken for each year in all of the cases, the positivity (dark color) and negativity (light color) status can be assumed unchanged between two consequitive measurements with the same result. However the cases where negative results were interrupted by sporadic serapositivity were not diagnosed with cancer development (N1-4) [2].
6
miRNAs in Cancer
Cancer does not occur and develop purely based on its ability to thrive with genetic mutations, but require epigenetically altering of its proteins to suit the needs [61]. MicroRNAs (miRNAs) are small noncoding RNAs that interfere with translating proteins from mRNAs, thus playing a role in shaping the unique tumor microenvironment [61]. miRNAs and other non-coding RNAs do not stay confined within the cell only, but travel intracellularly and circulate in body fluids [62]. Some miRNAs are shown to have tumor suppressing or oncogenic activities and are important in many regulatory systems [63]. Uptake of miRNAs by other cells have the capability of changing their gene expression pattern, therefore these circulating miRNAs are informative about the condition of their origin like hormones and cytokines are [62]. This makes miRNAs, which can be easily obtained from biological fluids such as blood serum, a good molecule to assess the condition of a patient, a powerful diagnostic and prognostic tool [62; 64].
miRNA signatures, which are defined as a multitude of miRNAs associated with a specific condition when present together, can be used for identifying different types of cancers at their different stages throughout their progression and treatment, especially if new miRNA polymorphisms can be detected [64]. miRNAs can be profiled with more than one method, such as RT-PCR assays and tissue slide-based assays [64]. It is suggested that biomarkers such as miRNAs are necessary tools to be able to provide personalized, targeted therapies towards cancer cases as they can contribute to prognostic assessments and therapeutic targets [65]. Therefore, there have been many extensive studies to characterize and associate miRNA signatures to distinct cancers over the last decade [66], as well as attempts to create systematical tests which can potentially have clinical usage [67].
7
AIMS OF THE STUDY
Developing a reliable, robust and automated evaluation method to
re-evaluate cPA screenings of SCLC patients and healthy controls.
a) Reliably generating numeric values out of cPA screening images by filtering out low quality data.
b) Determining autologous antibodies with the highest discriminatory power between SCLC patients and healthy controls.
c) Determining autologous antibody combinations (panels) with the highest discriminatory power between SCLC patients and healthy controls.
Developing a method in Quartz Crystal Microbalance to validate cPA
screening results.
a) Demonstrating proof of concept via measuring spike-in anti-SOX2 Antibodies in PBS. b) Cross-validating QCM anti-SOX2 Ab measurements in PBS, against ELISA.
Identification and validation of novel miRNA biomarkers in Non-Small Cell
Lung Cancer.
a) Identifying datasets to be employed in for logistic regression analysis.
b) Identifying miRNAs with highest discriminatory power between NSCLC patients and high risk controls via logistic regression analysis and LASSO regularization method.
c) Validating identified miRNAs in silico. d) Validating identified miRNAs via qRT-PCR.
8
MATERIALS AND METHODS
RE-ANALYSIS AND RE-EVALUATION OF SCLC AND HEALTHY
SERA CUSTOM PROTEIN ARRAY SCREENINGS
3.1.1. Protein Array
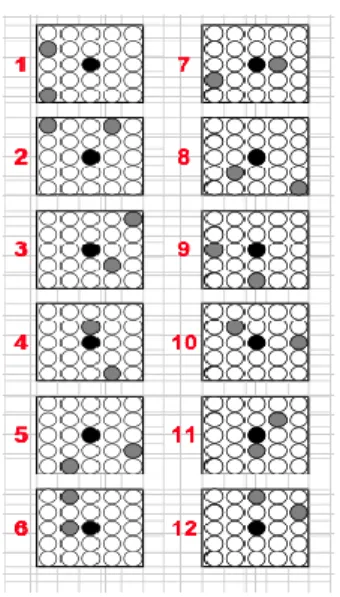
Previously in our lab, as a part of the PhD thesis of Sukru Atakan, novel autologous antibody identification experiments were carried in Protein Arrays (PAs). In that study, commercially obtained Testis PA, Fetal Brain (FB) PA and custom PAs (cPAs) were used for serum screening. Production of Testis and FB PAs were carried employing corresponding cDNA libraries. cDNAs from those libraries were inserted in IPTG inducible vectors (pQE80LSN, pQE30NST) which were then expressed in E. coli to obtain certain protein producing colonies. These colonies were spotted on the PVDF membrane to form PAs. Testis PA had 26880 clones spotted on 22 x 22 cm PVDF membranes and Fetal Brain PA had 55296 clones spotted on two 22 x 22 cm membranes. Spotting on the membranes were done in 2304 units, where in each unit was 25 circular spots arranged in a 5 by 5 square. Spot in the very middle is called an Inkdot (reference) and the 24 spots around it were containing 12 duplicate clones spotted in an intricate pattern (Figure 3.1). Each spot on a unit is lysates of E coli that inducibly expressed a certain cDNA clone from given cDNA libraries.
49 SCLC patient sera and 50 health sera were both separately pooled within their groups. Pooled sera were screened with Testis (26880 clones) and Fetal Brain PAs (55296 clones). Evaluating the results using Manual Selection Software and Signal Analysis Software, clones that were most capable to
Figure 3.1. 12 distinct protein spotting patterns and a reference InkDot on a PA unit. Pattern info of how 12 different protein clones are spotted around a reference InkDot on a single PA unit.
9
distinguish SCLC from healthy controls were identified to be used in generation of custom Protein Arrays (cPAs). Later, all of 49 SCLC patient sera and 50 healthy sera were screened individually using cPAs. Numeric values generated via SAS were used in Monte Carlo analysis to select best panels with the highest sensitivity values at certain specificity values. The best results were 31% sensitivity at 100% specificity incorporating 2 antigens and 46% sensitivity at 90% specificity incorporating 6 antigens[59]. However, the points to improve in that previous study was that the evaluations were lacking elimination of low quality data which may be present due to inadequate serum coverage, wrinkles on array strips and manual recording of cPA screening images or a combination of these issues. Resulting in a possible bias added into further ROC plotting which was done based on that data. Moreover, the generation of ROC curves were made manually and did cover a limited number of antibody combination panels among all possible combinations. With this rationale, we developed a low quality signal elimination method. Array data eliminated with the new method re-evaluated and used to generated individual antibody & combinatory biomarker panels, which then used to plot several ROC curves.
3.1.2. Processing of cPA images in Photoshop
First of all, custom Protein Arrays strips were too long to have screening images taken in a single photograph with high enough resolution. Therefore, each custom Protein Array strip were recorded as 3 separate non-overlapping images (A, B, C sections). As further analysis required them to be joined together, Photoshop was used to merge these 3 sections of a cPA strip to create a single image of each cPA strip. Initially, a canvas is created in Photoshop using shortcuts (CTRL+N). The canvas had following features: Width 152 pixels, Height 1753 pixels, Resolution 72 pixel/inch, Mode: Grayscale / 16 bit, Background Contents: Special, Color Profile: Dot Gain 15%, Pixel Aspect Ratio: Square Pixels. Rectangular Marquee Tool were used to select the individual strip parts from 3 sections of the cPAs (Figure 3.2).
10
Selected array piece was copied onto the canvas. This step was repeated for each of the 3 sections (A, B, C) considering their vertical alignment in respective order. Before permanently merging the images in canvas via shortcuts (CTRL + Shift + E), number of Inkdots in each generated image were checked to be 15 to verify correct alignment of 3 sections. After the image is merged, Level Adjustment is carried on the strip image to define the peak signal, amplify the signal intensity and standardize it. This procedure is necessary to make sure signals are comparable between different strips. Following standardization via Level Adjustment, single piece cPA strip image generated on Photoshop was saved in TIF or JPEG format. Given steps in generation of single cPA image from 3 sections were repeated for each and every cPA strip. After each cPA strip has a unified image in Photoshop, all array strips were arranged in a single canvas.
3.1.3. AIDA Signal Analysis Software
Level Adjusted and saved images were opened in AIDA with given display control settings: Quantum Level, Range 0 to 255, Gamma at lowest setting, Show Underexposed (checked). Array area was defined using Grid Definition within the Array Definition section of AIDA tools. With 15 signal Figure 3.2. Selection of Individual cPA Sections in Photoshop via Rectengular Marquee Tool and an Example of Images Employed in Generation of Unified Images. Using Rectengular Marquee Tool in Photoshop, individual cPA strip sections were coppied from A, B, C images. Each of the A, B and C image corresponds to a segment of cPA strips photographed adjacently. A part is shown here in this image.
11
harboring units (with an Inkdots in the middle of each unit) existing on our cPA strips, Grid Definition settings were as given: <no pattern>, Rows: 15, Columns: 1, X Spacing: 0pixel, Y Spacing: 0pixel. With settings adjusted as needed, array area and individual inkdots were defined with avoiding the white background. Within each of 15 signal harboring units another Grid Definition was done to define 24 protein spots + Inkdot in the middle. 5 x 5 ring formation were used with 23 pixels set as the diameter of each ring. After initial settings were done, grids were further adjusted manually to better fit each of the 24 protein spots + Inkdot. This procedure was carried out for all protein spots existing in signal bearing units of every cPA strip. After grid definition was complete, Background Definition was set to Lowest Grid Dots from the drop down menu. Background definition with Lowest Grid Dots allow us to define the background by averaging certain number of lowest signal dots where the number of dots used is defined by our choice. Lastly in settings, integral-background was used for normalization. Finally, pixel intensity levels were measured using Final Calculation in Array Measurement section and saved as excel file to be used in further analysis.
3.1.4. Data Filtration & Generation of Receiver Operating Characteristic Curves
There were low quality signals possibly caused by several reasons such as inadequate sera coverage on cPAs, wrinkling on cPA strips and manual image recording. The low quality sera, named here as “bad data”, were eliminated by a cut-off value filtration. Mean was calculated as average of 360 spots on the cPA strip with 15 signal harboring units. Following standard deviation (StDev) was calculated individually for each of the 15 signal harboring units on the cPA strip. The mean of signal intensities of all spots on the cPA strip was taken as a baseline level in each signal harboring unit. Then mean minus 1.5 StDev of the specific signal harboring unit were used to set the cut-off in that particular signal harboring unit. Applied cut-off was represented by the formula: (Mean)-(1.5xStDev). If a signal harboring unit had spots that fail to pass the set cut-off, all signals in that signal harboring unit were discarded. Set cut-off’s efficiency was verified by checking cPAs with eye to see if the the dark areas on the strips were in match with cut-off eliminated areas.
Data collection and filtration were followed by generation of Receiver Operating Characteristic (ROC) curves to test diagnostic capabilities of each antibody. ROC curves for individual antibodies were plotted via R program’s “pROC” package. Plotted individual ROC curves were sorted based on their AUC values. 11 antibodies with highest AUC values were selected for plotting combination ROC curves. In the plotting of ROC curves for antibody combinations “protComb” package was used in R. Code for this custom “protComb” package was written by Murat Isbilen. “protComb” package equally weighed all antibodies while generating combination ROC curves for a given antibody combination panel.
12
QUARTZ CRYSTAL MICROBALANCE (QCM) METHOD
DEVELOPMENT
3.2.1. Serum Collection
For this study sera of 10 SCLC patients and 10 age matched healthy controls were used. For SCLC patients, ethics committee approval was previously obtained from Atatürk Chest Disease and Chest Surgery Education and Research Hospital, Ankara, Turkey. For healthy controls, ethics committee approval was previously obtained from Çapa Chest Diseases and Chest Surgery Education and Research Hospital of İstanbul, Turkey. The previous ethics committee approvals were re-issued and approved by Bilkent Ethics Committee. The diagnosis of SCLC patients was confirmed pathologically. Clinical data of patients, such as gender, age, LDH levels, tumor stage and AP levels, were collected at the time of diagnosis. All of the SCLC patients were on chemotherapy treatment. Moreover, follow up of patients and generation of survival data is carried by clinicians. Serum collection was handled at time of diagnosis for the patients. Controls were assessed to be healthy at the time of serum collection. All sera were mainly aliquoted at 100 mL volumes and at smaller volumes for frequent use. All sera was stored at -80 oC.
3.2.2. ELISA Measurements
SOX2, p18 and DHFR proteins used in ELISA were produced using prokaryotic pQE expression system (Qiagen Inc., Valencia, CA, USA). DHFR served as positive control and p18 served as negative control in the experiments.
For coating, 96 well Immulon 4 HBX Flat Bottom Microtiter Plates (Thermo Scientific, Rochester, NY, USA)were coated with 100 uL of 2 ug/mL purified protein, corresponding to 200 ng protein per well, at +4 oC for 24 hours. Followed by a manual wash step where each well is washed for
6 times using 300 uL of wash buffer (PBS/T with 0.005% Tween20) in each wash. Using 200 uL of blocking buffer (PBS/T with 5% non-fat dried milk and 0.005% Tween20) per well, each well was blocked at +4 oC for 16 hours. Plates were re-washed as mentioned above. Sera diluted to either 1:400
or 1:1600 were used for serum incubation at room temperature for 2 hours.
In the previous studies in our lab, ELISA measurements of individual antibodies with highest AUC (in individual ROCs) were done with in house protocol. However, the determination of positive and negative signal were made based on Absorbance cut-off and no anti-protein IgG concentrations were calculated. Therefore, we generated standard curves of spiked-in anti-SOX2 mAb in varying serum concentrations and PBS. 6 ELISA standard curves were generated by spiking-in anti-SOX2 mAb in
13
1:400, 1:1600, 1:3200, 1:6400, 1:12800 serum dilutions and PBS buffer. Standard curve dilutions were covering between 200 ng/mL and 0.195 ng/mL. 5 dilution steps were prepared by serially diluting 200 ng/mL with 1/4 dilution steps. Standard curves were compared to each other to see the effects of non-specific binding in each serum dilution. Using unknown dilutions of patient sera, serum anti-SOX2 autologous antibody concentrations of patients with highest sera-positivity were back calculated. Calculated values were used in determination of quartz crystal chip modification parameters.
3.2.3. QCM Chip Modification
AT cut 5 MHz Quartz Chip surfaces were cleaned by pulse sonicating in degassed double distilled water. Procedure was repeated 3 times for 3 minutes (replacing water each time). Sonication process was repeated degassed in analytical grade Ethanol (Sigma-Aldrich) again 3 times for 3 minutes (replacing ethanol each time). After sonication, chips were dried under Nitrogen gas and dipped in Piranha Solution (3:1 mixture of sulfuric acid and 30% hydrogen peroxide) for 10 seconds to etch the surface. Followed by three times degassed double distilled water rinse and 3 times Ethanol rinse. Cleaned chip was immersed in 2mM ethanol solution of 11-Mercaptoundecanoic Acid (11-MUA) for an overnight incubation in the dark at room temperature. After 11-MUA incubation, chips were primed with PBS buffer in QSense Explorer QCM-D device (Biolin Scientific). Flow rate was 27 uL/sec. Surface is treated with 1:1 mixture of freshly prepared 400mM EDC and 100mM NHS for a duration of 8 min with 27 uL/sec flow rate (total volume 216 uL). EDC-NHS treatment immediately followed by 50 ug/mL SOX2 protein injection (in PBS with pH: 7.4 or 5.5, filter sterilized in 0.2nm filter) for 8 min (total volume 216 uL). Surface was blocked with 50 ug/mL BSA (in pH: 7.4 PBS) for 8 min (total volume 216 uL). Unreacted NHS esters were capped with 1M ethanolamine solution (pH: 8.5) treatment for a duration of 8 min. Chips were primed with PBS (pH: 7.4) for a short while before the measurements were carried.
3.2.4. QCM Measurements
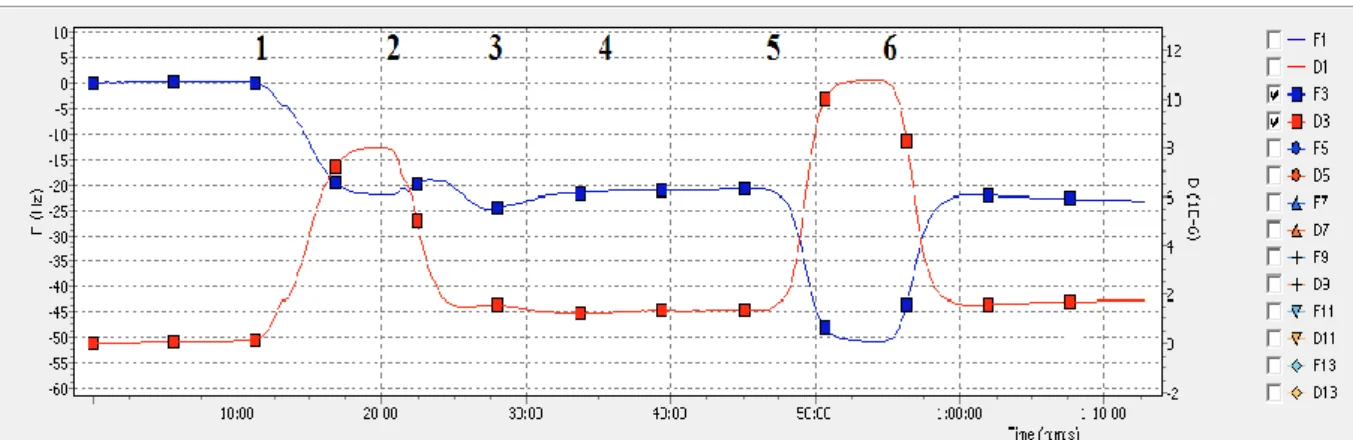
Samples for QCM measurement were prepared in PBS solution by spiking-in anti SOX2 mAb (MAB2018) (R&D Systems, Minneapolis, MN, USA). Measurements were taken one after the other with cycles of 8 min sample injection and 15 min PBS injection. Flow rate was set to 27uL/min in pump. Signals were recorded and analysis were carried in recorded data using GraphPad Prism 6 (GraphPad Software Inc., La Jolla, CA, USA)
14
Anti-SOX2 mAb binding (8 min at 27uL/min) to SOX2 protein immobilized Au surface in a concentration range 32 ng/mL and 512 ng/mL were carried and frequency changes on the AT cut 5 Mhz crystal were recorded. Recorded changes are plotted to generate a calibration curve. Measurements were than fitted to 1:1 Langmuir binding model to determine the binding association and dissociation rates. Pearson R correlation analysis were also carried to determine correlation levels between the model and the experimental results.
3.2.5. Surface Characterization via ATR FT-IR
QCM Chip was subjected to several surface modification steps and Attenuated Total Reflection Fourier Transform Infrared Spectroscopy (ATR FT-IR) measurements were taken for two steps of the surface modification: following 11-MUA incubation and following SOX2 protein conjugation to the surface via EDC/NHS amine coupling chemistry. Moreover, ATR FT-IR measurements were also taken after sample binding to the modified chip surface (anti-SOX2 mAb binding).
3.2.6. QCM and ELISA Comparison
Several samples prepared for and analyzed in both ELISA and QCM. Generated data were used to plot standard curves for both methods. Standard curves of QCM were subjected to comparison to ELISA data to evaluate assay performance.
DISCOVER AND VALIDATION of miRNA BIOMARKERS in
NON-SMALL CELL LUNG CANCER
3.3.1. Dataset Selection
All serum, plasma and whole blood GEO Datasets for Non-Small Cell Lung Cancer (NSCLC) between 2008 and 2018 were searched and sorted based on the sample type and platform. 6 datasets were detected. However, else than 2 datasets, GSE24709 and GSE61741, rest of the datasets were all from different platforms from each other. Therefore, for further analysis GSE24709 and GSE61741 were selected and downloaded from GEO. Moreover, all of the tumor tissue sample miRNA sequencing data from the Cancer Genome Atlas Lung Squamous Cell Carcinoma (TCGA-LUSC) and Lung Adenocarcinoma (TCGA-LUAD) were downloaded from National Institutes of Health (NIH). GEO dataset GSE24709 contains febit Homo sapiens miRBase 13.0 Microfluidic Primer Extension Assay (MPEA) data of peripheral blood samples drawn from 19 healthy controls, 28 lung cancer patients and
15
24 chronic obstructive pulmonary disease (COPD) patients as high risk group. GEO dataset GSE61741 contains miRNA microarray data of serum samples drawn from 94 healthy controls, 15 long-lived individuals, and 940 patients affected from various diseases.
3.3.2. miRNA Selection Incorporating Logistic Regression and LASSO
Regularization
Differential miRNA expression analysis was conducted between the 19 normal controls of GEO24709, and 17 non-small cell cancer lung cancer (NSLC) patients of the same dataset. miRNAs with the Benjamini-Hochberg corrected p-value less than 0.05, and log2 fold change over 1.0 were considered to be differentially expressed. The same analysis were conducted between 73 Lung cancer samples, and 94 healthy control samples of GSE61741 dataset. Filters and procedures were identical to the previous analysis. 18 miRNAs were found to be upregulated in cancer group in both of the datasets. Later, LASSO regression model were used to select best miRNA panel in terms of differentiation power between NSCLC and Healthy Control groups. For this, samples from GEO61741 were assigned into Training and Validation groups. Training group were used to train the logistic regression model. In the training of logistic regression model, LASSO regularization using glmnet() package of R program were used to select miRNAs. miRNAs selected among 18 significantly upregulated miRNAs, and the selection was done on the basis of ability to separate NSCLC patients from Healthy Controls out of 18 significantly upregulated miRNAs. 10 fold cross validation with various λ (lambda) values was conducted, and Area Under Curve (AUC) was used as the error metric. Model with the lowest λ value which lies with the 1 Standard Error of the model with highest mean AUC were chosen. Selected model had 5 miRNAs in the panel. 5 miRNA panel was then used to draw Receiver Operating Characteristics (ROC) curve using the both training and validation datasets generated from GEO61741.
5 miRNAs obtained in the previous analysis were used to train a new model with GSE24709 dataset. 10-fold cross validation over the range of different λ values was conducted on the whole dataset. Mean Squared Error (MSE) was used as the error metric. Model with the lowest λ value which lies within the 1 Standard Error of the model with the lowest MSE was chosen. Selected model had 4 of the miRNAs from previous panel. These 4 miRNAs were then used to draw Receiver Operating Characteristics (ROC) curve by using GSE24709 expression data.
16
3.3.3. Serum Samples
For this study sera of 7 Non-Small Cell Lung Cancer (NSCLC) patients and age, gender and smoking status (package day x years) matched High Risk Group Controls (HRG) were used. Mean age was 64.86 for NSCLC patients and 63.14 for HRG group. Mean smoking level (package day x years) was 38.00 for NSCLC patients and 41.83 for HRG group. 6 of the NSCLC patients and their matching HRG controls were male, while 1 NSCLC patient and her matching HRG control was female. Moreover, all patients, except one, had lung lobectomy operation (excision of the lung part containing limited tumor) prior to serum collection. For the one patient with no surgery, serum collection was done prior to bronchoscopy. Diagnosis of the patients were confirmed pathologically and patients were identified as either adenocarcinoma or squamous cell carcinoma. Controls were assessed to be healthy at the time of serum collection. All sera were stored in bulk and were stored at -80 oC.
3.3.4. Hemolysis Assessment
Hemolysis status of sera were assessed via oxy-hemoglobin peaks at 414 nm. Absorbance<0.072 filter at 414 nm were used for low hemolysis risk, 0.072≤Absorbance≤0.3 filter at 414 nm were used for moderate hemolysis risk and Absorbance>0.3 at 414 nm were used for high hemolysis risk [68]. Measurements in 414 nm wavelength were taken with NanoDrop One/One C Microvolume UV–Vis Spectrophotometer (Thermo Fisher Scientific, Fitchburg, WI).
3.3.5. RNA Extraction and Quantification
For miRNA isolation from sera miRNeasy Serum/Plasma Advanced Kit (Qiagen Inc., Valencia, CA, USA) (Cat. No: 217204) were utilized. miRNA isolations were carried according to the manufacturer’s recommendations. For each isolation 200 uL serum were used. Isolated RNA is re-suspended in 20uL Nuclease Free Water (Ambion, Carlsbad, CA, USA) and stored at -20 oC for a day
before cDNA synthesis. To determine quantity and quality of the RNA isolates, measurements were taken with NanoDrop One/One C Microvolume UV–Vis Spectrophotometer (Thermo Fisher Scientific, Fitchburg, WI) before they are stored at -20 oC.
3.3.6. cDNA Generation and Quantification
cDNA synthesis reaction from extracted RNA were done using miRCURY LNA miRNA RT Kit (Qiagen Inc., Valencia, CA, USA) (Cat. No: 339340) according to the manufacturer’s
17
recommendations. To determine quantity and quality of the synthesized cDNA measurements were taken with NanoDrop One/One C Microvolume UV–Vis Spectrophotometer (Thermo Fisher Scientific, Fitchburg, WI) before they were used in qPCR analysis. (-) Reverse Transcription (RT) and (+) RT controls were used. (-) RT controls are generated using hsa-miR-103a-3p internal reference primer and isolated miRNAs from H1, H2, N1, N2 samples. (+) RT control were lacking isolated miRNA.
3.3.7. Quantitative Real Time Polymerase Chain Reaction (qRT-PCR)
Primers for target miRNAs (hsa-mir-130b-5p, hsa-miR-132-5p, hsa-let-7d-3p, hsa-miR-1227-3p, hsa-miR-199a-5p) and primers for internal controls (hsa-miR-16-5p and hsa-miR-103a-3p) were re-suspended in 220 uL of Nuclease Free Water (Ambion, Carlsbad, CA, USA) and stored at -20 oC until
use.
miRCURY LNA SYBR Green PCR Kit (4000) (Qiagen Inc., Valencia, CA, USA) (Cat. No: 339347), clear/white low profile, 96 well plates (Bio-Rad, USA) (Cat. No: HSR9905) and LightCycler 480 II (Roche, USA) were used for performing qRT-PCR experiments. SYBR Green was used as the reporter. Every miRNA were run in triplicate for each sample for a total of 14 samples. 7 Samples were NSCLC patients with serums collected before thoracic surgery, and 7 samples were their matched high risk controls. Each reaction consisted of 5 uL miRCURY LNA SYBR Green Master Mix, 3 uL of 1:60 diluted cDNA, 1 uL miRNA primer, 1uL Nuclease Free Water.
Reaction steps consisted of first incubation at 95 oC for 10 min, followed by 50 cycles of
incubation at 95 oC for 15 seconds and 56 oC for 1 min. Melting curve analysis were carried between 56 oC and 90 oC. In every PCR plate, for every miRNA, one template control with three replicates was also
run.
Hsa-miR-16-5p was used as endogenous reference control for normalization by manually calculating Ct values out of ΔΔCt Method.
3.3.8. Data Analysis
Data analysis were done using hsa-miR-16-5p as endogenous reference control for normalization. Ct calues calculated with ΔΔCt Method. Graphpad Prism 6 (GraphPad Software Inc., La Jolla, CA, USA) program were used for calculations and all plotting.
18
RESULTS
RE-ANALYSIS AND RE-EVALUATION OF SCLC AND HEALTHY
SERA CUSTOM PROTEIN ARRAY SCREENINGS
4.1.1. Protein Array
In this part of the study, we tried to re-analyze a previously conducted experiment in pursuit of improving evaluation quality and resulting ROC curves. For this we used images of cPAs used in screening of 49 SCLC patients and 50 healthy sera in that experiment conducted by PhD. Sukru Atakan.
4.1.2. Processing of cPA images in Photoshop
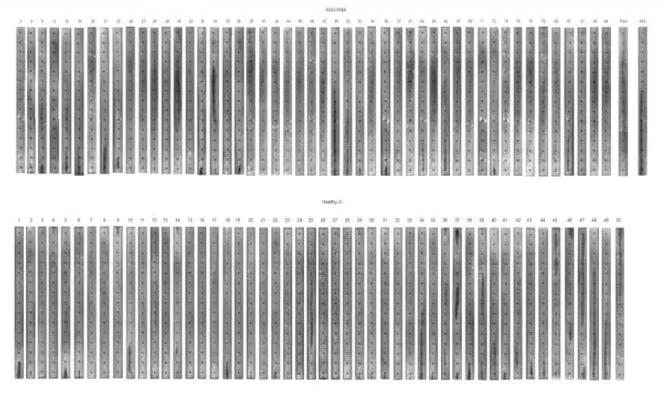
cPA images used in screening of 49 SCLC patients and 50 healthy controls were processed in Photoshop to generate single piece images. These images later on grouped in a single Photoshop canvas. Both the single cPA images and grouped cPA image, seen in Figure 4.1, used in AIDA software analysis to generate numerical readings out of cPA screening images.
Figure 4.1: All cPA strips used in screening of SCLC patients and Healthy Controls. 3 sections of each cPA strip is joined
19
4.1.3. Data Filtration & Generation of Receiver Operating Characteristic Curves
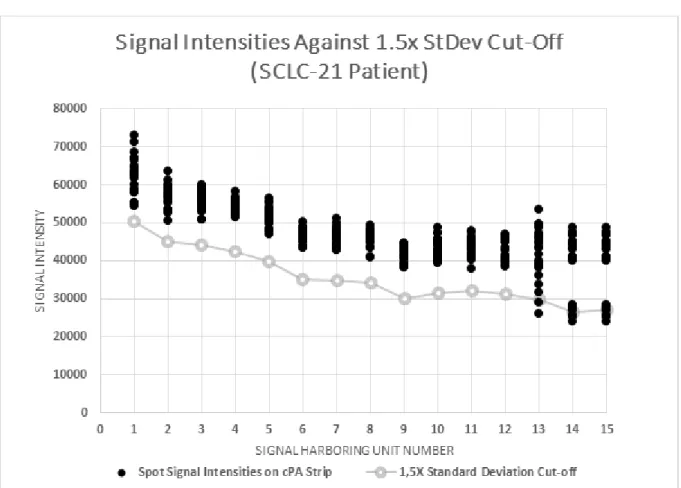
Bad data was a potential problem in evaluating the signals. Because lowest intensity spots were used to set background (noise) levels. Also, in control PAs the lower background values lead to higher false positivity, verifying the problem with low intensity signals. Elimination of bad data were done through cut-off value filtration. In the decision of keeping or eliminating a certain signal harboring unit, overall mean of that cPA strip and StDev of the corresponding signal harboring unit were used. (Mean)-(2.5*StDev) was the first cut-off to be tried, however, this approach resulted in elimination of positive signals together with bad signals (shady areas). Therefore, (Mean)-(1.5*StDev) was tried which successfully eliminated signal harboring units with bad data (Figure 4.2). The remainder of sections used in ROC curve generation as well as eliminated signal harboring units were shown in Figure 4.3.
Figure 4.2 An Example of Signal Harboring Unit Elimination Using 1.5x StDev Cut-off. Gray line indicates the 1.5x StDev Cut-off calculated for every signal harboring cell. If a signal harboring cell had signal readings below the decided cut-off, as in the cases of 13th, 14th and 15th cells in here, the entire set
![Figure 1.1: Schematic illustration of immunosurveilance theory [1]](https://thumb-eu.123doks.com/thumbv2/9libnet/5669907.113514/19.892.198.695.755.1068/figure-schematic-illustration-immunosurveilance-theory.webp)