/ ; / ^ ■■ / k f è
■US2
lâSB
Ai l /: γ-тим о áüPP^HtaSDR < ifci,>lF ;
/ ΝΓ .ANALYSIS OF TUMOR SUPPRESSOR GENES IN TESTIS CANCER
A THESIS SUBMITTED TO
THE DEPARTMENT OF MOLECULAR BIOLOGY AND GENETICS AND THE INSTITUTE OF ENGINEERING AND SCIENCE OF
BELKENT UNIVERSITY
IN PARTIAL FULLFILMENT OF THE REQUIREMENTS FOR THE DEGREE OF MASTER OF SCIENCE
BY REŞAT ÜNAL AUGUST, 1998
D)M
і і Ч
198?
I certify that I have read this thesis and that in my opinion it is fully adequate, in scope and in quality, as a thesis for the degree of Master of Science.
i f l . L
Prof Dr. Ay Öğüş
I certify that I have read this thesis and that in my opinion it is fully adequate, in scope and in quality, as a thesis for the degree of Master of Science.
Assoc. Prof Dr. Tayfun Özçelik
I certify that I have read this thesis and that in my opinion it is fully adequate, in scope and in quality, as a thesis for the degree of Master of Science.
Işık (xT ulug
Approved for the Institute of Engineering and Science
ABSTRACT
ANALYSIS OF TUMOR SUPPRESSOR GENES IN TESTIS CANCER
REŞAT ÜNAL
M. S. in Molecular Biology and Genetics Supervisor: Asst. Prof. Dr. Işık G. Yuluğ
August 1998, 97 Pages
At least two classes of genes are involved directly or indirectly in the regulation of cell growth and differentiation. One group of these genes, known as tumor suppressor genes, is involved in cellular regulation by inhibiting uncontrolled proliferation. The most frequent genetic alteration in tumor suppressor genes is loss of one of their alleles and this is called “loss of heterozygosity” (LOH). Through several studies it is found that LOH in tumor suppressor genes is associated with uncontrolled cellular proliferation in many cancers.
Testis cancer is a common cancer among young men. The disease is lethal for
20-30% of the young patients and the risk of having testis cancer increases in industrialized countries. Turkish population is a young population where testis cancer might be an important threat. The relation between distinct genetic alterations and testis cancer has been studied. LOH studies in testis cancer also have been performed however the number of such studies is very low.
In this study the relation between testis cancer and the genes BRCA\, BRCAl and
PTEN is investigated on 18 tumor samples of 10 individuals by using 8 highly
polymorphic intragenic and extragenic markers with a PCR based LOH assay. LOH in BRCA1 was observed in two tumors of two individuals, and LOH in BRCAl was observed in five tumors of two individuals. No LOH was found within the PTEN gene where only one intragenic marker was used for studying LOH status.
ÖZET
TESTİS KANSERLERİNDE TÜMÖR BASKILAYTCI GENLERİN TANIMLANMASI
REŞAT ÜNAL
Yüksek Lisans Tezi, Moleküler Biyoloji ve Genetik Bölümü Tez Yöneticisi: Yardımcı Doçent. Dr. Işık G. Yuluğ
Ağustos 1998, 97 sayfa
En az iki tür gen, doğrudan ya da dolaylı olarak hücre büyümesi ve farklılaşması üzerinde rol oynamaktadır. Bu genlerin bir grubu tümör baskılayıcı genler olarak bilinmektedir ve hücresel düzenleme görevini, kontrolsüz hücre bölünmesini engellemek suretiyle yerine getirmektedir. Tümör baskılayıcı genlerde en sık rastlanan genetik değişiklik ilgili genin alellerinden bir tanesinin kayba uğramasıdır ki tümör baskılayıcı genler için karakteristik olan bu olay heterozigotluğun kaybı (loss of heterozygosity) olarak tanımlanır.
Çeşitli çalışmalar sonucunda tümör baskılayıcı genlerdeki LOH ile birçok kanser türündeki kontrolsüz hücre bölünmesini arasındaki bağlantı gösterilebilmiştir.
Testis kanseri genç erkekler arasında sıklıkla görülen bir kanser türüdür. Bu hastalık genç hastaların %20-30’unda ölümle sonuçlanmaktadır ve sanayileşmiş ülkelerde testis kanserine yakalanma riski artmaktadır. Türk popülasyonu testis kanserinin ciddi bir tehdit oluşturabileceği genç bir popülasyondur. Çeşitli genetik değişimler ile testis kanseri arasındaki ilişki çalışılmıştır. Testis kanserlerindeki heterozigotluğun kaybına ait bazı çalışmalar varolmasına karşın bunların sayısı oldukça azdır.
Bu çalışmada testis kanseri ile BRCAl, BRCA2 ve P7EY genleri arasındaki ilişki 10 hastaya ait 18 tümör varyantı üzerinde 8 yüksek oranda polimorfık gen içi ve gen dışı işaretleyici kullanılarak PCR temelli bir LOH analizi yöntemi ile araştırılmıştır. İki hastaya ait iki tümörde BRCAl geninde ve iki hastaya ait beş tümörde BRCA2 geninde LOH’a rastlanmıştır. Yalnızca tek bir gen içi işaretleyicinin kullanıldığı PTEA^ geninde LOH gözlenmemiştir.
ACKNOWLEDGEMENTS
First of all, I would like to express my gratitude to A sst Prof. Dr Işık G.
Yuluğ for being with me at all times and under all circumstances both in science and
in private life, and for providing all the requirements for the completion of my thesis. This thesis would never prove to be true without her close interest and corrections. I would also like to thank very much Dr. Aydın Yuluğ for helping me with photographs.
I would like to thank our chairman Prof. Dr. Mehmet Öztürk for making it possible to do my master in such a department with great facilities, for his valuable advice and for being available at all times. I also thank Assoc. Prof. Dr. Tayfun
Özçelik for showing the importance of attentiveness and peevishness both in science
and in private life.
I thank Dr. Ergiin Pınarbaşı for his moral support at hard times in my first days; to Dr. Cengiz Yakicier for his scientific contributions and primers.
I also thank Prof. Dr. Haluk Özen and Prof. Dr. Ayşe Ayhan for providing the samples and the clinical data for my work.
I would like to express my deepest gratitude to Prof. Dr. Cihan Öner who made it possible for me to work in his laboratory as a special project student during my undergraduate education, and for introducing me to the field of molecular biology and genetics.
Many thanks to H ilal Özdağ for her sincere friendship and providing materials that I was in need of; to Cemaliye Akyerli for letting me to be her big
brother and a good friend and for sharing lots of good things with me; to Arzu Atalay for being a good and enjoyable group friend; to Tolga Çağatay for sharing his computer, car, papers, and friendship with me; to Tuba Dinçer for all that laughter and making me always happy; to Emre Sayan for his close and warm relation, and for his sincere and honorary friendship; to Berna Özgelik for friendly chats; to
Birsen Cevher for her naive and kind behaviour; to Liitfiye Mesci for sharing her
experience; to Alper Romano and Korkut Vata for their deep philosophical and scientific comments; to Çağla Eroğlu and Necati Fındıklı for being good laboratory friends; and to Füsun Elvan for enabling my work to proceed in a fast and amusing manner. I thank my dear friend Buket Yılmaz for being with me always and sharing both my good and bad moments, for showing her sincere friendship and honoraiy goodwill all the time, for giving me important clues on the real values in life which deserve to be considered, and for making my time here more valuable and amusing with her existence. Among the new comers, I thank the lovely facsist Gülayşe İnce, the proud novice Bileda Bilican, the polite Tolga Emre, the dear/IsA Öztan who, for some reason, thinks I am always busy; and Hani El-Otabi, whom I think is as warm as his country, for his help.
Many thanks to Harun Boylu who was always with me with his nice chat all the year and to my house friend Tolga Ekmekçi for his help and concern.
I owe my way of life to my dear grandmother Semiha Ayan who was with me during the last 14 years, shared all my happiness, always cared for my health and appetite, and who made me the center of her life. All the moments that we shared and will share are very special. I would like to express my deepest gratitude to my grandmother who has the greatest role for my becoming what I am today and who enabled this with great devotion for years asking for nothing in return.
I also would like to express my love and gratitude to my dear father Dr.
Nevzat Ünal who encouraged me for my education and who provided everything to
complete my master study; to my precious mother Yasemin Ünal whom I always felt very close to and could sh^e everything easily, who made me to overcome all the obstacles, and whose love and support was always present; to my kind-hearted younger brother M ehmet Ünal who always made me feel his joy and charm despite the distance, and the happiness of having a brotherhood and, who always managed to make me laugh; to Hakan Ünal for whom I feel myself lucky to have. He is the one who is always closer to the true than I am with his reasonable approach and experienced behaviour despite his young age and who always shared his love with me generously.
Finally I would like to thank my uncles Doğan Ayan and especially Erdoğan
Ayan, also his son Doğan Ayan junior, who always made me feel exceptional and
gave every kind of support. Special thanks to Uğur Çaçaron and his son İlker Emre
Çaçaron for his moral support by those long phone calls.
Thank vou ALL from the heart...
TABLE OF CONTENTS TITLE SIGNATURE PAGE ABSTRACT ÖZET ACKNOWLEDGEMENTS TABLE OF CONTENTS LIST OF FIGURES LIST OF TABLES ABBREVIATIONS in IV Vlll xn XIV XV CHAPTER 1. INTRODUCTION 1.1 Tumor Suppressor Genes 1.2 Loss of Heterozygosity (LOH)
1.3 Polymorphism and Polymorphic Markers
1.4 Breast-ovarian Cancer Susceptibility Gene 1 {BRCA1) 1.4.1 Loss of Heterozygosity on Chromosome 17
1.5 Breast Cancer Susceptibility Gene 2 {BRCA2) 1.5.1 Loss of Heterozygosity on Chromosome 13 1.6 Phosphate Tensin Homolog {PTEN)
1 1 3 5 9 11 14 15 17 Vlll
1.7 Testis Cancer 18
1.7.1 Germ Cell Tumor of Testis 20
1.7.2 Causes of Testis Cancer 21
1.7.3 Cellular Classification and Staging in Testis Cancer 22
1.7.4 Treatment of Testis Cancer 27
1.7.5 Unanswered Questions in Testis Cancer 27
1.8 Molecular Biology and Genetics of Testis Cancer 28
1.9 AIM AND STRATEGY 32
CHAPTER 2. MATERIALS AND METHODS 34
2.1 MATERIALS 34 2.1.1 Reagents 34 2.1.2 Nucleic Acids 35 2.1.3 Oligonucleotides 35 2.1.4 Enzymes 35 2.1.5 Electrophoresis Materials 36
2.1.6 Photography and Autoradiography 36
2.1.7 Radioisotopes 36
2.2 SOLUTIONS 37
2.2.1 General Solutions 37
2.2.2 Solutions for Cold and Radioactive Polymerase Chain Reactions 37
2.2.3 Solutions for DNA Isolation from Blood 38
2.2.4 Solutions for DNA Isolation from Paraffin Embedded Tissue 39 2.2.5 Solutions for Non-Denaturing Polyacrylamide Gel Electrophoresis 39
2.2.6 Solutions for Silver Staining 39
2.2.7 Solutions for Radioactive Labelling 40
2.3 PATIENT INFORMATION 41
2.4 METHODS 43
2.4.1 DNA Isolation from Blood 43
2.4.2 DNA Isolation from Paraffin Embedded Tissue 44
2.4.3 Agarose Gel Electrophoresis and Visualization o f DNA Fragments 44
2.4.4 DNA Size Markers 45
2.4.5 Polyacrylamide Gel Electrophoresis 46
2.4.6 Quantification of DNA 46
2.4.7 Polymerase Chain Reaction (PCR) 47
2.4.7.1 Optimization of PCR Conditions 48
2.4.7.2 Cold PCR 48
2.4.7.3 Radioactive PCR 49
2.4.8 Radioactive Labelling of DNA 50
2.4.9 Silver Staining 50
2.4.10 Treatment of Radioactive Gels 51
CHAPTER 3. RESULTS 52
3.1 DNA Isolation 53
3.1.1 DNA Isolation from Peripheral Blood 53
3.1.2 DNA Isolation from Paraffin Embedded Tissues (PET) 54
3.2 Polymerase Chain Reaction (PCR) 55
3.2.1 Optimization of Polymerase Chain Reaction Conditions 55
3.2.2 Cold Polymerase Chain Reaction 56
3.3 Non-Denaturing Polyacrylamide Gel Electrophoresis
3.4 Determination Of Allele Loss for Each Marker by Silver Staining and/or Autoradiography
3.4.1 Assessment of D17S776 for Loss of Heterozygosity 3.4.2 Assessment of D17S800 for Loss of Heterozygosity 3.4.3 Assessment of D17S855 for Loss of Heterozygosity 3.4.4 Assessment of D17S856 for Loss of Heterozygosity 3.4.5 Assessment of D13S260 for Loss of Heterozygosity 3.4.6 Assessment of D13S267 for Loss of Heterozygosity 3.4.7 Assessment of D13S289 for Loss of Heterozygosity 3.4.8 Assessment of PTEN iov Loss of Heterozygosity
3.5 CONCLUSION 59 60 60 62 63 65 67 68 70 71 82 CHAPTER 4. DISCUSSION 83 REFERENCES 90 XI
LIST OF FIGURES
Figure 1.1 Functions of tumor suppressor genes and their role in tumorigenesis 2
Figure 1.2 Mechanisms of loss of wild type allele 4
Figure 1.4.1 The chromosomal locations of chromosome 17 markers 13 Figure 1.5.1 The chromosomal locations of chromosome 13 markers 16 Figure 1.7.1 The histological appearance of normal testis 19 Figure 1.7.3.1 The histological appearance of embryonal carcinoma 23 Figure 1.7.3.2 The histological appearance of seminoma 24
Figure 1.7.3.3 The histogenesis of testis tumors 26
Figure 3.1.1 DNA samples isolated from Peripheral Blood 53 Figure 3.1.2 DNA samples isolated from Paraffin Embedded Tissue (PET) 54 Figure 3.2.1 PCR products of D17S855 and DI7S856 markers 56 Figure 3 .2.2 PCR products of normal and tumor DNA samples 57 Figure 3.2.3 Autoradiography result of radioactively labelled PCR products 58 Figure 3 .4.1.1 The silver stained polyacrylamide gel oiD17S776 alleles 61 Figure 3 .4.1.2 Autoradiography result of radioactively labelled PCR products of
marker D7 75776 62
Figure 3.4.2.1 The silver stained polyacrylamide gel of D17S800 alleles 63 Figure 3.4.2.2 Autoradiography result of radioactively labelled PCR products
oimstxkQT D17S800 63
Figure 3.4.3.1 The silver stained polyacrylamide gel of D17S855 alleles 64 Figure 3.4.3.2 Autoradiography result of radioactively labelled PCR products
of marker DI7S855 65
Figure 3 .4.4.1 LOH in TEC 93 by Mutation Detection Enhancement (MDE) gel 66 Figure 3.4.4.2 LOH in TEC 99 by non-denaturing polyacrylamide gel
Figure 3 .4.5 Autoradiography result of radioactively labelled PCR products TEC 96 and TEC 97 of marker D13S260
67
68
Figure 3.4.6.1 Autoradiography result of TEC 98 PCR products of marker
D13S267 69
Figure 3.4.6.2 Autoradiography result of radioactively labelled PCR products
o f marker DJ3S267 70
Figure 3.4.7 Autoradiography result of radioactively labelled PCR products
of marker D13S289 71
Figure 3.4.8 The silver stained polyacrylamide gel of PTEN alleles 72
LIST OF TABLES Table 1.3.1 Tablel.3.2 Table 1.3.3 Table 1.3.4 Table 1.8 Table 2.3
List of polymorphie markers used in LOH study of testis cancer 7 Alleles and allele frequencies in D 17S800 and D 17S855 markers 7 Alleles and allele frequencies in D 17S856 and D 13 S260 markers 8 Alleles and allele frequencies in D13S267 and D13S289 markers 8 The results of LOH studies in several cancers
Patient Information
Table 3.4.1 Results of LOH study for the marker/)77Л'776 Table 3.4.2 Results of LOH study for the marker DI7S800 Table 3.4.3 Results of LOH study for the marker D17S855 Table 3.4.4 Results of LOH study for the marker DI7S856 Table 3.4.5 Results of LOH study for the marker DJ3S260 Table 3.4.6 Results of LOH study for the marker DI3S267 Table 3.4.7 Results of LOH study for the marker DJ3S289 Table 3.4.8 Results of LOH study for the marker PTEN
31 42 Table 2.4.7.2 Oligonucleotides synthesized and their optimal PCR conditions 49 73 74 75 76 77 78 79 80 Table 3.4.9 Results of LOH study for the genes BRCA\,BRCA2 and PTEN 81
ABBREVIATIONS
APC Adenomatous polyposis
APS Ammonium persulphate
AFP Alpha fetoprotein
a-P a-phosphate radioactive labelled nucleotide
BRCAl Breast-Ovarian Cancer Susceptibility Gene 1
Brcal Mouse homolog of BRCA1
BRCAl Breast Cancer Susceptibility Gene 2
Brcal Mouse homolog of BRCAl
bp basepair
T degrees celcius
Ci Curie
CIS Carcinoma In Situ
CR Complete Response
cM CentiMorgan
ddHjO double distilled water
dATP deoxyadenosinetriphosphate
dCTP deoxycytosinetriphosphate
dGTP deoxyguanosinetriphosphate
dTTP deoxythymidinetriphosphate
DNA Deoxyribonucleicacid
DCC Deleted in Colon Cancer
dNTP deoxyribonucleosidetriphosphate
EC embryonal carcinoma
EDTA ethyl enediaminetetra-acetic acid
EX Not alive
EtOH Ethylalcohol
g gram
hCGT Human chorionic gonadotropin
kb kilobase
kDA kilodalton
LOH Loss of Heterozygosity
LH Luteinizing Hormone
LDH Lactate dehydrogenase
mRNA messenger ribonucleicacid
MA.TC Mature Teratocarcinoma
mM milimolar
ml mililiter
MgCl2 magnesium chloride
MCC Mutated in Colon Cancer
MMACA Mutated in Multiple Advanced Cancers 1
^iM micromolar
microliter
N Normal
OD260 optic density at 260 nanometer
OD280 Optic density at 280 nanometer
PBS Phosphate Buffer Saline
PIC Polymorphism Information Content
PTEN Phosphate and Tensin Homolog
PCR Polymerase Chain Reaction
PET Paraffin Embedded Tissue
pH Negative concentration of hydrogen ions
pmol picomol
RFLP Restriction Fragment Length Polymorphism
RNA Ribonucleicacid
RB {Rb) Retinoblastoma
rpm revolution per minute
SSCP Single Stranded Conformational Polymorphism
SE Seminoma
SDS Sodiumdodacylsulphate
T Tumor
TC T eratocarcinoma
TBE Tris-boric acid EDTA Buffer
U Unit
V Volt
VNTR Variable number of tandem repeat
v/v volume by volume
w/v weight by volume
w/w weight by weight
CHAPTER 1. INTRODUCTION
1.1 Tumor Suppressor Genes
Today it is known that at least two classes of genes are involved directly or indirectly in the regulation of cell growth and differentiation. Acquired or inherited alterations of these genes are crucial in the initiation and progression of human malignancies. The first group of these genes stimulates cell growth in a positive manner and is known as proto-oncogenes. The second group of these genes is tumor suppressor genes. The characteristic of tumor suppressor genes is their capability to inhibit uncontrolled growth and proliferation of cells. Cells therefore become malignant in absence or inactivation of their products.
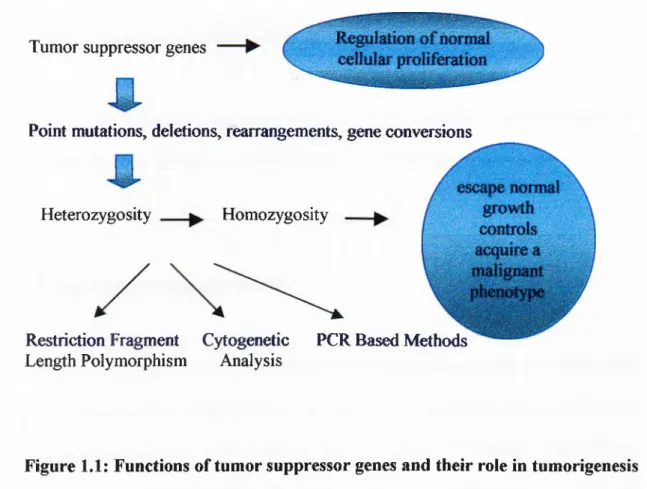
Tumor suppressor genes often show association with the loss of one chromosome or a part of a chromosome which results in the conversion of a heterozygote genotype to a homozygote genotype through elimination of one allele of a tumor suppressor gene or surrounding marker. The function of tumor suppressor genes and their alterations that lead to tumorigenesis is summarized in Figure 1.1
Tumor suppressor genes
Point mutations, deletions, rearrangements, gene conversions
Heterozygosity Homozygosity
Restriction Fragment Cytogenetic PCR Based Methods Length Polymorphism Analysis
Figure 1.1: Functions of tumor suppressor genes and their role in tumorigenesis
The existence of tumour suppressor genes is revealed by malignant-nonmalignant cell fiision studies. The hybrids formed by this way did not show the malignant cell phenotype at first but after the loss of some specific chromosomes in the hybrid the malignant phenotype reappeared. Another important characteristic of several tumour suppressor genes is the loss of normal alleles, which is termed loss of heterozygosity (LOH) (Strohmeyer and Slamon, 1994).
The other property of tumor suppressor genes is their requirement of two separate mutational events in order to cause tumor development. This hypothesis is known as the two hit hypothesis. One of the mutational events may occur in the germ line and the second may then occur sporadically or both these mutational events may occur sporadically and cause tumor progression. It is more likely for a tumor to follow a
sporadic mutation in a cell that already contains an inherited mutation rather than two somatic independent mutations occurring in a single cell lineage.
The two hit hypothesis has been revealed by the studies of retinoblastoma and extended to other tumors to explain the nature of tumor suppressor genes.
1.2 Loss of Heterozygosity (LOH)
LOH is a key pointer for the existence of tumor suppressor genes. In studies where DNA polymorphisms close to the RB-\ locus in both hereditary and non-hereditaiy tumors were analyzed, it was revealed that a significant difference exists between normal cells and tumor cells. The normal cells were heterozygous at many loci whereas the tumors were homorozygous at the same loci. The reason for this finding was that tumor DNA contained alleles from only one of the two homolog chromosomes of interest (Goodrich and Lee, 1993).
The mechanisms that lead to LOH were shown by retinoblastoma studies. The loss of a whole chromosome, loss of a chromosome followed by the reduplication that results in the generation of three copies of the chromosome, deletion of the wild type allele or point mutations are indicated as the possible mechanisms that result in the conversion of heterozygosity to homozygosity. The mechanisms that lead to the conversion of heterozygosity to homozygosity are summarized in Figure 1.2.
Marker A 1 Rb Marker B 1
Loss o f a whole Loss o f a chromosome D eletion o f the Point mutation o f the chromosome follow ed by reduplication w ild type allele w ild type allele
Samples
N T N T N T N T N T N T N T N T
A B A B A B
Alleles
Markers
DNA sequence variants play important roles in several aspects of genetic investigation such as evolutionary and population structure studies, forensic and the analysis and the diagnosis of genetic diseases. DNA sequence variants which are commonly known as DNA polymorphisms result from mutations and may or may not have functional consequences.
1.3 Polymorphism and Polymorphic Markers
Molecular polymorphism studies were restricted to the field of immunogenetics until Smithies developed the starch gel electrophoresis in 1955. The first DNA polymorphisms observed was restriction fragment length polymorphism (RFLP) on Southern blots of genomic DNA. This kind of polymorphism is based on the restriction fragment size due to the cleavage or noncleavage of the DNA at particular sites caused by single nucleotide polymorphisms. In 1985 Jeffreys defined another class of common RFLP in which the restriction fragment length variability is due to the variable number of tandem repeats (VNTR). These repeats are named minisatellites because of their similarity to the much larger satellite DNA repeats. The conventional class of RFLP has generally only two alleles while minisatellites show hundreds of alleles per locus. Weber identified another subclass of VNTR polymorphism in which the repeat unit consists of only two base pairs. These dinucleotide repeats are called microsatellites. The advantage of using microsatellites is that they can be easily scored by the polymerase chain reaction. Variability, number and relative case of scoring are the most important factors that make the microsatellites excellent markers for genetic studies. (Schafer and Hawkin., 1997).
The use of polymorphic markers is especially important in molecular genetic studies for several reasons. The co-inheritance of pairs of DNA markers with the genes that determine variable phenotypic effects is useful in determination of the genetic distances between them. The co-inheritance may also be used in the determination of the distance between the marker and the gene responsible for the variable phenotypic trait. The DNA probe for a marker may also be used in order to find its physical location.
The polymorphic markers are useful when they are informative. Informativeness is maximized if the marker has many alleles rather than two. The informativeness of a marker is measured by its polymorphism information content (PIC) value. PIC is a number between 0 and 1, the closer the value is to 1 the better is the marker. Above 0.7 is considered as a good value for the heterozygosity of a marker.
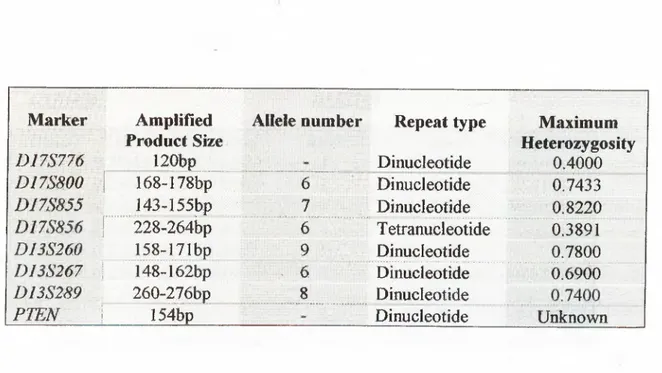
The polymorphic markers used in this study and their properties are summarized in Table 1.3.1.
Table 1.3.1: List of polymorphic markers used in LOH study of testis cancer.
Marker Amplified Allele number Repeat type Maximum
D17S776 ^ Product Size I20bp Dinueleotide Heterozygosity 0.4000 D I 7 m O i 168-178bp 6 Dinucleotide 0.7433 DI7S855 143-155bp 7 Dinucleotide 0.8220 0178856 1...228-264i3p 6 Tetranucleotide 0.3891 D13S260 158-I71bp 9 Dinucleotide 0.7800 D13S267 \ 148-162bp . 6 Dinucleotide 0.6900 DI3S289 260-276bp ....8... . Dinucleotide
PTEN \ 15 ¥ p ''V- Dinucleotide Unknown
The alleles and allele frequencies of the markers are as listed in Tables 1.3.2, 1.3.3 and 1.3.4.
Table 1.3.2: Alleles and allele frequencies in D17S800 and D17S855 markers
D17S800 D17S855 Allele 2. 3.. 4. Value i 0'l68klf 0 170kb Frequency 0.0500 0.1000 Allele i. ^ 2. . . ■■■ 3. 4. Value 0.153kb Frequency ■'" 0.0500 0.1900 0.172kb 0.174kb 0.4200 0.0700 O.lSlkb 0.149kb 0.1800 0.1500 5. 0.176kb 0.2300 5. 0.147kb 0.1200 6. 0.178kb 0.1000 6. 0T45kb 0.2600 7. 0.143kb 0.0500
Table 1.3.3: Alleles and allele frequencies in D17S856 and D13S260 markers
D17S856 D13S260
Allele Value Frequency Allele Value Frequency
1. "0.264kb 0.0100 ir'·.· 0 .165kb 0.1071 - l . r 0,260kb 0.7700 2. 0.163 kb 0,4107 '‘l'2 5 6 k b ’o.03bo 3 . ' O .nikb 0.1071 4. 0.240kb 0.0500 4. 0.167kb 0.0536 5. 0.236kb 0.1200 O.lblkb 0.1250 6. 0.228kb 0.0100 6. 0.159kb 0.0357 7. 0 169kb 0.0893 8. 0.l58kb 0.0357 9. 0.173kb
Table 1.3.4: Alleles and allele frequencies in D13S267 and DI3S289 markers
DI3S267 D13S289
Allele Value Frequency Allele Value Frequency
1. 0.154kb 0.1731 i . 0.260kb 0.4464
2. O.I48kb 0,4423 0.264kb 0.1964
3. b'iOOkb "”0'2885-""" ... " o;'276kb " ■..o;o536'··''^"'..
4. 0.156kb 0.0385 4. 0.274kb 0,0536
5. 0.150kb 0.0385 5. 0.272kb 0.1071
6. 0.162kb 0.0192 6. 0.262kb 0.0714
7. 0".268kb 0 0179
1.4 Breast-ovarian Cancer Susceptibility Gene {BRCAl)
The tumor suppressor gene BRCAl is responsible for a significant proportion of inherited breast and ovarian cancers (Lu et al., 1996). It is a large gene that spreads over approximately 100 kb of genomic DNA and is localized to human chromosome 17q21.3. It contains 24 exons, 22 of which is responsible for the expression of an mRNA in abundant levels in variable tissues such as breast, ovarian, testis and thymus. The individuals that have one copy o f BRCAl inactivated in their germ lines are predisposed to developing breast, ovarian and other malignancies (Scully et ai, 1997, Feunteun and Gilbert, 1996).
BRCA1 encodes a protein of 1863 aminoacids, which carries a zinc finger domain in
its amino terminal region (Miki et al., 1994). Today it is known that the product of
BRCA 1 is required for early embryonic proliferation and development. Because of its
ability to interact with Rad 51, which is a major component in double strand break repair and homologous recombination, it is thought that BRCAl plays an important role in the maintenance of genomic integrity (Scully et al., 1997).
BRCA 1 is expressed in normal breast epithelial cells and its product is intact in these
tissues. In normal cells BRCAl is localized to nuclei. BRCAl is detected in the cytoplasm o f almost all breast and ovarian cancer cells and is also localized to the cytoplasm in normal and tumor tissues other than breast. The expression of BRCA 1 in other tumor tissues like cervix, bladder, colon has also been shown, and the expression of BRCA 1 in these tissues is more aberrant than that in breast cancer tissues (Chen et al., 1995). The expression of BRCAl has been shown to be five to
fifteen-folds lower in invasive cancer cells than in normal breast tissue. In adults
BRCAl is expressed highly in the thymus and testes (Marquis e/ al., 1995) and
aberrantly in the breast, ovary, uterus, spleen and liver (Wilson ei a l, 1997).
In order to find the biological functions oiBRC Al, mutant mouse models were used. In a study where the fifth and sixth exons o f BRCA1 gene were deleted in mouse, it was revealed that this gene plays a crucial role in the control of the proliferative process that occurs in the early embryonic development (Hakem et al., 1996). A partial deletion including aminoacids 300-361 of mouse Brcal exon 11 was introduced into the genome of the embryonic stem cell. In the case of heterozygosity, no effect was observed. However the introduction of the mutation to both alleles leads to severe retardation and death of the mouse in early developmental stage. This study supported that BRCAl plays an important role in tissue proliferation and differentiation (Liu et al., 1996). Mutant mouse models were also used in order to analyze the histological alterations caused by mutations. Wild tjq)e and mutant mice were obviously distinguishable; the mutant mouse characteristically had a smaller, poorly organized abnormal phenotype. In contrast, the wild type embryos exhibited a well-organized ectoderm and endoderm. The classification of abnormal phenotype was done by dividing it into two distinct groups, one of them less severe than the other one. The less severe embryos showed epiblast, primitive streak was not detectable, and the parietal and visceral endoderms were very thin. In addition the extraembryonic region was poorly organized. The severe class did not appear to progress significantly beyond 5.5**^ embryonic day (Hakem et al., 1996).
LOH in a tumor is accepted as an evidence for the location of tumor suppressor genes. Through a study in which the deletions of chromosome 17 were assessed in order to measure LOH it was shown that BRCA1 was involved in sporadic breast carcinomas. A common region on chromosome 17q of approximately 120 kb between two loci within the BRCA 1 was identified to be frequently deleted. By using 17 polymorphic markers it was revealed that BRCAl is involved in sporadic breast carcinomas. THRAl, D17S776, D17S855 and D17S856 markers were 4 out of the 17 markers used in order to find the LOH status of BRCA 1 in sporadic breast cancers. The percentage of the informative tumors that were deleted by LOH for the markers
THRAl, D17S776, D17S855 and D17S856 was 27%, 30%, 27% and 19%
respectively. It was concluded that the observed LOH affecting the wild type, chromosome in tumors from affected breast/ovarían cancer patients was consistent with the hypothesis that BRCA 1 is a tumor suppressor gene (Cropp et al., 1994).
In another study in which the LOH in familial breast carcinomas was studied it was revealed that BRCAl on 17q and p53 on 17p might play important roles in the etiology of familial breast cancers. The LOH percentage found was 24% in the
BRCAl locus and 31% in thep53 locus. Chromosome 8q (33%) and 19q (27%) were
also implied as chromosomes in which the LOH rates were high in sporadic breast carcinomas (Lindblom etal., 1993).
Allele losses on chromosome 17 have also been studied in ovarian cancers. 16 epithelial ovarian carcinomas and 2 benign ovarian adenomas were studied for their
1.4.1 Loss of Heterozygosity on chromosome 17
LOH status by using four polymorphic probes. A high frequency of allele loss on 17q (77%) and lower frequency of allele loss on chromosome 17p (69%) were detected (Eccles et a/., 1990).
In the existence of both sporadic and familial epithelial ovarian tumors it was revealed that a common region of deletion appeared on chromosome 17q. By using a sample size of 32 sporadic and 8 familial epithelian ovarian tumors and 21 polymorphic loci it was suggested that LOH took place in a high proportion which indicated that a distinct tumor suppressor gene from BRCA1 localized on chromosome 17q may be involved in tumorigenesis. One of the polymorphic markers used in this study was D17S855 and the LOH rate for this marker was 73% (Godwin et ur/., 1994).
In order to find the involvement of BRCA 1 in prostate cancer, the LOH status was measured in 23 prostate cancer patients by using PCR based methods. Five highly polymorphic markers D17S855, D17S856, D17S250, D17S579 and DI7S588 were used. The LOH percentage found was 44% in DJ7S855, 40% in DI7S856, 10% in
D17S250, 10% in DI7S579 and 15% in D17S588. According to these data it was
concluded that BRCA 1 might have an important role in the pathogenesis of prostate cancer. (Gao etal., 1995).
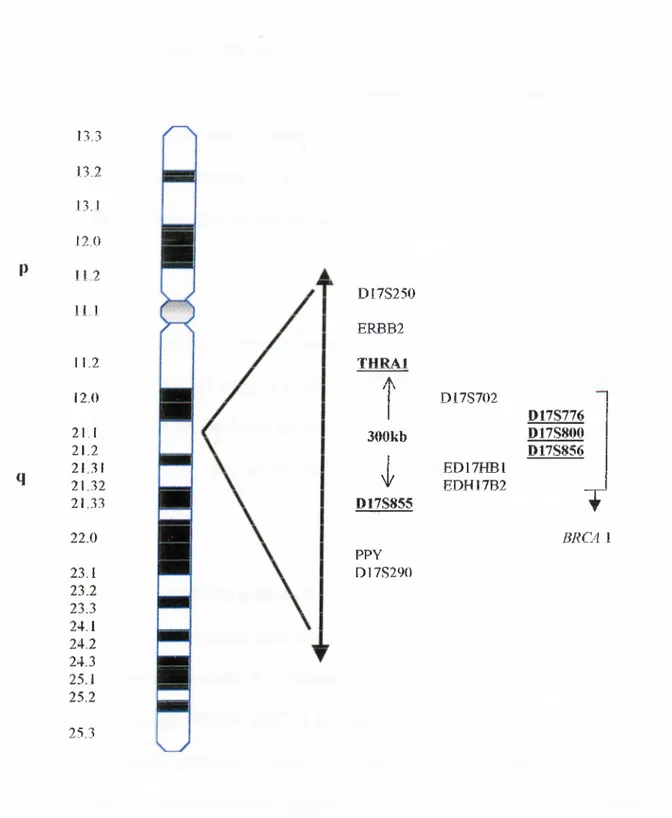
Fig. 1.4.1 shows the chromosomal location of markers used in LOH studies to determine the presence of the BRCA1 gene.
q 13.3 13.2 13.1 12.0 112 11 1 11.2 12.0 21.1 21.2 2131 21.32 21.33 22.0 23.1 23.2 23.3 24.1 24.2 24.3 25.1 25.2 25.3 D17S250 ERJBB2 THRAl A 300kb I D17S855 PPY D I7S290 D17S702 ED17HB1 EDH17B2 D17S776 D17S800 D17S856 T B R CA 1
Figure 1.4.1: The chromosomal locations of chromosome 17 markers
i. 5 Breast Cancer Susceptibility Gene 2 (BRCA2)
Another gene thought to be involved in breast cancer was identified and named as
BRCA2. The difference between BRCAl and BRCA2 is that germ line mutations in
BRCA2 predispose male carriers to an increased risk of breast cancer and female
carriers to an increased risk of ovarian cancer (Rajan et a l, 1996). Early onset female breast cancer cases, increased risks of male breast cancers and also ovarian, prostate and pancreatic breast cancers are thought to be associated with BRCA2 (Gayther et
a l, 1997).
BRCA2 is composed of 10248 nucleotides encoded by 27 exons. The first exon is a
noncoding exon. BRCA2 encodes a protein of 3418 aminoacids, 383 kDA. (Connor
et a l, 1997). Most of the exons are relatively small but exons 11 and 12 are very
large and account for 60% of the entire coding region. BRCA2 is localized on chromosome 13q 12-13.
It has been shown that the pattern of expression in BRCA2 is very similar to the pattern of BRCAl in multiple fetal and adult tissues and that BRCA2 is expressed highly in proliferating cells. It is therefore thought that similar pathways as in
BRCA1 may regulate BRCA2. BRCA2 is expressed in cellular compartments during
fetal development. Detectable levels of expression in BRCA2 was observed in the spleen, small intestine and placenta. High levels of expression in testis and moderate levels in the thymus and ovary were observable (Rajan et al, 1997).
In order to investigate the function of BRCA2 and its role in predisposing to breast and other cancers, targeted mutations were introduced to BRCA2 homologs in mice. In Brcct2 (as in Brcal), the inactivation of both alleles resulted in developmental retardation and disorganization which lead to the death of mice in early embryological development. The onset of phenotypic abnormalities in Brca2 was earlier than that in Brcal. Although the phenotypic features and time of death was highly variable in Brcal null homozygotes, they were much more uniform in Brca2 homozygotes (Ludwig et al., 1997).
Developmental expression of BRCA2 in adult tissues and its colocalization with
BRCA1 were investigated by in situ hybridization studies. By using mouse models it
was shown that Brca2 mRNA expression in the breast was restricted to the epithelium and it was found to be highest in proliferating cellular compartments, particularly those undergoing differentiation including the testis, thymus, prostate, spleen and liver (Rajan et al., 1997).
1.5.1 LOH on chromosome 13
The evidence that BRCA2 is a tumor suppressor gene came from LOH studies that found 30-40% LOH in sporadic breast cancers and 50-60% LOH in sporadic ovarian cancers on chromosome 13ql2-13 (Stratton, 1996). Another study in which 200 breast tumors were tested for LOH in order to find the involvement of
BRCA2 in sporadic breast cancer by using 11 highly polymorphic markers such
as DJ3S260, D13S267 and D13S289 determined that 25-30% of all informative
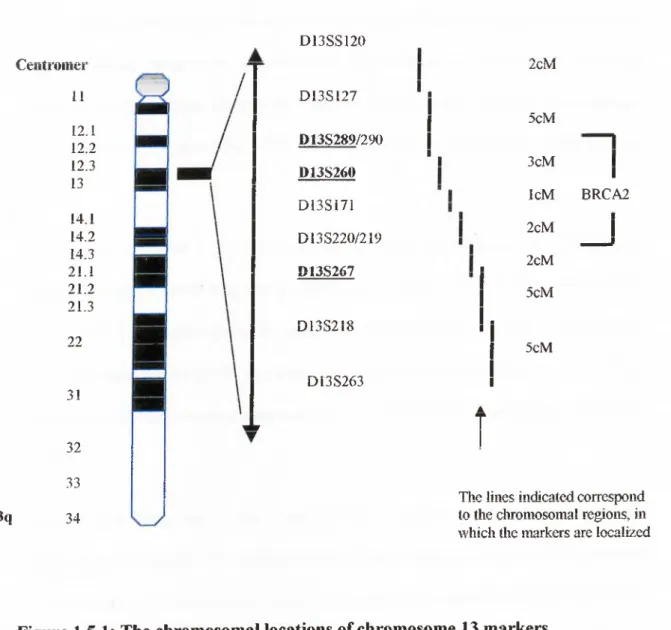
cases showed LOH (Cleton-Jansen et al., 1995). BRCA2 was localized to a 6 centiMorgan interval on chromosome 13ql2-13 by using the same polymorphic markers (Wooster et al., 1995). The localization of these markers on chromosome 13 is shown in Figure 1.5.1. (Ford and Easton, 1995).
13q Ceiitroiiier 11 12.1 12.2 12.3 13 14.1 14.2 14.3 21.1 21.2 21.3 22 3! 32 33 34 D 13SS120 D 13SI27 D13S289/290 D13S260 D 13Si71 D13S220/219 D13S267 D I3 S 2 18 D13S263 i 2cM 5cM n j 3cM IcM BRCA2 2cM 2cM 5cM 5cM
The lines indicated correspond to the chromosomal regions, in which the markers are localized
Figure 1.5.1: The chromosomal locations of chromosome 13 markers
The discovery of genes involved in tumorigenesis is especially important in developing therapeutic strategies for solid tumors. Gliomas are neoplasms that account for the vast majority of brain tumors and it was thought that studies of allelic loss in gliomas could be important for localizing and cloning the gene which may be related with its progression. It was found that deletions on chromosome 10 were among the most frequent genetic alterations in glioblastomas. LOH on chromosome 10 was found to be associated with the progression of glioblastomas (Maier et al, 1997).
Through the study of LOH at chromosome 10q23 it was found that 75% of all informative cases show LOH in glioblastomas and 60% of all informative cases show LOH in advanced prostate cancers. In another study in which the Cowden locus was assessed for LOH in an interval of 6cM, LOH was observed in 26% of informative follicular thyroid adenomas and 11% in Hurthle cell adenomas (Marsh et
ai.1997).
According to these data it was thought that a tumor suppressor gene might be localized in this region. The réintroduction of the deleted part to nude mice resulted in suppression of tumorigenicity which supported the suggestion of existence of a putative tumor suppressor gene in this region. Finally a candidate tumor suppressor gene identified and named as phosphatase and tensin homologue was found to be deleted from chromosome 10 (PTEN) or mutated in multiple advanced cancers
(MMACl). The germ line mutations of PTEN in the three related, inheritable
neoplastic disorders Cowden disease, Lhermitte-Duclos disease and
Bannayan-1.6 Phosphate and Tensin Homolog (PTEN)
Zonana syndrome supported the suggestion that PTEN may be a putative tumor suppressor gene.
PTEN shares homology with the family of protein tyrokinases as well as with the
cytoskeletal protein tensia PTEN is classified within the family of dual-specificity protein phosphatases that phosphorylate serine, threonine and tyrosine residues (Myers et a l, 1997). The family of enzymes, which PTEN is included in, is characterized by the presence of a catalytic motif which is located within a conserved secondary structure consisting of seven a-helices and ten 3-sheets. PTEN exhibits substrate specificity, and prefers extremely acidic substrates.
Many point mutations in PrEiV result in neoplastic disorders. It is thought that this is due to the disruption of enzyme activity of PTEN Germ line mutations in PTEN give rise to three related distinctive disorders. It was found that PTEN was also mutated in advanced prostate cancers and one half of endometrial cancers. Disruptions of PTEN in breast cancer and gynecological cancers were found to be rare (Myers et al.,
1997).
1.7 Testis Cancer
It is thought that the development of germ cell cancer is associated with two major factors, intrauterine prenatal effects, and postpubertal environmental or infectious effects in genetically susceptible individuals. Higher circulating in utero estrogen levels were associated with an increased testis cancer risk. Through segregation
studies it was confirmed that familial testis cancer was caused by a relatively high- frequency recessive gene (Oliver, 1998).
Testis cancer develops in young and middle aged men. It is most common in men between 15-34 years of age. The disease is lethal for 20-30% of the young patients (Bartkova et a l, 1991, Parker 1997, Moul 1997, CancerNet: National Cancer Institute). Most testis cancer cases occur sporadically and the lifetime prevalence of testis cancer in men is 4.9 per 100 000 (Peng et al., 1993). The incidence of testis cancer varies from one population to another and is higher in industrialized countries (Vistisen et al., 1997). It has increased two-fold in North and West Europe during the past 30 years. (Strohmeyer and Slamon., 1997). The worldwide incidence has also doubled in the last 40 years. The incidence of testis cancer presents variation according to geographic area. Scandinavia has the highest, while Asia and Africa have the lowest incidence of testis cancer. The incidence is intermediate in the United States and Germany (Bosl et al, 1997).
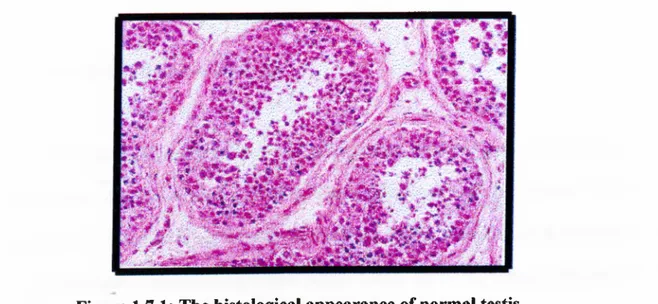
Histological appearance of a normal testis is shown in Figure 1.7.1
Figure 1.7.1: The histological appearance of normal testis.
This is the microscopic appearance o f normal testis. The seminiferous tubules have numereous germ cells. Sertoli cells are incospicuous. Small, dark, oblong spermatozoa are seen in he center o f the tubules.
Testis cancer that is highly treatable and curable is divided into two broad groups for treatment planning as seminomas where the cure rate exceeds 80% and nonseminomas. Nonseminomas are subdivided into choriocarcinomas, embryonal carcinomas, yolk sac carcinomas and mixed tumors (Strohmeyer et al., 1997). Choriocarcinoma contains the highest and teratoma the lowest risk for metastasis (CancerNet: National Cancer Institute).
The serum markers play an important role in the indication of diagnosis and follow up of testis cancer. Alpha fetoprotein (APP), human chorionic gonadotropin (hCGT), luteinizing hormone (LH) and lactate dehydrogenase (LDH) are the most frequently used serum markers to detect tumors too small to be detected by physical examination. Although very high levels of serum markers indicate a worse prognosis, absence of serum markers does not mean the absence of tumor (CancerNet: National Cancer Institute).
1.7,1 Germ Cell Tumor of Testis
The term germ cell tumor of testis indicates that the origin of tumors is primordial germ cells (Bosl and Motzer., 1997). Germ cell tumors of men account for a biologically complex tumor system (Murty et al., 1994), including the histogenesis and relationship of various histological types of testis germ cell tumors (Bartkova et
al., 1991). It is thought that all histological variants of testis germ cell tumors except
spermatocytic seminoma are derived from the same precursor called carcinoma in
situ (CIS) (Jorgensen et al., 1990, Kuczyk et ai, 1996). CIS of the testis is a preinvasive lesion that with time progresses into invasive germ cell tumor. The conversion of CIS into an invasive germ cell tumor takes approximately five years (Bosl and Motzer, 1997). It is thought that CIS cells are malignant cells derived from gonocytes during embryonic development. The reason of this suggestion was the morphological and immunohistochemical similarities between CIS cells and primordial germ cells, which could not be observed in comparison with spermatogonia. The observation of CIS in almost all seminiferous tubules adjacent to seminoma and nonseminoma testis tumors supports the association between CIS and germ cell tumors (Jorgensen et al., 1990).
1.7.2 Causes of Testis Cancer
The most favourite hypothesis that explains the link between the declining sperm counts and increase of testis cancer is the concept that estrogen-mimicking chemicals damage the fetal germ cells. It is recognized that estrogen-mimicking chemicals act transplacentally to effect the germ cells in utero. However, it is thought that other mechanisms also contribute to the progress of testis cancer. Studying the comparative risks of father-to-son and sibling-to-sibling occurrence of testis cancer reveals the importance of genetics in comparison to intrauterine environmental influences. Brothers but not father and sons might share an in utero factor such as specific maternal hormone levels (Oliver, 1997). Patients with a history of cryptorchidism, contralateral testes, gonadal dysgenesis, infertility and undescended gonads are under higher risk of progression to testis cancer. (Jorgensen et al., 1990,
Parker, 1997). Molecular genetics based studies have concluded that loss of tumor suppressor genes might be associated with testis cancer.
1.7.3 Cellular Classification and Staging in Testis Cancer
Today it is known that testis tumors arise from two origins, germ cells that account for 95% of testis neoplasms and nongerminal sex cord stromal cells.
Although most germinal tumors are aggressive, nongerminal tumors are usually benign. The concept that testis germ cell tumors arise from primordial germ cells is supported through studies in which the expression of H19 gene was investigated. This gene is known to have a well-defined expression during embryonal development. It was found that the level of expression of H19 was highly correlated with stages of maturation and differentiation in various testis tumors which supported a primordial germ cell origin of tumors (Prowse et ah, 1998).
Reflecting their origin in primordial germ cells and their remarkable ability to differentiate in vivo, testis tumors are histologically classified into two broad groups by the World Health Organization (Bosl and Motzer, 1997). Tumors showing single cell type are subdivided into seminomas, embryonal carcinomas, teratomas, choriocarcinomas and yolk sac carcinomas. Tumors showing more than one histological pattern are indicated as embryonal carcinoma and teratoma with or without seminoma, embryonal carcinoma and yolk sac carcinoma with or without seminoma, embryonal carcinoma and seminoma, yolk sac carcinoma and teratoma
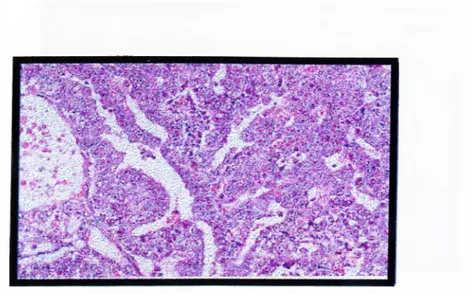
with or without seminoma and choriocarcinoma and any other elements. (CancerNet: National Cancer Institute). Figure 1.7.3.1 shows the histological appearance of embryonal carcinoma.
Figure 1.7.3.1: The histological appearance of embryonal carcinoma
This is the histological pattern o f embryonal carcinoma sheets. The blue cells are hying to form primitive tubules.
The most common type of germinal tumors is seminomas that account for 30% of all germinal tumors. These are divided into three subgroups, as typical, anaplastic and spermatocytic carcinomas. A typical seminoma is derived from the proliferation of primary germ cells and has a uniform property. Anaplastic seminomas show greater cellular and nuclear irregularity with more frequent giant tumor cells and many mitoses. Seminomas are most frequent in fourth decade of life. Seminomas may contain high mitotic rate (anaplasty), syncytiotrophoblastic giant cells and increased human chorionic gonadotropin (hCGTP) levels.
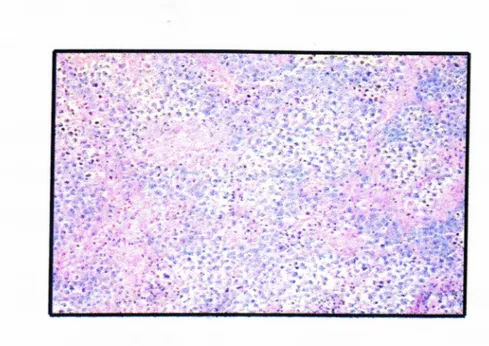
The histological appearance of seminoma is shown in Figure 1.7.3 .2
Figure 1.7.3.2: The histological appearance of seminoma
cells have an intervening stroma with clear infiltrates. The seminoma cells are large with vesicular nuclei, and pale watery cytoplasm.
Spermatocytic seminoma is a rare variant, which has no association with CIS. Its relation with other germ cell tumors is unknown. These tumors rarely metastasize and are found usually in elderly men.
Nonseminomatous germ cell tumors are usually found in the third decade of life. Embryonal carcinomas, teratomas, yolk sac carcinomas and choriocarcinomas are classified within this group.
The most undifferentiated cell type is embryonal carcinoma. It has totipotential
capacity to differentiate into the other nonseminomatous cell types. Embryonal carcinomas are more aggressive and lethal than seminomas. Embryonal carcinoma cells are capable of synthesizing elevated serum concentrations of hCGT and alpha fetoprotein.
Choriocarcinomas are made up of cytotrophoblasts and syncytiotrophoblasts. They are rarely pure. They with their association with metastatic diseases and high serum concentrations of hCGT are characteristic.
Yolk sac carcinoma is the most common testis tumor in infants and children. It is also known as endodermal sinus tumor and occurs frequently in combination with embryonal carcinoma in adults.
Teratomas contain somatic cell types of two or more germ-cell layers (ectoderm, mesoderm or endoderm). Mature teratomas contain a collection of differentiated cell types.
Immature teratomas are tumors with partial somatic differentiation elements where of the three germ cell layers are incompletely differentiated and not arranged in organoid fashion (Bosl and Motzer, 1997). The histogenesis of testis tumors is summarized in Figure 1.7.3.3.
\
Figure 1.7.3.3: The histogenesis of testis tumors
The preinvasive state in which testis cancer is limited to the testis, epididymis, or spermatic cord is known as stage I testis cancer. The spread to the retroperitoneal or para-aortic lymph nodes in the region of kidney besides testis is defined as stage II. This stage is further subdivided as stages IIA (nodes less than 2cm in maximal diameter), IIB (nodes between 2 and 5cm in diameter) and IIC (nodes greater than 5 cm in diameter) Spread beyond the retroperioneal nodes is implied as stage III.
It is believed that all cases of CIS will progress sooner or later into a germ cell cancer. It is better to treat the disease at the CIS stage because treatment at the later cancer stages may include radiotherapy and/or chemotherapy, which have serious side effects. The surgical removal (orchiectomy) of the effected testis is proposed as the treatment of choice in cases of unilateral CIS if the other gonad has a potential for fertility. In the case of patients with testis tumor or CIS of the contralateral testis the treatment method of choice is localized irradiation (Jorgensen et al., 1990, CancerNet: National Cancer Institute). Chemotherapy is the method of treatment used to prevent the dissemination of germ cell tumors. Chemoterapy results in a complete response (CR) in 70%-80% of patients whereas 20%-30% still dies from this disease (Motzer et al., 1990). The risk for relapses in stage I seminomas accounts for 4%, for stage IIA and stage IIB 10%. Chemotherapy cures more than 90% of patients who have a relapse after radiation therapy. (Bosl and Motzer, 1997)
1.7.4 Treatment of Testis Cancer
1.7.5 Unanswered questions in testis cancer
There are still many problems that seem unsolved. The reason why two age peaks exist in testis cancer, and how and why undescended testes, gonadal dysgenesis, androgen insensitivity increase the risk of testis cancer is not known. It is also not answered whether chemotherapy and radiotherapy are the right treatment strategies in terms of fertility (Ginsburg, 1997). The genetic basis of testis cancer has not been enlightened enough to answer all the questions.
Through cytological studies on testis cancer, t was revealed that isochromosome 12 i (12p) presence is the most common and frequent chromosomal abnormality in testis cancer cases. This finding is present in up to 100% of all germ cell tissues studied. It is thought that isochromosome 12 appearance is an early event during oncogenesis. Other alterations such as trisomies, duplications, deletions and other rearrangements for chromosomes 1, 11, X and Y were also shown by cytological studies. It is revealed that several proto-oncogenes and growth factors are localized to the chromosomes, which are frequently altered in germ cell tumors. Using immunohistochemistry and flow cytometry, it was found that low levels of c-myc protein product p62 are observable in normal testicular tissue whereas high levels are present in seminoma tumor tissues. It was shown that the expression of p62 is increased due to the increase in cell differentiation in nonseminomas and the germ tumor cell line Tera-2. The incidence of ras mutations was found to be low (Strohmeyer et al., 1994). It has been also shown that N-ras and Ki-ras mutations do exist in testis tumors and the expression of c-myc and c-kit oncogenes are high in germ cell tumors of testis (Shuin et al., 1993).
It was revealed that frequent allelic losses take place in chromosomes 2p, 3p, 3q, 5p, 9p, 9q, lOq, lip , 12q, 13q, 17p, 17q, 18p, 18q in testis tumors (Murty eta/., 1994/
APC, MCC, DCC, TP53, RB and WT-\ tumor suppresor genes were also investigated
for their LOH status in a high number of tumors and tumor cell lines of testis by using PCR-based methods. 28% LOH was observed at APC, 30% at RB, 23% at
1.8 Molecular Biology and Genetics of Testis Cancer
MCC, 27% at WT-\ and 22% at TP53 (Peng et al., 1995). p53 is a tumor suppressor
gene that is most frequently deleted in a variety of human tumors. Although the differential expression oîp53 in testis cancer was shown, mutations oîp53 in germ cell tumors of testis are not reported (Chou et al., 1997).
In order to find the role of p53 in testis cancer, p53 mutations in both sporadic and familial testis cancer samples were assessed. Mutation detection was performed by using two efficient screening methods, constant denaturing gel electrophoresis and single stranded conformational polymorphism. No mutation was found in p53. It is thought that other tumor suppressor genes instead of p53 may play a role in the development of testis cancer and that p53 might mediate toxin damage to sperm count (Peng et al, 1993). In contrast to most solid cancers, p53 was found to be unmutated in testis cancers. However, Kuczyk et a l was able to show mutational band shifting at the p53 gene locus in 12 out if 18 (67%) samples by using a sensitive assay called RNA-single stranded conformational polymorphism assay (RNA-SSCP) (Kuczyk e ta l 1996. Oliver, 1997).
In 1994 Murty et al. reported that DCC gene was frequently deleted in male germ cell tumors. Using germ cell tumors and tumor cell lines of testis resulted in the study concluded that LOH at 18q21 was characteristic of seminomas as well as in all subsets of nonseminomas (Murty et al., 1994).
The number of families with multiple numbers of testis cancer cases is low and those, which are reported, contain only two affected members. In a study in which 35 families with two affected sibs were typed by using 220 microsatellite markers, six
regions were found as candidates for a testis cancer susceptibility gene. The physical location of these regions are lp36, 4pl3-14, 4cen-ql3, 5ql2-21, 14ql3-q24.3 and 18q21.1-q23 (Leahy eta/., 1995).
Some LOH studies performed in order to determine the LOH status in several cancers are given in Table 1.8.
Table 1.8: The results of LOH studies in several cancers
Gene Sample Size % LOH Reference
P53 22%
APC 44 28%
MCC Testis cancer 23% Peng eial., 1995
DCC 55%
WT-1 27%
RB 30%
23 44%
BRCAl Prostate D17S855 Gao et al., 1995
cancer 40%
D17S856
THRAl
130 27%
sporadic DJ7S776 Croppy/a/., 1994
BRCAl breast cancer 30%
D17S855 27% 78 BRCAl Familial 12-19% P53 breast 16-33% Lindblom et a i, 1993 carcinomas 20 THRA 1 Sporadic 79% BRCAl breast D17S250 carcinomas 50% DI7S579 Futreal et al., 1992 59% 50
BRCAl Sporadic 47-67% Poster et a i, 1996
ovarian Cancer
38 26%
PTEN Sporadic follicular Marsh et al., 1997
thyroid thyroid
Tumors adenomas
1.9 AIM AJVD STRATEGY
This project aims to determine the status of three candidate genes on chromosome 17
(BRCAl), 13 (BRCA2) and 10 (PTEN) for loss of heterozygosity in order to identify
potential tumor suppressor genes, which may be involved in testis tumors. We got 18 histological tumor variants of 10 testis patients. We wanted to analyse these 18 tumor with highly polymorphic dinucleotide and tetranucleotide repeat markers by using a PCR-based LOH assay.
The strategy we used was as follows;
♦ This study has been set up in collaboration with Hacettepe University Medical School, Department of Urology and Department of Pathology.
• The patients have been examined and operated at Department of Urology and their tumor samples were sent to pathology department for analysis. Nonseminoma IIC and IIIC patient groups were selected for molecular genetic analysis.
• The normal and tumor tissue sections of patient samples were fixed into paraffin blocks at pathology department. The sections of samples were cut and dissected under the microscope to separate normal and different variants of tumor tissues.
* These samples were send to Bilkent University, Department of Molecular Biology and Genetics for molecular analysis in PBS solution.
* The tissue samples were stored at -70°C until they were used. DNA was isolated from dissected tissue samples and used to investigate LOH status of different
genes. Peripheral blood DNA was also isolated and used to optimize the PCR conditions.
The PCR conditions for radioactive and normal PCR were optimized to obtain the PCR products of our interest.
The PCR products were run in nondenaturing polyacrylamide gels in order to separate the alleles.
Depending on the method used autoradiogram or silver staining was performed to observe the alleles and decide whether allele loss had occurred or not.
CHAPTER 2. MATERIALS AND METHODS
2.1 MATERIALS
2.1.1 Reagents
The reagents Tween 20, phenol, chloroform, isoamylalcohol, ethidiumbromide, boric acid, acetic acid, formaldehyde, sodium hydroxide, formaldehyde, bromophenol blue, xylene cyanol, glycerol, silver nitrate and DMSO were from Sigma Chemical Co. (St.Louis, U.S.A)
Tris-Cl and Tris-Base were from Stratagene (Heidelberg, Germany). EDTA and sodium hydroxide were from Carlo Erba (Rodano, France). Sodium acetate was from Merck (Darmstadt, Germany). Ethanol was from Delta Kim. San. (Istanbul, Turkey). Hexa Labe Labelling Kit was from MBI Fermentas Inc. (N.Y, U.S.A).
100 bp DNA ladder, H in fl digested 0x174 DNA and pUC mix marker were used as DNA molecular weight standards in this study. All these molecular weight markers were from MBI Fermentas Inc. (N.Y, U.S.A). Ultrapure deoxyribonucleotides were from Pharmacia (Vienna, Austria).
2.1,2 Nucleic Acids
2.1.3 Oligonucleotides
The oligonucleotides used in polymerase chain reaction were synthesized in the Beckmann Oligo lOOOM DNA synthesizer (Beckmann Instruments Inc. CA, U.S.A) at Bilkent University, Department of Molecular Biology and Genetics (Ankara, Turkey).
2.1.4 Enzymes
Rnase A was from Sigma Chemical Co. (St.Louis, U.S.A). Proteinase K was from Appligene-Oncor (U.S.A). Taq DNA Polymerase and Klenow fragment of E.coli DNA Polymerase I large fragment were purchased from MBI Fermentas Inc. (N.Y, U.S.A).
Agarose, acrylamide, bisaciylamide, N-N-N trimethylethylenediamine (TEMED), ammonium persulfate (APS) were obtained from Sigma Chemical Co. (St.Louis, U.S.A).
Horizontal electrophoresis apparatus was from Stratagene (Heidelberg, Germany). The power supply used was Power-PAC300 from Bio Rad Laboratories (CA, U.S.A). The vertical gel apparatuses used for polyacrylamide gel electrophoresis were Bio-Rad Proteon II xi Cell from Bio Rad Laboratories (CA, U.S.A) and EC 175 Adjustable Vertical Gel System from E.C Apparatus Co. (FL, U.S.A)
2.1.5 Electrophoresis Materials
2.1.6 Photography and Autoradiography
The UV transilluminator was from Herolab. The video graphic printer UP-890CE was from Sony Corporation (Japan). Polaroid film UP 110 HD was from Sony Corporation (Japan). The films used for autoradiography were from Kodak Corporation (U.S.A). Cassettes and intensifying screens were from Amersham International (England). Photographic fixer and developer were from Kodak Corporation (Japan).
2.1.7 Radioisotopes
a -^^P- dCTP (3000 Ci/mmol) and a-^^P- dATP (3000 Ci/mmol) were from Orbital Ltd.Sti. (Istanbul, Turkey).
2.2 SOLUTIONS
2.2.1 General Solutions
EDTA;
IxTris-boric acid-EDTA (TBE): Ethidiumbromide:
lx Gel loading buffer:
10% SDS Tris-Cl Proteinase K:
IM, pH 8.0
45mM Tris-borate, ImM EDTA 10 mg/ml in water (stock solution) 30 ng/ml (working solution)
0.25% bromophenol blue, 0,25% xylene cyanol, 50% glycerol, ImM EDTA 0. Ig/ml in water (stock solution) 0.5M, pH 8.0
20mg/ml proteinase K in water (stock solution) lOpl (lOmg/ml) proteinase K was used for each DNA isolation reaction.
2.2.2 Solutions for cold and radioactive polymerase chain reactions
dNTP mix (stock solution): lOOmM each of four different kinds of dNTP (dATP, dTTP, dCTP, dGTP) were mixed to a final concentration of 0.2mM
Radioactive PCR dNTP mix (stock solution):
dATP reduced dNTP mix (stock solution); 5mM dATP, lOOmM dTTP lOOmM dGTP, lOOmM dCTP
dCTP reduced dNTP mix (stock solution): lOOmM dATP, lOOmM dTTP lOOmM dGTP, 5mM dCTP
MgCl2 (stock solution): 25mM MgCli
lOx PCR Buffer: lOOmM Tris-Cl (pH 8.8)
500mM KCl. 0.8% Nonidet P40
2.2.3 Solutions for DNA Isolation from blood
20x SSC; 3M NaCl, 0.3M trisodium citrate, pH 7.0
TE buffer:
Extraction buffer:
lOmM Tris, pH 8.0, ImM EDTA, pH 8.0
lOmM Tris-Cl, pH 8.0 lOmMEDTA, pH 8.0 0.5% SDS Sodium acetate; 3M, pH 5.2 Phenol/chloroform/isoamylalchol: 25:24:1 (v/v/v) 38
2.2.4 Solutions for DNA Isolation from paraffin embedded tissue
Digestion buffer: 50mM Tris-CI, pH 8.0
ImM EDTA 1% Tween 20
2.2.5 Solutions for non-denaturing polyacrylamide gel electrophoresis
Polyacrylamide; 40% (w/v), Acrylamide/bisacrylamide, 19:1 (w/w), (stock solution)
500ml 40% stock solution preparation; 500mlx40% = 200g (w/v)
200x19/20 =190g Acrylamide was added into 200x1/20 =10g Bisacrylamide and dissolved in 500ml deionized water.
Ammonium persulfate: 10% APS in water
2.2.6 Solutions for silver staining
Developer solution; Fixative solution: Silver-nitrate: 1.5%NaOH 0.1% Formaldehyde 10% EtOH 0.5% Acetic acid 0.1% AgN03 39
2.2.7 Solutions for radioactive labelling
10 X Reaction buffer: 500mM Tris-Cl(pH 8.0)
dNTP mix: lOmM dATP, lOmM dTTP
lOmM dGTP, lOmM dCTP
Mix C: dNTP mix minus dCTP