Contents lists available atScienceDirect
Optical Switching and Networking
journal homepage:www.elsevier.com/locate/osnComparative analysis of power consumption in asynchronous
wavelength modular optical switching fabrics
N. Akar
a, V. Eramo
b, C. Raffaelli
c,∗aElectrical and Electronics Eng. Department, Bilkent University, Ankara, Turkey bD.I.E.T., University of Rome, ‘‘Sapienza’’, Rome, Italy
cD.E.I.S., University of Bologna, Bologna, Italy
a r t i c l e i n f o Article history:
Available online 2 April 2011
Keywords:
Optical packet switching Asynchronous switching Power consumption Wavelength converter Performance evaluation
a b s t r a c t
Next-generation optical routers will be designed to support the flexibility required by Future Internet services and, at the same time, to overcome the power consumption bottleneck which appears to limit throughput scalability in today routers. A model to evaluate average power consumption in asynchronous optical switching fabrics is here presented to compare these architectures with other synchronous and asynchronous solutions. The combination of wavelength modular switching fabrics with low spatial complexity and asynchronous operation is demonstrated to be the most power-efficient solution among those considered which employ wavelength converters, through presentation and discussion of a thorough set of numerical results.
© 2011 Elsevier B.V. All rights reserved.
1. Introduction
Optical networking is claimed to provide the candidate infrastructure to meet the emerging requirements in IT service scenarios and to overcome some of the bottlenecks of the current Internet infrastructure [1]. Bandwidth demand is expected to considerably increase in relation to the introduction of high speed access networks and the consequent provisioning of video-centric communication services and collaborative computation environments [2].
Core network evolution will be driven by solutions to increase flexibility and efficiency in the usage of the physical infrastructure by the adoption of virtualization concepts [3]. A key role will be played by network reconfiguration capability and its agility to meet even application paradigms. In this context, high capacity pro-grammable routers will be designed to support multi-ple network service granularities [4] while employing high performance switching matrices, possibly based on packet-oriented optical technologies.
∗Corresponding author. Tel.: +39 051 2093058; fax: +39 051 2093053.
E-mail address:[email protected](C. Raffaelli).
One of the today’s main bottlenecks with respect to the development of high speed dynamic networks is power consumption which is becoming one of the driving factors in the design of next-generation optical routers [1]. Power consumption of today’s large-scale routers are estimated in the range of tens of kWs per rack [2] and some saving is expected as a result of the employment of optical switching-based solutions. Recent studies have evaluated power consumption of optical packet switching architectures and the findings of these studies, within the modeling applied, are encouraging [5].
Synchronous and asynchronous packet-switched solu-tions have been compared [6] by outlining the influence of optical packet synchronizers on power consumption. The conclusion drawn in [6], as far as the optical packet switch architecture with shared wavelength converters is concerned, is in favor of an asynchronous approach which allows some saving in the dissipated power. A further investigation has been applied to simplified architectures which allows complexity reduction of the spatial switch-ing matrix with consequent power savswitch-ings, as evaluated in synchronous context, in the order of 20% [7].
In this paper, the combination of asynchronous opera-tion with low spatial complexity architecture is evaluated.
1573-4277/$ – see front matter©2011 Elsevier B.V. All rights reserved.
c
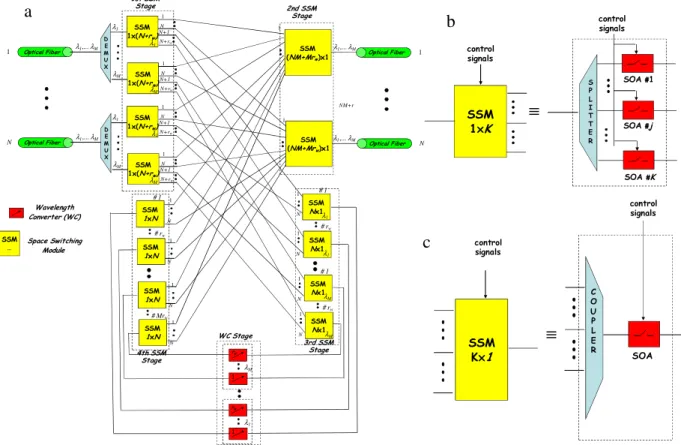
Fig. 1. Asynchronous Shared-Per-Wavelength Optical Packet Switch: (a) Overall architecture; (b) realization of 1×K SSM; (c) realization of K×1 SSM by means of splitters, couplers and SOAs.
The switch architecture considered is a shared-per-wavelength solution where shared-per-wavelength converters are shared among packets arriving at the switch on the same wavelength. This wavelength converter sharing architec-ture allows a modular organization of the switching fab-ric [7]. An analytical model based on a two-dimensional Markov chain is introduced to evaluate the related usage of components which contribute to power consumption in different subsystems of the architecture.
The paper is organized as follows. Section2describes the asynchronous shared-per-wavelength architecture (ASPW). Section3describes the model applied to evalu-ate average power consumption based on the power con-sumption in each subsystem of the asynchronous switch. Section4describes the new analysis introduced to evalu-ate the utilization of each subsystem for power consump-tion evaluaconsump-tion. In Secconsump-tion5, numerical results and sample switch design are presented and discussed. Conclusions are drawn in Section6.
2. Asynchronous Shared-Per-Wavelength Optical Packet Switching architecture
The Asynchronous Shared-Per-Wavelength (ASPW) Optical Packet Switch is shown inFig. 1. A synchronous version of this switch, the Synchronous Shared-Per-Wavelength (SSPW) Optical Packet Switch, was considered in [7] to evaluate power consumption. The switch oper-ation mode is here asynchronous [8] and therefore syn-chronizers are not needed, as opposed to [7]. In fact, in
asynchronous switching, packet lengths are typically vari-able and packet arrivals do not need to be aligned before switching operation is performed.
The ASPW switch consists of N Input/Output Fibers (IFs/OFs) each one carrying M wavelengths namely
λ
1, λ
2,
. . . , λ
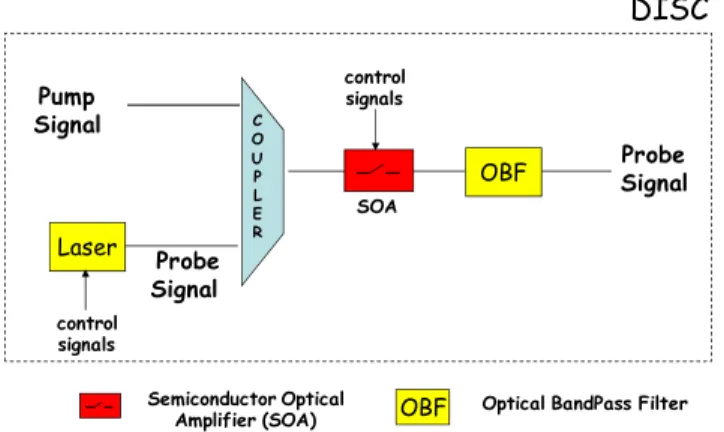
M. In the ASPW switch, contention resolution isper-formed in the wavelength domain by using wavelength converters (WCs). As a WC, we propose to use the Delayed Interference Signal Wavelength Converter (DISC) that was introduced in [9,10]. The block diagram of a DISC is il-lustrated inFig. 3 which employs an SOA (Semiconduc-tor Optical Amplifier) and an Optical Bandpass Filter (OBF) placed at the amplifier output. Moreover, it can be con-structed by using commercially available fiber-pigtailed components. This simple configuration allows photonic in-tegration whose power consumption has been evaluated in [9,10] when commercial SOAs are employed.
In ASPW, the N Input Wavelength Channels (IWCs) related to the same wavelength
λ
k(k=
1,
2, . . . ,
M) indifferent Input Fibers (IFs) share a common pool of rw WCs. In other words, a number rw of WCs is dedicated to the packets coming on the wavelength
λ
1, rw tothe packets coming on wavelength
λ
2 and so on, for atotal amount of Mrw WCs. An electronic control logic, on the basis of the routing information carried by the packet header, handles packet contentions and decides which packets need wavelength conversion. A packet not requiring wavelength conversion is directly routed towards the Output Fibers (OF). On the contrary, a packet
Fig. 2. Fiber-based synchronizer with SOA gates and OBF.∆is the delay introduced by the fiber delay line of the 1st stage.
Fig. 3. Realization of an all-optical wavelength converter by using a Delayed Interference Signal Wavelength Converter (DISC).
requiring wavelength conversion will be directed to the pool of rwWCs dedicated to the wavelength on which the packet is arriving. The selection of either an OF or a WC is realized by means of a 1
×
(
N+
rw)
Space Switching Module (SSM) of the 1st SSM stage. We report inFig. 1(b) an implementation of a 1×
K Space Switching Module(SSM) based on the use of a fast device like SOA. The SSM is realized by means of one splitter and K SOAs. An output of the SSM is selected by activating a particular SOA. This is accomplished by injecting into the SOA a bias current ib
greater than the transparency current [11]. With reference toFig. 1(b), PSSMin , PSSMout,j
(
j=
1, . . . ,
K)
and PSSMal denote the input, output and supply powers of the 1×
K SSM,respectively.
Each N
×
1 SSM of the 3rd SSM stage inFig. 1has the function to forward the packet selected by the control unit to a WC to be wavelength converted. The implementation of a K×
1 SSM is illustrated inFig. 1(c) which is realized by a coupler and an SOA whose main function is to recover the power loss introduced by the coupler. The converted packets are then sent to the OFs by means of a 1×
N SSMof the 4th SSM stage. Finally, the packets directed to any OF are collected by means of an
(
N+
rw)
M×
1 SSM of the 2nd SSM stage.The ASPW sharing strategy allows for a reduction in switching fabric complexity improving scalability. As a matter of fact, the 1st and the 3rd stage SSMs needed to reach the OFs and WCs have led to complexity reduction with respect to the corresponding stages in the SPN reference switch illustrated in Fig. 1 [6], where r denotes the total number of shared WCs employed in
the SPN architecture. In fact, in the 1st SSM stage of the SPW switch, rw is the number of WCs shared per wavelength. This reduction in switching fabric complexity leads to lower signal attenuation and, consequently, to lower SSM power consumption. In addition, in relation to the asynchronous operation, power consumption due to synchronizers is not present and this is expected to further reduce power consumption with respect to previously evaluated solutions.
The synchronous version of this architecture, namely the Synchronous SPW (SSPW) architecture, will be consid-ered for comparisons in numerical evaluations. Differently from the ASPW described, SSPW is equipped with synchro-nizers, which are located at the exits of the demultiplex-ers (Demux) at 1st SSM stage inputs. As a synchronizer, the feed-forward NSYN stage structure ofFig. 2is
consid-ered here which exhibits high operation speed, large tun-ing range, and the potential for integration within the large SOA-based switch [12,13]. It consists of one 1
×
2 splitter, one 2×
1 coupler, two SOAs, two OBFs and one Fiber Delay Line (FDL) in each stage.3. Evaluation of power consumption in ASPW optical packet switch
We are interested in comparing the power consump-tion in the switching fabric of the ASPW optical packet switch to other switches proposed in the literature [5–7]. For this reason, the proposed model to evaluate the power consumption will neglect the power consumption pro-duced by common components. In particular, we do not
scheduling operation and gate configuration completion, as discussed in [14]. Under this hypothesis, when 1
×
KSSM and K
×
1 SSM are active, their power consumption denoted by PSSM1×K and PSSMK×1, respectively, equal the supply power consumption PSOAal,Gof an SOA providing a gain G=
K [11], that is,
PSSM1×K
=
PSSMK×1=
PSOAal,G|
G=K.
(1)Finally, we assume that WCs consume power only in cases in which they have to be used. As a WC, the Delayed Interference Signal Wavelength Converters (DISC) proposed in [9,10] is used. Let PWC denote the power
consumption of a DISC-type WC.
The total power consumption PT
(
t)
in the OPS shown in Fig. 1is given at time t by the simple expression below:PT
(
t) =
4−
i=1 PSSM,i(
t) +
PW(
t)
(2) wherein•
PSSM,i(
t)
(i=
1, . . . ,
4) is the power consumption in ithSSM stage (i
=
1, . . . ,
4) at time instant t;•
PW(
t)
is the power consumption in WC stage atin-stant t.
In evaluating the various power consumption compo-nents appearing in(2), we introduce the following nota-tions defined at time t:
•
Na(
t)
denotes the number of forwarded packets;•
Nd(
t)
denotes the number of OFs in which at least one packet is directed;•
Nc(
t)
denotes the number of used WCs.To evaluate PT
(
t)
, we notice that at time t:•
there are as many active 1×
(
N+
rw)
SSMs in 1st SSM stage as the number Na(
t)
of packets forwarded;•
there are as many active(
NM+
Mrw) ×
1 SSMs in 2nd SSM stage as the number Nd(
t)
of OFs in which at leastone packet is directed;
•
the number of WCs used as well as the number of activeN
×
1 SSMs in 3rd SSM stage and the number of active 1×
N SSMs in the 4th SSM stage equal the number Nc(
t)
of used WCs.
According to these observations, we can write the follow-ing expression for PT
(
t)
:PT
(
t) =
Na(
t)
P1 ×(N+rw) SSM+
Nd(
t)
P(NM +Mrw)×1 SSM+
Nc(
t)(
PSSMN×1+
P 1×N SSM+
PWC).
(3)Finally, we can write the following expression for the average power consumption PTav:
•
E[
Na]
, E[
Nd]
and E[
Nc]
are the steady-state averagevalues of the random processes Na
(
t)
, Nd(
t)
and Nc(
t)
,respectively, at an arbitrary epoch.
The average values Na
(
t)
, Nd(
t)
and Nc(
t)
are evaluatedin the next section.
4. Analytical evaluation of expected values of Na(t
)
,Nd
(
t)
and Nc(t)
As the traffic model, we use the Engset counterpart of the Bernoulli model that is used for SSPN and SSPW in [5]. In the Engset model, there are overall MN input channels and the traffic on each channel is modeled by an on–off source; the input channel is either in the on state and an optical packet is being transmitted or the input channel is in the off state and no packet is being transmitted. Moreover, each on–off source is assumed to be independent from the others. We assume in this study that the on and off times for each on–off source are exponentially distributed with means 1
/µ
and 1/λ
, respectively. The offered load to the system is denoted byp
=
λ/(λ + µ)
. We also assume that each optical packet will be destined to one of the output fibers with probability 1/
N. Therefore, the offered load for each output fiber lineis identical and is equal to p. Generalization to asymmetric traffic demand scenarios is left for future research.
For ASPW, we propose an analytical model comprising two interacting processes; one of them is the fiber process and the other one being the wavelength converter pool process. The fiber process keeps track of the channel occupancy of one of the N fibers (i.e., tagged fiber) whereas the converter pool process keeps track of the occupancy of one of the M converter pools (i.e., tagged converter pool) operating on a certain wavelength (i.e., tagged wavelength). Owing to symmetrical loading, all N fiber processes (M converter pool processes) are statistically identical and it will be sufficient to focus only on the tagged fiber and the tagged converter pool processes. In this simplified model, the fiber process depends on the converter pool process via the blocking probability PASPW
conv
which is defined as the probability of blocking of a packet due to the lack of a converter in the associated converter pool. On the other hand, the converter pool process is affected by the fiber process through the probability PdirASPW which is defined as the probability that an incoming packet on the tagged wavelength would need conversion and be directed to its associated converter pool.
Let us first concentrate on the tagged fiber process. For purposes of numerical efficiency, the traffic destined to a single fiber can be approximated by a Poisson process with
rate
η =
Mp. Such an approximation is justified when thenumber of on–off sources (i.e., K
=
NM on–off sources) islarge enough; see [15]. Under this assumption, let NASPW
a
(
t)
denote the number of occupied wavelength channels for the fiber process at time t and NASPW
a
(
t)
takes values inthe set
{
0,
1, . . . ,
M}
. Moreover, the fiber process defined by X(
t) = {
NASPWa
(
t) :
t≥
0}
is a non-homogeneousbirth–death (BD) type Markov process with the birth rates at state l given by
η
l=
η
M−
l M+
η
l M(
1−
P ASPW conv),
l=
0, . . . ,
M−
1.
(5)The death rate at state l is simply given by l
µ,
l=
1, . . . ,
M.If PASPW
conv is known, we can calculate xl
,
l=
0,
1, . . . ,
Mwhich is the steady-state probability of the Markov chain residing at state l. The blocking probability for a packet is then written as PlossASPW
=
xM+
M−1−
l=1 xl l MP ASPW conv.
(6)The first term in (6) represents the scenario when an arriving packet finds all M channels occupied whereas the second term corresponds to the case when there are idle channels on the fiber but the packet is dropped since it requires wavelength conversion and all the converters in its associated pool are occupied. However, the quantity
PconASPWv is not known yet. To calculate this quantity, note that the intensity of traffic destined to the tagged fiber but requiring conversion can be written as
ν
ASPW=
M−1−
l=1ηπ
l l M.
(7)The intensity of overall traffic directed to the tagged converter pool is then written as
ν = ν
ASPWN/
M,
(8)since there are N such fibers and the overall traffic will be distributed evenly among M wavelength converter pools.
Let us now focus our attention on the tagged converter pool process that is associated with one of the converter pools dedicated to the tagged wavelength. The traffic arrival process to this tagged converter pool comes from
M input channels and a packet in each of these channels
is directed to the converter pool with probability PASPW
dir .
The Poisson assumption for this traffic is not justified since the number of on–off sources M may not be large enough (compared to NM for the tagged fiber process). Assuming knowledge of
ν
and matching the intensity obtained in(8), we havePdirASPW
=
ν/
Kp.
(9)Now, we are ready to describe the converter pool pro-cess without having to use the Poisson approximation. For this purpose, let NcASPW
(
t)
and NoASPW(
t)
denote the number of wavelength converters that are in use in the converter pool and the number of sources coming on the tagged wavelength that are in the on state, respectively. The two-dimensional random process Y(
t) = {(
NASPWo
(
t),
NcASPW(
t)) :
t≥
0}
is then a Markov process on the statespace SY
= {
(
i,
j) :
0≤
i≤
M,
0≤
j≤
min(
rw,
i)}
. Thenon-zero transition rates of this Markov chain from state
(
i,
j)
to another state(
k,
l)
denoted byα
((ki,,jl))are given byα
(k,l) (i,j)=
(
M−
i)λ(
1−
PdirASPW),
0≤
j<
rw,
j≤
i<
M,
k=
i+
1,
l=
j,
(
M−
i)λ
PdirASPW,
0≤
j<
rw,
j≤
i<
M,
k=
i+
1,
l=
j+
1,
(
M−
i)λ,
j=
rw,
rw≤
i<
M,
k=
i+
1,
l=
rw,
µ
j,
0≤
j≤
rw,
max(
1,
j) ≤
i≤
M,
k=
i−
1,
l=
j−
1,
µ(
i−
j),
0≤
j≤
rw,
max(
1,
j) ≤
i≤
M,
k=
i−
1,
l=
j.
(10)This two-dimensional Markov chain has a block tridiagonal generator matrix whose steady-state probabilities of find-ing the system in state
(
i,
j)
denoted by yi,jcan be foundus-ing the block tridiagonal LU factorization algorithm given in [16]. Note that the complexity of the block tridiagonal LU factorization algorithm used for the wavelength converter pool process is O
(
Mr3w
)
. Given yi,j, we can write PASPWconv=
(λ + µ)
Mµ
M−
i=rw yi,rw(
M−
i).
(11)The expressions (5)–(11) allow one to propose a fixed-point iterative procedure. In this method, we start with an arbitrary PASPW
conv value and then construct the tagged fiber
process and calculate its steady-state probabilities xl. After
finding PASPW
dir from the tagged fiber process based on(9),
we construct the two-dimensional Markov chain associ-ated with the tagged converter pool process and its steady-state probabilities yi,jfrom which one obtains PASPWconv based
on(11). This procedure is repeated afterward until conver-gence. Upon convergence, we calculate the loss probability based on the expression given in(6). We also have
E
[
Na] =
NMλ
λ + µ
(
1−
PlossASPW),
E[
Nd] =
N(
1−
x0),
E
[
Nc] =
Mν(
1−
PASPWconv).
We also note that ASPN case can be analyzed similarly with the exception that the traffic towards the single shared converter pool can be assumed to be Poisson. This is in contrast with the on–off models used for both tagged pro-cesses as in [6,17]. Although we do not give details, we use this method for obtaining numerical results for this paper due to its numerical efficiency and low storage re-quirements but the results are almost identical if the on–off modeling is to be used as in [17,6].
5. Numerical results
Next, we compare the power consumption of four optical packet switches (OPS): the Asynchronous Shared-Per-Wavelength (ASPW) OPS proposed in this paper, the Asynchronous Shared-Per-Node (ASPN) OPS where the WCs are fully shared, the Synchronous Wavelength (SSPW) and Synchronous Shared-Per-Node (SSPN) OPSs where the packets are synchronously switched and the WCs are shared per wavelength and
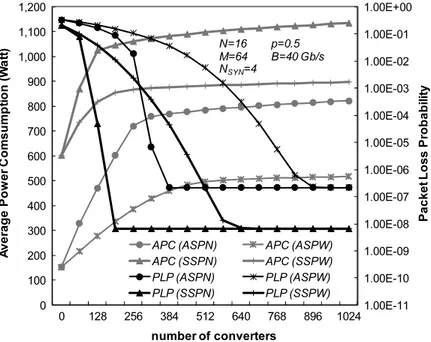
Fig. 4. Comparison of the Average Power Consumption (APC) and Packet Loss Probability (PLP) in ASPW, ASPN, SSPW and SSPN switches as a function of the number of WCs used. Switch and traffic parameters are N=16, M=64 and p=0.5. The synchronizers for SSPN and SSPW switches are realized with
NSYN=4 stages.
per node, respectively. To evaluate power consumption in ASPW OPS, we use the model described in Section3. The models described in [5–7] are used to evaluate the power consumption in ASPN, SSPW and SSPN optical packet switches. Power consumption of SOA gates during packet forwarding is here calculated as the predominant contribution with respect to the power needed for reconfiguring them in ON or OFF states [18].
Comparisons are performed under the following as-sumptions:
•
The SOA’s power consumption model given in [11] is adopted; the supply power PSOAal,Gof the SOA needed to realize the SSM can be expressed as follows:PSOAal,G
=
Vbib=
Vb
1
+
ln GΓSOA
α
SOALSOA
it
,
(12)where Vb is the SOA forward bias voltage, ib is the
polarization current, ΓSOA is the confinement factor,
α
SOAis the material loss, LSOAis the length and itis thetransparency current given by
it
=
q
w
SOAdSOALSOAN0τ
,
(13)where
w
SOAis the SOA active region effective width,dSOAis the active region depth, q
=
1.
6×
10−9C is theelectronic charge, N0 is the conduction band carrier density required for transparency,
τ
is the carrier spon-taneous decay lifetime. A♯
2 commercial SOA produced by manufacturer A is used. The values of the A♯
2 SOA parameters are reported inTable 1.•
The DISC Wavelength Converters are built by using theA
♯
1 and B♯
1 SOAs characterized by a Bulk and MQW-type structure and produced by manufacturers A and B, respectively. We report the values of the A♯
1 and B♯
2Table 1
Main parameter values for the A♯2 commercial SOAs used as ON–OFF gates [9].
Symbol Explanation Value
Vb Forward bias voltage 1 V
γSOA Confinement factor 0.15
αSOA Material loss 104
LSOA Length 700µm
wSOA Active region effective width 2µm dSOA Active region depth 0.1µm N0 Conduction band carrier density 1024m−3
τ Carrier spontaneous decay lifetime 10−9s
SOA parameters inTable 2. The power consumption, measured in [9,10], is also reported when the WC is operating at bit rate B
=
40 Gb/
s.InFig. 4, comparisons in terms of average power con-sumption (APC) and packet loss probability (PLP) are reported as a function of the total number of wavelength converters employed in synchronous and asynchronous SPN and SPW architectures.Fig. 4has been obtained for
N
=
16 input and output fibers, M=
64 wavelengths per fiber, NSYN=
4 synchronization stages, B=
40 Gb/sand load p
=
0.
5. The remarkable power saving obtained by ASPW with respect to the synchronous counterparts and to ASPN is outlined. In correspondence of the mini-mum numbers of WCs to obtain the asymptotic value of PLP, some hundreds of Watts can be saved by adopting the ASPW solution instead of SSPW or even ASPN. In par-ticular, the average power consumption is 1000 W, 870 W, 750 W and 500 W for SSPN, SSPW, ASPN and ASPW, respectively, when the WCs are optimally dimensioned. This observation is well supported by numerical results inFigs. 5–7where for the same traffic and switch parameters ofFig. 4, we provide various power consumption compo-nents.
Table 2
Main parameter values for the A♯1 and B♯1 commercial SOAs used as wavelength converters [9]; the power consumption of DISCs realized with A♯1 and
B♯1 SOAs is also reported at bit rate B=40 Gb/s. Type Active region length
(µm)
Active region width (µm)
Active region thickness (µm) Confinement factor Consumed power (mW) (40 Gb/s) A#1 Bulk 1000 2 0.1 0.1–0.2 433 B#1 MQW 1100 1.25 0.038 0.2 187
Fig. 5. Comparison in ASPW, ASPN, SSPW and SSPN switches of the Average Power Consumption for the 1st SSM stage as a function of the number of WCs used. Switch and traffic parameters are N=16, M=64 and p=0.5. Average Power Consumption for the synchronization stage is also reported for SSPN and SSPW switches when each synchronizer is realized with NSYN=4 stages.
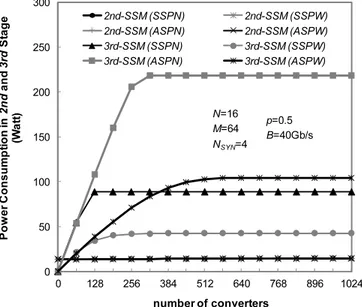
Fig. 6. Comparison in ASPW, ASPN, SSPW and SSPN switches of the Average Power Consumption for the 2nd and 3rd SSM stages as a function of the number of WCs used. Switch and traffic parameters are N=16, M=64 and p=0.5.
The power consumption in the 1st SSM and the synchronizer stages are reported inFig. 5. We can observe how the high power consumption of the synchronizer in synchronous OPS (SSPN, SSPW) makes them relatively less power-efficient. The contribution to power consumption
of the 1st SSM in both SSPW and ASPW is lower with respect to SPN solutions with values between one and two hundreds of Watts in the region of interest for switch design. Further significant saving is introduced by ASPW with respect to ASPN in the 3rd stage, as shown inFig. 6.
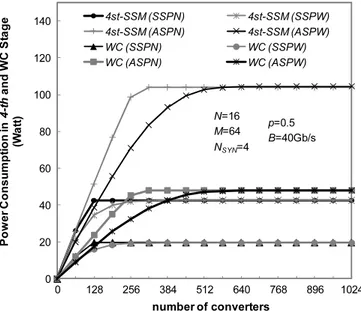
Fig. 7. Comparison in ASPW, ASPN, SSPW and SSPN switches of the Average Power Consumption for the 4th SSM and WC stages as a function of the number of WCs used. Switch and traffic parameters are N=16, M=64 and p=0.5.
Fig. 8. Dimensioning of wavelengths and WCs in ASPW, ASPN, SSPW and SSPN switches so that the PLP is smaller than or equal to 10−6. The number N of
input/output fibers equal 16 and the offered traffic p is varying from 0.1 to 0.6.
The reduction in power consumption in 1st and 3rd SSM stages is due to the lower complexity of the switching modules used that introduce lower consumption in the SOA to overcome the SSM attenuation. In fact, a 1
:
N+
rsplitting ratio is needed in the SSM of the 1st SSM stage for the ASPN switch and then according to(12), a power consumption proportional to the ln
(
N+
r)
where r=
384 is the total number of WCs shared in ASPN switch when the WCs are optimally dimensioned. Conversely, the splitting ratio in the ASPW is much smaller, that is 1:
N+
rwwhererw
=
14 is the number of WCs shared and used by the packets arriving on a given wavelength. For the 3rd SSM stage, there is a complexity reduction from the M×
N:
1coupling factor in the ASPN switch to the N
:
1 one in the ASPW switch. This is due to the fact that a WC is shared among all the MN input wavelength channels in the SPN switch while the sharing is partial in SPW switch and onlyN input wavelength channels can access to a WC. From
Fig. 6, we observe also how synchronous switches consume less power at the 3rd stage. This is due to less contention events, that lead to the use of fewer WCs and consequently fewer SSMs of the 3rd stage. This is confirmed also inFig. 7
which depicts the comparisons of power consumption at the 4th SSM and in WCs.
Sample switch design is reported inFig. 8with target PLP
≤
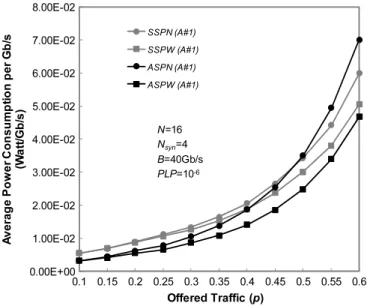
10−6. Fig. 8 has been obtained for ASPW, ASPN,Fig. 9. Average power consumption per Gb/s in ASPW, ASPN, SSPW and SSPN switches versus the offered traffic for N =16 and NSYN=4. The number M of wavelengths and the number of WCs are dimensioned so that the PLP is smaller than or equal to 10−6. The SSMs are implemented with A♯2 SOAs
realized by manufacturer A. Wavelength Converters are implemented with A♯1 SOAs realized by manufacturer A.
Fig. 10. Average power consumption per Gb/s in ASPW, ASPN, SSPW and SSPN switches versus the offered traffic for N=16 and NSYN=4. The number M of wavelengths and the number of WCs are dimensioned so that the PLP is smaller than or equal to 10−6. The SSMs are implemented with A♯2 SOAs
realized by manufacturer A. Wavelength Converters are implemented with B♯1 SOAs realized by manufacturer B.
SSPN, and SSPW switches by the application of the rela-ted models, for switch size N
=
16, varying the offered traffic p. The number of wavelengths needed to obtain the asymptotic target PLP value (10−6) is calculatedfirst for each value of the offered load. This number of wavelengths depends on output contention only and therefore is influenced by the choice of operational context (synchronous or asynchronous) and not by the switch architecture. As a consequence, the synchronous solutions require fewer wavelengths to achieve the same PLP target. Then the minimum number of wavelength converters to reach that asymptotic PLP target value (see
Fig. 4) is determined. Results of Fig. 4 show that this minimum number of wavelength converters is higher for
SPW architectures with respect to those associated with SPN.
In Figs. 9 and 10, power consumption of switch configurations obtained in Fig. 8 as a function of the offered load is presented, for components realized by different manufacturers. In fact, both figures assume that the SOAs employed in SSMs are A
♯
2 while SOAs employed as wavelength converters are A♯
1 and B♯
1 respectively. Average power consumption is here normalized to Gb/s of forwarded information. The ASPW architecture presents itself as the most power-efficient solution among all compared solutions as a consequence of the combination of asynchronous operation and wavelength converter sharing solution. The increasing behavior as a function ofresults show that the combination of the asynchronous operation with the wavelength-based system partitioning in ASPW leads to significant power saving with respect to the other solutions in the range of interest for switch-ing fabric dimensionswitch-ing. A sample switch design with tar-get PLP performance has confirmed the expectation for different characteristics of commercial components. This work is anyway based on component theoretical model-ing only and can further be validated by application of measurement-based evaluation of component behavior in practical test-beds. Control power consumption evaluation is another area of investigation but this work is intention-ally limited to the analysis of the switching fabrics only.
Acknowledgements
The work described in this paper was carried out with the support of the BONE-project (‘‘Building the Future Optical Network in Europe’’), a Network of Excellence funded by the European Commission through the 7th ICT-Framework Programme. The authors also wish to thank Prof. Slavisa Aleksic for the helpful discussion in the preparation of the final release of the paper.
References
[1] K. Sato, H. Hasegawa, Optical networking technologies that will create future bandwidth abundant networks, IEEE/OSA Journal of Optical Communication Networking 1 (2) (2009) A81–A93. [2] S. Aleksic, Analysis of power consumption in future high-capacity
network nodes, IEEE/OSA Journal of Optical Communication Net-working 1 (3) (2009) 245–258.
[3] P. Primet, S. Soudan, D. Verchere, Virtualizing and scheduling optical network infrastructure for emerging IT services, IEEE/OSA Journal of Optical Communication Networking 1 (2) (2009) A121–A132.
fabrics, IEEE Journal of Selected Topics in Quantum Electronics 17 (2) (2011) 396–405.
[8] V. Eramo, M. Listanti, P. Pacifici, A comparative study on the number of wavelength converters needed in synchronous and asynchronous all-optical switching architectures, IEEE/OSA Journal Lightwave of Technology 21 (February) (2003) 340–355.
[9] J. Sakaguchi, F. Salleras, K. Nishimura, Y. Ueno, Frequency-dependent electric dc power consumption model including quantum-conversion efficiencies in ultrafast all-optical semiconductor gates around 160 Gb/s, Optics Express 15 (October) (2007) 14887–14900. [10] Y. Ueno, J. Sakaguchi, R. Nakamoto, T. Nishida, Ultrafast, low-energy-consumption, semiconductor-based, all-optical devices, in: 4-th Asia-Pacific Photonics Conference, APMP 2009, Bejing, China, April 2009.
[11] K. Hinton, G. Rakutti, P. Farrel, R.S. Tucker, Switching energy and device size limits on digital photonic signal processing technologies, IEEE Journal of Selected Topics in Quantum Electronics 14 (May/June) (2008) 938–945.
[12] J.P. Mack, H.N. Poulsen, D.J. Blumental, 40 Gb/s autonomous optical packet synchronizer, in: Optical Fiber Communication Conference, San Diego, California, February 2008.
[13] J.P. Mack, H.N. Poulsen, D.J. Blumental, Variable length optical packet synchronizer, IEEE Photonic Technology Letters 20 (July) (2008) 1252–1254.
[14] V. Eramo, A. Germoni, C. Raffaelli, M. Savi, Packet loss analysis of shared-per-wavelength multi-fiber all-optical switch with parallel scheduling, Elsevier Computer Networks 53 (2) (2009) 202–216. [15] N. Akar, Y. Gunalay, Stochastic analysis of finite population bufferless
multiplexing in optical packet/burst switching systems, IEICE Transactions on Communications 90-B (2) (2007) 342–345. [16] N. Akar, E. Karasan, K. Dogan, Wavelength converter sharing in
asynchronous optical packet/burst switching: an exact blocking analysis for Markovian arrivals, IEEE Journal on Selected Areas in Communications 14 (12) (2006) 69–80. Part Supplement. [17] N. Akar, E. Karasan, C. Raffaelli, Fixed point analysis of limited range
share per node wavelength conversion in asynchronous optical packet switching systems, Photonic Network Communications 18 (2) (2009) 255–263.
[18] R.S. Tucker, Green optical communications-Part II: energy limita-tions in networks, IEEE Journal of Selected Topics in Quantum Elec-tronics (2010) 1–10. Special issue on Green Photonics, Digital Object Identifier:http://dx.doi.org/10.1109/JSTQE.2010.2053350.