„111…-7Ã7 surface
with small-amplitude off-resonance atomic force microscopy
Mehrdad Atabaka兲
Department of Physics, Bilkent University, Bilkent, Ankara 06800, Turkey
Özhan Ünverdi
Faculty of Engineering and Natural Sciences, Sabanci University, Tuzla, 34956 Istanbul, Turkey
H. Özgür Özer
Department of Physics, Faculty of Science and Letters, Istanbul Technical University, Maslak, 34469 Istanbul, Turkey
Ahmet Oral
Faculty of Engineering and Natural Sciences, Sabanci University, Tuzla, 34956 Istanbul, Turkey
共Received 20 August 2008; accepted 17 February 2009; published 1 April 2009兲
In this work, the authors report on a quantitative investigation of lateral-force gradient and lateral force between a tungsten tip and Si共111兲-共7⫻7兲 surface using combined noncontact lateral-force microscopy and scanning tunneling microscopy. Simultaneous lateral-force gradient and scanning tunneling microscopy images of single and multiatomic step are obtained. In our measurement, tunnel current is used as feedback. The lateral-stiffness contrast has been observed to be 2.5 N/m at a single atomic step, in contrast to 13 N/m at a multiatomic step on Si 共111兲 surface. They also carried out a series of lateral stiffness-distance spectroscopy, which show a sharp increase in tip-surface interaction stiffness as the sample is approached toward the surface. © 2009 American
Vacuum Society.关DOI: 10.1116/1.3097857兴
I. INTRODUCTION
Lateral forces play an important role in a variety of phe-nomena in our daily lives, as well as in micro- and nanoscale systems. Initial approaches to understand the origin of the lateral forces associated with the relative motion of two ob-jects were mainly based on collective mechanical properties of interacting objects.1 However, investigations of lateral forces and interaction energy at the molecule and atomic scale need the accurate measurement of lateral stiffness of single chemical bonds established between the objects in contact. Lateral-force microscopy 共LFM兲 has shown its ca-pability to image and identify lateral forces at the atomic scale while a sharp-tip scans over a sample surface.2
In 1987, Mate et al.2imaged lateral forces acting between a sharp tungsten tip and a graphite surface, and stick-slip behavior was observed. Later, different research groups3,4 detected atomic stick-slip behavior using an ultrahigh-vacuum共UHV兲 friction force microscopy apparatus on ionic crystals and metal surfaces and made comparisons with theo-retically produced lateral-force maps based on two-dimensional Tomlinson model.
Studies of atomic-scale origins of lateral forces while sharp-tip scanning in low-load contact over sample surfaces have already contributed to the understanding of the micro-scopic origins of friction forces. However, the lateral reso-lution of force microscopy in contact mode is limited by the contact area of the tip apex, containing many atoms due to
adhesion between a tip and sample. This problem has been eliminated in noncontact atomic force microscopy 共nc-AFM兲. Jarvis et al.5
developed a special cantilever for simul-taneous control of tip-sample distance and lateral tip oscilla-tions in order to sense lateral interacoscilla-tions between tip and sample when approaching the surface. Giessibl et al.6 pre-sented atomic resolution in lateral force while using a tuning fork lateral-force sensor. Their sensor had a glued tungsten tip at the end of one prong, while the other prong remained fixed. The tip was intentionally tilted with respect to the sample by 6°, and the interaction between a single-tip atom that is oscillating with 3 Å slightly cant to the Si共111兲-共7 ⫻7兲 surface is measured in dynamic-mode AFM. However, the tilt of the force sensor with respect to the sample might reflect the contribution of a normal forces gradient in addi-tion to a lateral-force component. In another work, Pfeiffer et
al.7reported the measurement of lateral forces between the tip of a force microscope and the atomic-scale features on the surface in a noncontact mode using 20 Å amplitudes. In their experiment, a rectangular cantilever beam oscillates parallel to the Cu共111兲 sample surface at its torsional eigenmode, while the tunnel current is kept constant with the feedback loop.
In some recent works, Kawai et al.8reported atomic res-olution in lateral force using a few angstrom amplitude with the frequency-modulation dynamic lateral-force microscopy 共FM-AFM兲. In their experiment, torsional resonance mode of a commercially available rectangular cantilever was used to detect the lateral interaction force gradients caused between the tip and sample surface. Schwarz et al.9presented a three-dimensional force field spectroscopy method and demos-a兲Author to whom correspondence should be addressed; present address:
Omicron Nanotechnology GmbH, Limburger Str. 75, 65232 Taunusstein, Germany; electronic mail: [email protected]
trated interatomic vertical and lateral forces in the noncontact regime on NiO共100兲. Abe et al.10
also calculated the inter-atomic potential and the lateral-force mapping from the mea-surement of frequency-shift curves in the vertical direction using FM-AFM.
All of the above attempts have shown that the sub-Angstrom oscillation amplitude lateral-force microscopy would reveal more insight into the lateral-force interactions between tip and sample, down to single atoms. In this report, we present for the first time the simultaneous lateral stiffness and scanning tunneling microscope 共STM兲 topography im-ages on the Si共111兲-共7⫻7兲 surface. We also report the direct measurement of lateral forces as we vary the tip-sample separation, similar to our earlier experiments using ultrasmall-amplitude noncontact AFM/STM11–13 in normal forces.
II. EXPERIMENTAL METHODS
A homemade, high-resolution nc-LFM/STM operating in UHV is used in our experiments. The microscope employs a sensitive fiber-optic interferometer for high force resolution. Sub-Angstrom oscillation amplitudes can be used for imag-ing, as well as for performing direct lateral-force versus dis-tance spectroscopy. Details of the instrument are described elsewhere.14A radio frequency共rf兲 circuit developed by Na-noMagnetics Instruments Ltd.15 is used to inject rf current into the laser diode to improve the sensitivity. The frequency and amplitude of the rf current can be adjusted to optimize the noise reduction. A noise level of⬃1⫻10−4Å/共Hz兲1/2is routinely obtained using this technique. Straight, etched, homemade tungsten levers from tungsten ribbons with a typical stiffness of 50 N/m are used in the experiment. By considering the dimensions of the levers, the stiffness is calculated.
A high-precision, piezodriven, five-axis positioner was used to align the fiber with respect to the cantilever, as shown in Fig. 1. A Si共111兲 sample was cut from
525-m-thick, P-doped, n-type wafers oriented within 0.5° off共111兲 plane. Both ex situ and in situ processes are applied
to clean the samples. The sample was cleaned with propanol in an ultrasonic bath and then rinsed with overflowing de-ionized water. Samples are then dried with blowing dry ni-trogen gas before transferring into the load-lock chamber. The sample is then transferred into the UHV system and degassed at 650 ° C for about 7 h while the base pressure is kept below 5⫻10−10mbar.
The sample is then flashed around 1200 ° C for 1 min and the sample temperature is slowly reduced by means of de-creasing the e-beam heater current.
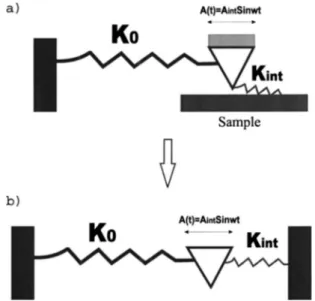
Figure2shows the operation of the microscope. The lever is vibrated with sub-Angstrom oscillation amplitudes parallel to the sample surface at a frequency well below its reso-nance, and the changes in the oscillation amplitude are mea-sured using a lock-in amplifier as the sample is scanned across the tip. The microscope is operated with STM feed-back, and simultaneous scans of STM topography, tunneling current, and force gradient can be acquired. The use of very small oscillation amplitudes at frequencies far below reso-nance allowed us to treat the cantilever motion as a linear spring, and by solving the linearized equation of motion,16 the lateral-force gradient between tip and sample can be de-duced using the simple expression
klateral= −
dFlateral
dx = k0
冉
A0Aintcos− 1
冊
, 共1兲where klateral, k0, A0, and Aint. are the interaction stiffness, cantilever stiffness, lateral free-oscillation amplitude, and measured lateral amplitude of the cantilever, respectively. is the phase difference between the drive and lever. The phase difference between the driving signal and actual lever motion gives a measure of losses. We measured the phase difference less than 6°, which is small enough to ne-glect the energy loss.
FIG. 1. Photo of the aligned optical fiber at the side of the special cantilever to measure the lever deflections.
FIG. 2. 共a兲 Schematic view of lateral tip-sample interaction and 共b兲mass-spring modeling of the tip-sample interaction.
III. RESULTS AND DISCUSSIONS
In the first series of experiments, we imaged a clean Si共111兲 surface using a lateral cantilever. The cantilever’s resonance frequency was 18.049 kHz, and the lever was os-cillated parallel to the surface with an oscillation frequency of 7.56 kHz, far below its first resonance frequency with an oscillation amplitude of 0.4 Åp. Operating AFM at a constant subresonance frequency assures that we can eliminate dy-namic terms in the equation of motion of the cantilever, and it makes it easier to keep the AFM in the small-amplitude regime. The tunnel current is used for feedback to control the tip-sample distance. The scan speed was set to 40 Å/s, and the tip bias voltage and set tunnel current were −1 V and 0.4 nA, respectively. The single atomic and multiatomic steps on Si共111兲 are resolved in both topography and lateral-stiffness channel, as shown in Fig.3. The lateral stiffness is measured quantitatively. At the two upper we measured ter-races almost zero lateral-force gradient, followed by 2.5 N/m at the single atomic step edge. The zero lateral gradient while the tip scans the upper terraces can be attrib-uted to the symmetrical force gradient that the tip apex senses while it is located at the terraces. However, the lateral stiffness of about 13 N/m is measured at the lower terrace. The difference of the force gradient at different terraces might be due to a high density of defects and impurities on
the lower terrace, which were not resolved in the topography image. The lever stiffness is calculated to be 70 N/m, and the oscillation amplitude was 0.4 Åp.
It should be noted that the observable residual noise in the measurements is due to the low oscillation amplitude, as well as the relatively short-time constant used in the lock-in am-plifier. Image quality might be improved by using higher cantilever resonance frequency and would allow us to set a higher exciting frequency and larger time scale.
We have also performed lateral-force gradient-distance spectroscopy. The feedback loop is suspended. The sample is first retracted back by a specified distance and reapproached toward the tip, while recording the force gradient and the tunnel current to perform the spectroscopy. A threshold cur-rent level is used to stop and retract the sample. In Fig.4, the force gradient-distance spectroscopy curve starts to increase earlier than the tunnel-current onset, and the effective barrier height is calculated to be 0.4⫾0.3 eV. This extremely small value for effective barrier height indicates that the tip or sample has some contamination. To increase the current, tip must be indented into the surface. In another series of experi-ments, as shown in Fig. 5, the tunnel current starts before lateral-force gradient onset, which means that the van der Waals forces were reduced at very small separations between
FIG. 3. Simultaneous imaging of Si共111兲. 共a兲 Topography image and lower curve shows the cross-section view of the STM topography image. 共b兲 Lateral-force gradient image and lower curve shows the cross-section view of the force-gradient image. Image size: 213⫻80 Å2. The lever was oscillated parallel to the
surface with an oscillation frequency of 7.56 kHz and oscillation amplitude of 0.4 Åp. Tip bias voltage and set tunnel current were −1 V and 0.4 nA,
tip and surface and the standard power law will not apply. The theory of this effect was investigated by Heinrichs17and Buhl.18
The lateral-force gradient-tunneling spectroscopy exhibits a sudden change in force gradient, while the tunneling cur-rent increases smoothly in the course of the sample ap-proaching the oscillating cantilever. The maximum repulsive-force gradient is measured to be 46 N/m. The ef-fective barrier height19 is calculated to be 4.2⫾0.4 eV, which implies that tip and sample are clean. For both experi-ments, we used the same cantilever, but different sites of the sample, the same bias voltage is used for both measurements,
Vbias= −1 V. Our measurement reveals that there are signifi-cant lateral-force gradients acting on the tip during typical STM experiments. The lateral-force gradient at 1 nA tunnel
currents can be as large as 20– 40 N/m. The current levels tested here are typical currents that are used at STM experiments.
In conclusion, a novel fiber-optic interferometer-based lat-eral nc-AFM/STM is used to investigate the latlat-eral stiffness between a tungsten tip and the Si共111兲-共7⫻7兲 surface. The improvement in the resolution of the interferometer allowed us to use very small oscillation amplitudes to oscillate the cantilever parallel to the surface, which overcomes the prob-lems associated with the large-amplitude technique that has been widely used. Because we use small amplitudes, we can extract lateral forces by measuring the changes in the oscil-lation amplitude directly, rather than the frequency shift. We have observed single and multiatomic steps in topography and lateral-stiffness images. This information allowed us to measure the lateral force directly and quantitatively. Our ex-periments reveal the first direct measurement of lateral stiff-ness in dynamic mode. Lateral- force gradient-distance spec-troscopy experiments have also been carried out, in which we simultaneously measured the force gradient and tunneling current as the sample is approached toward the tip and re-tracted back. We obtained lateral-force gradient-distance curves exhibiting a sharp increase in the force gradient while the sample is approaching the surface. We observed positive and slightly negative force gradients. We described that the lack of a pronounced attractive region in the lateral-force gradient could be due to cancellation of long-range attractive forces acting on the tip because of the symmetry of the sur-face structure. We observed, for the first time, surprisingly large, lateral stiffness in typical STM operating currents at 1 nA.
ACKNOWLEDGMENTS
This project is funded in Turkey by TÜBITAK Grant No. TBAG-2329 and the European Union NANOMAN Grant. The authors would like to thank Mr. Muharrem Demir of NanoMagnetics Instruments Ltd. for the technical support. A.O. thanks the Turkish Academy of Sciences 共TÜBA兲 for financial support.
1B. N. J. Persson, Sliding Friction, Physical Principles and Applications,
2nd ed.共Springer, Berlin, 2000兲.
2C. M. Mate, G. M. McCleland, R. Erlandsson, and S. Chiang, Phys. Rev.
Lett. 59, 1942共1987兲.
3L. Howald, R. Luthi, E. Meyer, G. Gerth, H. Haefke, R. Overney, and H.
J. Guentherodt, J. Vac. Sci. Technol. B 12, 2227共1994兲.
4R. Bennewitz, E. Gnecco, T. Gyalog, and E. Meyer, Tribol. Lett. 10, 51
共2001兲.
5S. P. Jarvis, H. Yamada, K. Kobayashi, A. Toda, and H. Tokumoto, Appl.
Surf. Sci. 157, 314共2000兲.
6F. Giessibl, M. Herz, and J. Manhart, Proc. Natl. Acad. Sci. U.S.A. 99,
12006共2002兲.
7O. Pfeiffer, R. Bennewitz, A. Baratoff, and E. Meyer, Phys. Rev. B 65,
161403共2002兲.
8S. Kawai, S. Kitamura, D. Kobayashi, and H. Kawakatsu, Appl. Phys.
Lett. 87, 173105共2005兲.
9A. Schwarz, H. Hölscher, S. M. Langkat, and R. Wiesendanger, AIP
Conf. Proc. 697, 68共2003兲.
10M. Abe, Y. Sugimoto, T. Namikawa, K. Morita, N. Oyabu, and S. Morita,
Appl. Phys. Lett. 90, 203103共2007兲.
11A. Oral, R. A. Grimble, H. Ö. Özer, P. M. Hoffmann, and J. B. Pethica,
Appl. Phys. Lett. 79, 1915共2001兲. FIG. 4. Simultaneous lateral-force gradient-distance and tunnel current vs
distance spectroscopy. The sample bias voltage was set on −1 V. The can-tilever free-oscillation amplitude is 0.4 Åp.
FIG. 5. Simultaneous lateral-force gradient-distance and tunnel current vs distance spectroscopy. The sample bias voltage was set on −1 V. The can-tilever free-oscillation amplitude is 0.4 Åp. This curve was obtained from
different sites on the sample away from the position that Fig. 4 was acquired.
12P. M. Hoffmann, A. Oral, R. A. Grimble, H. Ö. Özer, S. Jeffery, and J. B.
Pethica, Proc. R. Soc. London, Ser. A 457, 1161共2001兲.
13H. Ö. Özer, M. Atabak, R. M. Elliatioglu, and A. Oral, Appl. Surf. Sci.
188, 301共2002兲.
14M. Atabak and A. Oral共unpublished兲.
15NanoMagnetics Instruments Ltd., Suite 290, 266 Banbury Road, Oxford
OX2 7DL, UK.
16P. M. Hoffmann, Appl. Surf. Sci. 210, 140共2003兲. 17J. Heinrichs, Solid State Commun. 13, 1595共1973兲. 18W. Buhl, Z. Phys. B 23, 221共1976兲.
19The effective barrier height is calculated I
i共z兲=I0e共−2冑2m/ប兲z, where m is
the mass of the electron,ប is Planck’s constant,is the effective barrier height, and z is the tip-sample separation. I0is a function of the applied