EFFECTS OF BRONSTED AND LEWIS BASES ON
FORMIC ACID DEHYDROGENATION SELECTIVITY
OF Pd(111) SINGLE CRYSTAL MODEL CATALYST
A THESIS SUBMITTED TO THE GRADUATE SCHOOL OF ENGINEERING
AND SCIENCE OF BILKENT UNIVERSITY IN PARTIAL FULFILLMENT OF
THE REQUIREMENTS FOR THE DEGREE OF MASTER OF SCIENCE IN
CHEMISTRY
By
Bartu Karakurt
June 2020
ii
EFFECTS OF BRØNSTED AND LEWIS BASES ON FORMIC ACID
DEHYDROGENATION SELECTIVITY OF Pd(111) SINGLE CRYSTAL
MODEL CATALYST
By Bartu Karakurt June 2020
We have certified that we have read this dissertation and that in our opinion it is fully adequate, in scope and quality, as a dissertation for the degree of Master of Science.
Emrah Özensoy (Advisor)
Şefik Süzer
Mehmet Fatih Danışman
Approved for the Graduate School of Engineering and Science:
Ezhan Karasan
iii
ABSTRACT
EFFECTS OF BRONSTED AND LEWIS BASES ON
FORMIC ACID DEHYDROGENATION SELECTIVITY OF
Pd(111) SINGLE CRYSTAL MODEL CATALYST
By Bartu Karakurt
M.Sc. in Chemistry
Advisor: Emrah Özensoy
June 2020
Formic acid (FA) is an environmentally friendly hydrogen-based energy vector that can be obtained from renewable biomass feedstocks. However, catalytic decomposition of FA involves two different competing chemical pathways called dehydration and dehydrogenation. Thus, molecular level studies focusing on the selective catalytic FA dehydrogenation are essential for establishing structure-reactivity relationships which can be used in order to increase the catalytic dehydrogenation selectivity. In the current work, effects of Bronsted and Lewis bases on catalytic FA dehydrogenation selectivity were studied under ultra-high vacuum (UHV) conditions on an atomically well-defined Pd(111) single crystal model catalyst surface by using temperature programmed desorption/temperature programmed reaction spectroscopy (TPD/TPRS), X-Ray photoelectron spectroscopy (XPS) and low energy electron diffraction (LEED) techniques. Doubly-deuterated FA (DCOOD) was used as the FA source, while ammonia and manganese oxide were chosen as the model Bronsted and Lewis bases. Adsorption and subsequent surface decomposition reaction of DCOOD on Pd(111) showed that model catalyst was not totally selective towards dehydrogenation. Functionalizing the Pd(111) surface with ammonia suppressed the FA dehydration and boosted the
iv
dehydrogenation pathway, where positive influence of ammonia on FA dehydrogenation selectivity decayed when ammonia coverage was greater than 1 ML. A boost in hydrogen generation was observed in the catalytic FA dehydrogenation on manganese oxide-deposited Pd(111) surface (at sub-monolayer manganese oxide regime) as compared to that of a clean Pd(111) model catalyst. It was found out that manganese oxide can enhance FA dehydrogenation by acting as a promoter and/or catalytically contributing to the reaction depending on the oxidation state composition.
Keywords: Bronsted base, Lewis base, Formic acid, Dehydrogenation, Pd(111), Model Catalyst
v
ÖZET
BRONSTED VE LEWIS BAZLARININ Pd(111) TEK
KRİSTAL MODEL KATALİZÖRÜNÜN FORMİK ASİT
DEHİDREJENASYON SEÇİCİLİĞİNE OLAN ETKİLERİ
Bartu Karakurt
Kimya, Yüksek Lisans
Tez Danışmanı: Emrah Özensoy
Haziran 2020
Formik asit (FA) yenilenebilir biyokütle atıklarından elde edilebilen, çevre dostu bir hidrojen kaynağıdır. FA her ne kadar ümit verici bir alternatif hidrojen kaynağı olsa da; bu molekülün yan reaksiyonlar vermeye yatkın olması formik asitten yüksek verimlilikle hidrojen üretilebilmesi için dehidrejenasyon katalizörleri kullanmayı zorunlu bir hale getirmektedir. Bu bağlamda, katalitik FA parçalanması üzerine yoğunlaşan moleküler düzeydeki çalışmalar kimyasal yapı-reaktivite ilişkilerinin irdelenmesi ve buna paralel olarak, katalizörlerin FA dehidrejenasyon seçiciliklerinin arttırılması adına büyük önem taşımaktadır. Bu çalışmada, Bronsted ve Lewis bazlarının Pd(111) tek kristal model katalizörünün FA dehidrejenasyon seçiciliğine olan etkileri, sıcaklık programlı desorption/sıcaklık programlı reaksiyon spektroskopisi (TPD/TPRS), X-ışını fotoelektron spectroskopisi (XPS) ve düşük enerjili elektron kırınımı (LEED) teknikleri kullanılarak ultra-yüksek vakum (UHV) koşulları altında incelenmiştir. Çalışmalar sırasında, FA kaynağı olarak, her iki hidrojeni de izotopik olarak etiketlenmiş FA (DCOOD) kullanılırken; amonyak ve mangan oksit sırasıyla model Bronsted ve Lewis bazları olarak kullanılmıştır. DCOOD’nin Pd(111) yüzeyine adsorpsiyonu ve takiben yüzeyde verdiği dehidrasyon ve dehidrejenasyon reaksiyonları sonucunda katalizörün FA
vi
dehidrejenasyon seçiciliğinin %100 olmadığı saptanmıştır. Pd(111) yüzeyinin amonyakla işlevselleştirilmesi sonucunda; FA dehidrejenasyon seçiciliğinin arttırdığı ve dehidrasyon reaksiyonunun baskılandığı gözlemlenmiş ve amonyağın dehidrejenasyon seçiciliği üzerindeki pozitif etkisinin yüzeyde 1 ML’den (ML, tek katman) daha fazla amonyak bulunması durumunda azaldığı görülmüştür. Benzer bir şekilde; Pd(111) yüzeyinin 0.25 ML mertebesinde mangan oksitle kaplanması sonucunda, hidrojen üretiminin, temiz Pd(111) yüzeyine kıyasla, önemli şekilde arttığı görülmüştür. Bulgularımız, mangan oksitin oksidasyon duruma bağlı olarak, hidrojen üretimini hem FA’ın katalizör yüzeyiyle daha güçlü etkileşmesini sağlayarak (FA’ın yüzey adsorpsiyonunu ve yüzey yayılımını arttırarak), hem de katalitik olarak arttırabildiğini ortaya koymuştur.
Anahtar Sözcückler: Bronsted bazı, Lewis bazı, Formik asit, Dehidrejenasyon, Pd(111), Model Katalizör
vii
Acknowledgements
Foremost, I would like thank my advisor Dr. Emrah Özensoy for patiently believing in me and guiding me starting from my Freshman years. His vision and immense knowledge taught me the invaluable essence of how to think, evaluate and act like a scientist. He is, and will be, undoubtably the most influential person in my academic career and I will be always grateful to him for giving me a chance to work in my favorite research field.
Besides my advisor, I would like to thank rest of my thesis committee, Prof. Şefik Süzer and Assoc. Prof. Mehmet Fatih Danışman for their invaluable comments and time.
I would like to thank Dr. Yusuf Koçak for standing out for me as a big brother and sharing his vast research and life experience with me during the most challenging times. I will be always grateful for him for the unlimited support and patience that he showed me during my most vulnerable times. I would like to also thank my former lab mate Dr. Mustafa Karatok for always sparing time for me and genuinely supporting me whenever I needed, Ali Vâlâ Koç for trying his best to share his research experience with me despite the hardships that he dealt with and Dr. Igor Lyubinetsky for giving me a chance to work with him and learn from his immense knowledge and research experience.
I would like to thank all of my group members, especially Gökberk Katırcı for his sincere friendship and being there for me to help in any way possible. I would like to also thank Kerem Emre Ercan for initially inspiring me to become a good scientist as a great TA and then leading me at various beamtime shifts as an exceptional colleague.
I would like to thank Mahircan Ganioğlu for teaching me the meaning of true friendship and being the best friend that I have ever had. Without him, I would not be who I am today.
My warmest gratitude goes to the people that I have learned from the most. I would like to thank Xieraili Alimujiang for teaching me the core of mental/physical strength and for all the fun that we had during our billiards matches. Especially, I would like to thank Reyihanguli Alimujiang from the bottom of my heart for teaching me how to love myself, how to love others and live as a courageous and independent man.
Finally, my most sincere gratitude goes to my parents, who are the two most important people in my life. I would like to thank them for all the effort that they showed in order to raise me and for their unconditional love.
viii
Table of Contents
1.
Introduction
1
1.1 Future and Sustainability of the Global Energy Demand and Environment ... 1
1.2 Hydrogen as an Alternative Fuel Source ... 1
1.3 Formic Acid as a Potential Hydrogen Source ... 2
1.4 A Literature Review on Formic Acid Dehydrogenation Catalysts ... 3
1.5 Key Aspect of Formic Acid Decomposition on Heterogeneous catalysts ... 4
1.5.1 Effects of Coordination Number of Catalyst Surface and Adsorption Geometry of Formic Acid on Dehydrogenation Selectivity ... 4
1.5.2 Relationship Between Catalyst Life Span and Dehydrogenation Selectivity ... 7
1.6 Effects of Brønsted and Lewis Bases on Formic Acid dehydrogenation selectivity of Heterogenous Catalysts ... 7
1.7 Motivation of the Current Study ... 9
2.
Experimental
12
2.1 Experimental Setup ... 122.2 Surface Characterization Techniques Utilized in This Study ... 13
2.3 Low Energy Electron Diffraction (LEED) ... 14
2.4 X-Ray Photoelectron Spectroscopy (XPS) ... 17
2.5 Temperature Programmed Desorption/Reaction Spectroscopy (TPD/TPRS) ... 19
2.6 Experimental Procedures ... 24
2.6.1 Cleaning of Pd(111) Single Crystal Model Catalyst... 24
2.6.2 Doubly-Deuterated Formic Acid Residual Gas analysis (RGA) ... 25
2.6.3 Protecting Deuterium Labelling of Doubly-Deuterated Formic Acid ... 26
2.6.4 Characterization of Pd(111) Single Crystal Model Catalyst... 27
2.6.5 Deposition of Manganese (Mn) on Pd(111) ... 28
3.
Effects of Brønsted Bases on Formic Acid Dehydrogenation
Selectivity of Pd(111) Single Crystal Model Catalyst
31
3.1 Ammonia (NH3) Adsorption on Pd(111) ... 32ix
3.3 DCOOD Adsorption on NH3 functionalized Pd(111) ... 39
3.3.1 Behaviour of NH3 in the presence of DCOOD ... 39
3.3.2 Effects of NH3 on Water (D2O, DHO and H2O) Production ... 42
3.3.3 Effects of NH3 on CO2 Production ... 43
3.3.4 Effects of NH3 on D2 Production ... 47
3.3.5 Effects of NH3 on DH and H2 Production ... 51
3.3.6 Effects of NH3 on CO Production ... 51
4.
Effects of MnO
xModel Lewis Base on Formic Acid
Dehydrogenation Selectivity of Pd(111) Single Crystal Model
Catalyst
55
4.1 Determination of Mn Coverage on Pd(111) Surface ... 564.2 Adsorption of DCOOD on Pd(111) ... 56
4.3 Effects of MnOx on D2 formation ... 58
4.4 Effects of MnOx deposition on Formic Acid Decomposition ... 66
4.5 Effects of MnOx Coverage on D2 formation ... 68
5. Conclusion
71
A.
Alternative Interpretation of Mn 2p3/2 XPS spectra given in Figures 4.5 and 4.9 ... 82B.
Difference (Δ) XPS spectra of Mn 2p3/2 XPS spectra represented in Figures 4.5 and 4.9 ... 84C.
List of Publications ... 85List of Figures
1.1 Possible absorption geometries formed by carboxylic acids on transition metal surfaces. Adapted from Ref. [54] ... 51.2 Various oligomers/polymers generated upon formic acid adsorption on Ag(111) single crystal surface. Adapted from Ref. [43] ... 6
x
1.3 Different adsorption geometries of CO on Pd(111) surface. Adapted
from Ref. [59] ... 7
1.4 Schematic representation of formic acid adsorption on MnOx surface ... 9
1.5 TEM image of Rh/CeO2. Adapted from Ref. [68] ... 10
2.1 Photographs of the experimental setup ... 13
2.2 Plot of electron inelastic mean free path (IMFP) values of various materials as a function of electron kinetic energy. (The “universal curve”) Adapted from Ref. [70] ... 14
2.3 Schematic representation of a LEED experiment. (a1,a2) are unit cell vectors and (a1*,a2*) are the corresponding momentum space vectors. Adapted from Ref. [71] ... 15
2.4 (a) Sample LEED diffraction pattern obtained on a phosphorescence screen. (b) Schematic of a LEED setup. Adapted from Ref. [72] ... 16
2.5 (a) Schematic of the dual anode X-Ray source used in this work. Adapted from Ref [74]. (b) Schematic of the double-pass cylindrical mirror energy analyzer used in this work. Adapted from Ref [75]. (c) Schematic of a hemispherical energy analyzer Adapted from Ref [76] ... 18
2.6 Sample TPD spectra obtained for (a) zeroth order (b) first order (c) second order desorption kinetics as a function of increasing adsorbate coverage. Adapted from Ref. [69] ... 21
2.7 Schematic of a TPD/TPRS module that is used for UHV surface science applications. Adapted from Ref. [70] ... 23
2.8 (a) XPS Survey Spectrum obtained from clean Pd(111). (b) m/z = 28 (CO) TPD profile obtained from blank TPD obtained from clean Pd(111) ...25
xi
2.9 (a) DCOOD RGA obtained at 298K and PDCOOD= 5.5x10⁻⁸ Torr. (b) Background RGA spectrum of the UHV chamber obtained at 298K ... 26 2.10 (a) Pd3d XPS spectrum of clean Pd(111) ... 27 2.11 (a) LEED pattern of unclean Pd(111) surface (b) LEED pattern of clean
Pd(111) surface ... 28 2.12 (a) Top-view of custom-made evaporators. It should be noted that
different Mn-evaporators are labelled as 1, 2, and 3; (b) Side-view of the custom-made Mn evaporators. (c) Thin film doser compartment of the UHV setup ... 29
3.1 Schematic illustration of the enhancement in FA dehydrogenation over
Pd(111) single crystal model catalyst surface upon NH3
functionalization ... 31
3.2 m/z = 2 (H2) and m/z = 28 (N2) TPD profiles that were obtained after
NH3 adsorption on clean Pd(111) at 90 K as a function of increasing NH3
coverage ... 32 3.3 TPD profiles (m/z = 17) obtained after adsorption of NH3 at 90 K on
clean Pd(111) as a function of increasing ammonia coverage ... 33
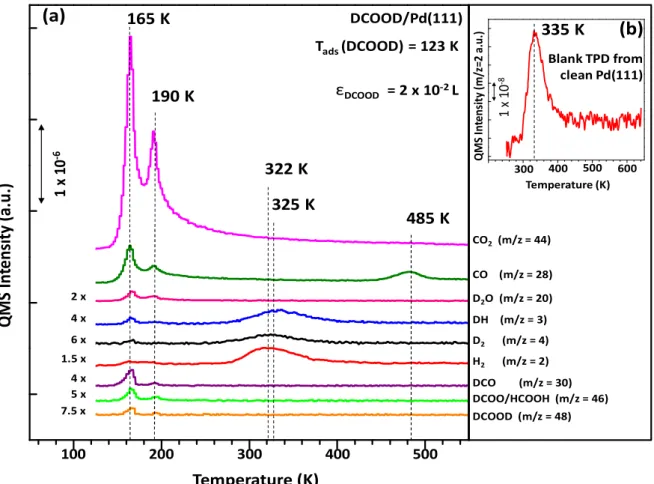
3.4 (a) TPD profiles of DCOOD adsorption on clean Pd (111) with a
DCOOD exposure of ε (DCOOD) = 2×10⁻² L at 123 K. Note that some of
the TPD signals are multiplied with the given factors for clarity. (b) m/z = 2 desorption channel from a blank (control) TPD experiment on a freshly cleaned Pd(111) surface in the absence of any intentionally added adsorbates ... 36
3.5 Schematic representation of formation and decarboxylation of bidentate
formate species on Pd(111). Note that this illustration does not account for the actual stoichiometry of formate formation from FA ... 38
xii
3.6 TPRS profiles for DCOOD adsorption (ε (DCOOD) = 2×10⁻² L at 90 K) on
Pd (111) which was initially exposed to (a) 0.1, (b) 0.4, (c) 0.8, (d), 1.0, (e) 1.4 MLE of NH3 ... 41
3.7 TPRS profiles for DCOOD (ε (DCOOD) = 2×10⁻² L at 90 K) adsorption on
Pd (111) which was initially exposed to various coverages of NH3: m/z = (a) 20, (b) 19, (c) 18 desorption channels. (d) Corresponding integrated TPRS signal intensities for m/z = 20 (D2O) channel ... 42
3.8 (a) TPRS profiles for CO2 (m/z = 44) production upon DCOOD
adsorption (ε (DCOOD) = 2×10⁻² L at 90 K) on Pd (111) which was initially
exposed to various coverages of NH3. (b) Corresponding integrated TPRS signal intensities for m/z = 44 channel ... 44
3.9 Schematic representation of [NH4]+-[HCOO]- formation and
decarboxylation on ammonium formate on NH3 functionalized Pd(111)
surface. Note that this illustration does not account for the actual reaction stoichiometry ... 45 3.10 TPRS profiles of m/z = 46 (DCOO/HCOOH) channel for DCOOD
adsorption (ε (DCOOD) = 2×10⁻² L at 90 K) on Pd(111) which was initially
exposed to (green) 0.8, (navy) 1, and (pink) 1.4 MLE of NH3. The orange curve represents the TPD profile obtained from the DCOOD adsorption (ε (DCOOD) = 2×10⁻² L at 123 K) on clean Pd(111) ... 46
3.11 TPRS profiles for DCOOD adsorption (ε (DCOOD) = 2×10⁻² L at 90 K) on
Pd (111) which was initially exposed to various coverages of NH3: m/z = (a) 4 (D2), (b) 3 (DH), (c) 2 (H2) desorption channels ... 48 3.12 Integrated m/z = (a) 4 (D2), (b) 3 (DH), (c) 2 (H2) TPRS desorption
signals for DCOOD adsorption (ε (DCOOD) = 2×10⁻² L at 90 K) on Pd (111)
xiii
3.13 Schematic representation of FA dehydrogenation on NH3 functionalized
Pd(111) surface. Note that this reaction does not account for actual reaction stoichiometry ... 50 3.14 Integrated m/z = 28 (CO) TPRS desorption signals for DCOOD
adsorption (ε (DCOOD) = 2×10⁻² L at 90 K) on Pd (111) which was initially
exposed to various coverages of NH3 at 90 K ... 52 3.15 (a) DCOOD adsorption (ε (DCOOD) = 2×10⁻² L at 90 K) on Pd (111) which
was initially exposed to 1.4 MLE of NH3: m/z = 28, 16, 43, 45 desorption channels. (b) Comparison of m/z = 45 TPD desorption channels of HCOOH/Pd(111) with the m/z = 45 desorption channel of DCOOD/Pd(111) TPRS in the absence of 1.4 MLE NH3 ... 53
4.1 Schematic representation of the enhancement of FA dehydrogenation on
various MnOx/Pd(111) model catalyst surfaces. Note that this illustration does not account for the actual reaction stoichiometry ... 55 4.2 Mn 2p3/2 / Pd3d intensity ratio as a function of Mn deposition time... 56
4.3 TPD profiles of DCOOD adsorption on clean Pd(111). some of the TPD
signals are multiplied by the given factors for clarity ... 57 4.4 TPD profiles obtained upon εDCOOD = 4×10⁻³ L DCOOD exposure on
clean Pd(111) at 123 K. It should be noted that m/z = 4 (D2) desorption signal is not clearly discernible in this low coverage regime ... 58 4.5 (a) Evolution of m/z = 4 (D2) TPD profiles on MnOx/Pd(111) as a
function of reaction runs. Before each run, a fresh DCOOD was
introduced at 123 K with a constant exposure of ε (DCOOD) = 8×10⁻³
L. Mn 2p3/2 XPS spectra obtained (b) before run 1, (c) after run 1, and (d) after run 2 ... 60 4.6 Change of m/z = 4 (D2) channel as a function of reaction runs ... 61
xiv
4.7 Change of m/z = 4 (D2) desorption signals as a function of reaction runs at various MnOx coverages ... 63 4.8 (a) Change of m/z = 4 (D2) desorption signals as a function of reaction
runs on pre-annealed MnOx. Note that red curve belongs to the reference D2 signal (b) Integrated QMS Intensities of m/z =4 (D2) signals given in a. (c) Mn 2p3/2 XPS spectrum of MnOx after annealing ... 64
4.9 (a) Change of m/z = 4 (D2) TPD profiles on pre-oxidized MnOx/Pd(111)
as a function of reaction runs. At each run a fresh DCOOD was adsorbed at 123K with a constant exposure of ε (DCOOD) = 8×10⁻³ L. Some TPRS signals are multiplied with the given factors for clarity. Mn 2p3/2 XPS spectrum obtained (b) before run 1, (c) after run 1, and (d) after run 2 ... 65 4.10 TPD Profiles obtained on multilayer MnOx deposited Pd(111) ... 65
4.11 TPD profiles obtained upon a DCOOD exposure of 8 x 10⁻³ L at 123 K
on (a) MnOx (0.25 ML)/Pd(111) after three reaction runs, (b)
pre-oxidized MnOx(0.25 ML)/Pd(111). Some of the desorption signals are
multiplied with the given factors for better visualization of the data ... 66 4.12 Integrated TPD intensities of various QMS channels as a function of
manganese coverage ... 69 4.13 TPD profiles that are given in their integrated form in Figure 4 ... 69 4.14 Change of m/z = 4 (D2) channel as a function reaction runs on
pre-oxidized MnOx /Pd(111) ... 70 E.1 Alternative interpretation of Mn 2p3/2 spectra given in Figure 4.5 ... 82 E.2 Alternative interpretation of Mn 2p3/2 spectra given in Figure 4.9 ... 83
xv
E.3 (a) Difference (Δ) XPS intensity spectra of Mn 2p3/2 XPS spectra represented in Figure 4.5. (b) Difference (Δ) XPS intensity spectra of Mn 2p3/2 XPS spectra represented in Figure 4.9 ... 84
List of Tables
1.1 Specific energies and energy densities of various commercially available
fuels. Adapted from Ref. [6] ... 2 3.1 Integration temperature intervals for TPD/TPRS histograms given in
Figure 3.7d, 3.8a, 3.12, 3.14 ... 52
4.1 Integration Temperature Intervals of TPD Profiles that are given in
1
CHAPTER 1
Introduction
1.1 Future and Sustainability of the Global Energy Demand and
Environment
80% of the global energy demand is supplied by fossil fuels such as coal, natural gas and petroleum [1]. Therefore, the nature of the global energy supply chain leads to consumption of large amount of fossil fuels, which in return causes many environmental problems such as increased CO2 emissions and acid rains [2, 3]. However, this alarmingly large fossil fuel consumption might even double in the future, as the global energy demand is forecasted to more than double by 2050 as a consequence of the rapid growth in world population and global economy [4, 5]. Consequently, utilization of alternative fuel sources is a compulsory task for the sustainability of the energy demand, economy and ultimately the environment.
1.2 Hydrogen as an Alternative Fuel Source
Hydrogen is one of the most promising alternative energy sources since it has a very high specific energy (33.3 KWh/Kg) compared to many other fuel sources (See Table 1.1) [6]. Besides, hydrogen can be used in fuel cell applications which are eco-friendly and efficient [7]. However, one of the major drawbacks of the current hydrogen-based energy applications is the fuel storage. Since gaseous hydrogen has a very low mass density (0.089 kg/m3 at STP), storing hydrogen in gaseous form creates numerous ergonomic challenges and safety risks [8]. A variety of hydrogen storage and delivery materials were proposed in order to tackle these problems but most of them failed due to their low hydrogen generation capacity and hindered hydrogen generation kinetics [9].
2
Fuel
Specific Energy
(KWh/Kg)
Energy Density
(KWh/m
3)
Liquid Hydrogen
33.3
2.37
H2 (g) (200 bar)
33.3
0.53
Liquid Natural Gas
13.9
5.6
Natural Gas (200 bar)
13.9
2.3
Petroleum
12.8
9.5
Diesel12.6
10.6
Coal8.2
7.6
NH3BH36.5
5.5
Methanol5.5
4.4
Wood4.2
3.0
Table 1.1 Specific energies and energy densities of various commercially
available fuels. Adapted from Ref. [6].
1.3 Formic Acid as a Potential Hydrogen Source
Formic acid (FA) is one of the highly investigated hydrogen carriers since i) it has a relatively high hydrogen density (4% w/w), ii) it is in liquid form under ambient conditions (which makes it easy to store), and iii) it has low toxicity and flammability [10, 11]. Another advantage of FA is that it can be obtained from various naturally abundant resources, such as CO2 [12, 13] and biomass feedstocks [14]. These properties of FA make it an auspicious energy carrier for hydrogen-based energy applications.
3
Catalytic decomposition of FA yields two competing pathways named as dehydrogenation (1) and dehydration (2). The dehydrogenation pathway (1) allows hydrogen
generation since it decomposes FA into H2 and CO2; whereas dehydration (2) decomposes FA
into H2O and CO. Since dehydration (2) does not yield any hydrogen, catalytic selectivity towards dehydrogenation is determined by the prevalence of dehydrogenation pathway over dehydration. Besides, CO formed by dehydration of FA binds to catalytically active sites of precious metals (e.g. Pd, Pt etc.) in a robust and an irreversible manner under ambient conditions [15-18] causing catalytic poisoning via permanent site-blocking [8]. Therefore, presence of two competing catalytic decomposition pathways (1,2) makes hydrogen generation from FA a challenging task in spite of its desirable properties.
Pathway (1): HCOOH → H2 + CO2 , ΔG˚298K = -33.0 kJ.mol-1 (1)
Pathway (2): HCOOH → CO + H2O , ΔG˚298K = -13.0 kJ.mol-1 (2)
1.4 A Literature Review on Formic Acid Dehydrogenation Catalysts
In the literature, it has been shown that it is possible to obtain high FA dehydrogenation
selectivity by using homogeneous catalysts such as [RuH2(PPh3)3CO] [19],
Fe(BF4)2[P(CH2CH2PPh2)3] [20] and [Ru2H(μ-H)(μ-CO)(CO)2(μ-dppm)2] [21, 22]. However, these homogenous catalyst systems suffer from tedious catalyst synthesis procedures as well as necessity of utilization of a liquid (solvent) reaction medium [23, 24], which creates additional environmental, ergonomic and cost efficiency problems.
On the other hand, FA decomposition has also been extensively studied on several heterogeneous catalytic systems containing group-VIII transition metal surfaces including Pd [8, 25-29], Rh [30-32], Ru [33, 34], Pt [35-37], Cu [38-40], Co[41], Ag[42, 43] as well as
Pd-Ag[44] Pd-Au[45] bimetallic systems under ultra-high vacuum (UHV) conditions. These
4
surfaces, such as (100) and (110) surfaces of metals that adopt face-centered-cubic (FCC) crystal structure and have planar density ca. 1013-1014 atoms/cm2, cannot carry out the FA dehydrogenation selectively. For instance, it was reported that Pd(100) unselectively decomposed FA, where decomposition products were CO and H2 [26, 27, 29]. In addition, Barteau et al. reported that clean Ag(110) surface did not even react with FA [42]. In agreement with these observations, various other experimental studies reported that many coordinatively saturated late transition metal surfaces (e.g. (111) surface of FCC metals which has a planar density of ~2x10¹⁵ atoms/cm2) were able to carry out FA dehydrogenation effectively [25, 32, 35]. Moreover, these findings were also theoretically verified by Jin et al., where they compared FA dehydrogenation reactivities of Pd(111) vs. Pd(100) and reported Pd(111) as the better FA dehydrogenation model catalyst [46]. Besides UHV and DFT studies focusing on two dimensional planar model catalyst surfaces, numerous high surface area mesoporous powder catalysts such as PdNiAg/C [47], Ag/N-rGO, PdAg/N-rGO[48] , Pd-Au/C, Pd-Ag/C [49], graphene supported AuAgPd [50] and as well as Ag-Pd [51-53] Pd-Au [24] core/shell catalysts containing various transition metal active sites have also been explored and demonstrated high activity and selectivity towards FA dehydrogenation.
1.5 Key Aspects of Formic Acid Decomposition on Heterogeneous Catalysts
1.5.1 Effects of Coordination Number of the Catalyst Surface and
Adsorption Geometry of Formic acid on Dehydrogenation Selectivity
Figure 1.1 shows the possible adsorption geometries of various carboxylic acids on transition metal surfaces. In particular, two main adsorption geometries were reported for FA. Various experimental [25, 32, 33, 35] and theoretical studies [54-56] revealed that formic acid prefers to attain bidentate configuration (C2v symmetry) on coordinatively saturated group-VIII transition metal surfaces. Contrary to this observation, it has been shown that FA adopts a
5
monodentate configuration (C1 symmetry) on coordinatively unsaturated Pd(100) surface [26,
27, 29]. These results revealed the importance of adsorption geometry of the decomposition intermediate as well.
Figure 1.1. Possible absorption geometries formed by carboxylic acids on
transition metal surfaces. Adapted from Ref. [57].
For instance, the same studies showed that transition metal surfaces that allow formation of bidentate formate [25, 32, 33, 35] reveal a higher selectivity towards dehydrogenation compared to the metal surfaces that are mainly capable of hosting monodentate formate species [26, 27, 29]. As a result, these studies indicate that;
i) Adsorption geometry of FA and its catalytic decomposition intermediates
significantly affect the dehydrogenation selectivity.
ii) Coordination number of the catalyst surface strongly affects the adsorption geometry of FA and its catalytic decomposition intermediates.
6
iii) Coordinatively saturated transition metal catalyst surfaces are superior in terms of hosting/stabilizing the FA decomposition intermediate (i.e. formate) and thus have a higher selectivity towards FA dehydrogenation.
Figure 1.2. Various oligomers/polymers generated upon formic acid adsorption
on Ag(111) single crystal surface. Adapted from Ref. [43].
Formic acid is also known to polymerize upon its adsorption on transition metal surfaces. For instance, it has been shown that formic acid forms catemeric structures, i.e. oligomeric/polymeric FA units with β-polymer structure (see Figure 1.2), on Pd(111) [25] and Rh(111) [32] surfaces. It has been also reported that FA can polymerize in four different ways on Ag(111) surface [43] , as can be seen from Figure 1.2. However, it should be emphasized that the effects of polymerization of FA units on FA dehydrogenation selectivity did not attract too much attention in the literature.
7
1.5.2 Relationship between Catalyst Life Span and Dehydrogenation
Selectivity
Figure 1.3. Different adsorption geometries of CO on Pd(111) surface. Adapted
from Ref. [58].
As mentioned previously, FA dehydration causes formation of significant amounts of carbon monoxide. CO formation is particularly important for the catalyst life span since carbon monoxide irreversibly binds to the active sites of various transition metal surfaces under ambient conditions [15-18]. Transition metal surfaces can host stable CO species on their surfaces as a result of the strong synergy between CO and the surface metal atoms. Three of the most commonly observed CO adsorption geometries on transition metal surfaces are given in Figure 1.3. First of these stable species is called ‘atop/ontop/linear CO‘, where a CO molecule is bound to a single metal atom. Second species is called ‘bridging CO’, where a CO molecule is coordinated to two adjacent metal atoms. Lastly, a CO molecule that is coordinated to three different metal atoms is called ‘3 fold-adsorbed CO’. Presence of different stable CO adsorption geometries suggests that a single CO can block/poison up to 3 surface atoms and significantly limit both the catalyst life-time and performance.
1.6 Effects of Brønsted and Lewis Bases on Formic Acid Dehydrogenation
Selectivity of Heterogeneous Catalysts
8
Pd is among the most active catalytic metals which is capable of generating ultra-high
purity H2 from biomass side-products such as formic acid [53, 59, 60].These heterogeneous
catalytic systems are frequently coupled with additional bases which can act as catalytic promoters and facilitate the catalytic FA decomposition [8, 61]. Similarly, catalytic sites/promoters/support surfaces are also usually functionalized with bases in order to achieve a higher catalytic H2 production selectivity.
In the literature, it has been shown that Lewis bases, i.e. substances that can donate a pair of non-bonding electrons, can significantly enhance the performance of FA dehydrogenation catalysts. For instance, it has been reported that creating Lewis basic oxygen species on coordinatively saturated group-VIII transition metal surfaces;
i) hinders FA polymerization on the surface
ii) enhances FA dehydrogenation selectivity by increasing the formate stability
under UHV conditions [25, 32, 35]. In accordance with these observations, it has been also reported that high surface area Pd-Ag [59] and Pd-Au [62] bimetallic nanoparticles (NP) which are promoted with MnOx (i.e. a reducible oxide which contains Lewis basic sites) yielded an
extremely high FA dehydrogenation activity, where MnOx domains reported to i) increase FA
adsorption on the catalyst surface through the formation of new FA adsorption sites, ii) facilitating FA deprotonation, iii) stabilize the formate species on the catalyst surface, and iv) capture/store the catalytically generated CO(g) side product in the form of carbonates and prevent CO-poisoning of the Pd active sites on which formate species are converted into the ultimately desired catalytic product, H2. On the other hand, it was also reported that Brønsted bases, i.e. substances that are proton (H+) acceptors, can also notably enhance the FA dehydrogenation selectivity. For example, it has been shown that amine functionalization (Brønsted base) caused an extra boost in H2 + CO2 production of Pd-Ag/MnOx catalyst [59]. Similar to this observation, Mori and his co-workers also showed that Pd-Ag catalyst embedded
9
inside a -N(CH3)2 (Brønsted base) functionalized polymer matrix had a significantly higher H2 conversion compared to other Pd-Ag NP embedded in matrices with different functional groups, where -N(CH3)2 is reported to enhance hydrogen formation via facilitating FA deprotonation [63]. It should be emphasized that positive effect of Brønsted bases on FA dehydrogenation is not unique for only Pd based catalysts. For example, Yadav et al. showed that presence of amine (-NH2) groups grafted on the support material can turn Au NPs, which are relatively inactive in FA dehydrogenation, into significantly active FA dehydrogenation catalysts via enhancing the FA adsorption through a process called “Strong Metal-Molecular Support Interaction” (SMMSI) [64]. These studies clearly indicate that Brønsted and Lewis acid/base chemistry can be successfully used in order to improve hydrogen production from FA.
C
Mn
O
O
O
Mn
O
O
O
Mn
O
O
Mn
O
O
O
O
H
H
Figure 1.4. Schematic representation of formic acid adsorption on MnOx surface. Note that this illustration does not account for any of the actual MnOx lattice structures.
1.7 Motivation of the Current Study
Most of the commercially available heterogeneous catalysts consists of metallic NPs along with the support material. Usually the main goal behind coupling the catalytically active metal(s) with a support material is to have robust mechanical properties allowing catalyst to be
10
used in successive reaction cycles. Moreover, support materials can also significantly improve the catalytic activity since they can enhance the dispersion of catalytically active metals on the surface and form metal-support interface with unique electronic properties. For instance, it has
been shown that TiO2 support material significantly enhances Au NPs CO oxidation activity
by increasing Au NPs CO adsorption properties via donating electrons to Au NPs from their oxygen vacancies at the metal-support interface [65, 66]. On the other hand, presence of catalyst support makes the catalyst structure very complex and thus creates significant problems in terms of achieving molecular-level fundamental information regarding structure-catalytic reactivity relationships.
Planar Rh facet Planar
CeO2step
facets
Figure 1.5. TEM image of Rh/CeO2. Adapted from Ref. [67].
Figure 1.5 represents a high-resolution TEM image of a dry glycerol reforming Rh/CeO2 NP catalyst [67]. This image clearly shows that both Rh active site and CeO2 support material expose ordered surfaces, i.e. planar Rh facets and planar CeO2 step facets, where surface parameters of this facets are governed by the surface energy of the NPs. Therefore, this
11
particular example demonstrates that complex chemical structures of NP catalysts can be broken down into 2D-facets with known surface parameters. In this aspect, atomically well-defined 2D-model catalysts are very useful tools for obtaining information about structure-catalytic reactivity relationships since they can be used to model structure-catalytic properties of certain facets of real NP catalysts. However, well-defined single crystal planar model catalysts can only be used in ultra-high vacuum (UHV) conditions since surface structures of these well-defined catalysts often deteriorate/reconstruct upon adsorption of gases at elevated pressures close to atmospheric pressures [68].
Currently, literature lacks detailed molecular-level understanding in terms of effects of Brønsted and Lewis bases on the FA dehydrogenation ability of atomically well-defined transition metal single crystal surfaces. Therefore, this presented dissertation work focuses on the effects of NH3 (a Brønsted base) and MnOx (a reducible metal oxide possessing Lewis basic oxide/O2- ions) on FA dehydrogenation ability of Pd(111) single crystal model catalyst under UHV conditions in order to probe explicit structure-reactivity relationships. In this work, Pd(111) was chosen as the model catalyst since i) Pd metal is one of the most active FA dehydrogenation catalysts [53, 59, 60] and ii) Pd (111) is the most active facet of Pd for FA
dehydrogenation [25, 46, 55]. Moreover, NH3 and MnOx were chosen as model Brønsted and
Lewis bases respectively due to their exceptionally positive influence on FA dehydrogenation [59, 62-64]. Results represented in this dissertation reveal valuable molecular level information about the influence of Brønsted and Lewis bases on catalytic FA dehydrogenation reactions.
12
CHAPTER 2
Experimental
2.1 Experimental Setup
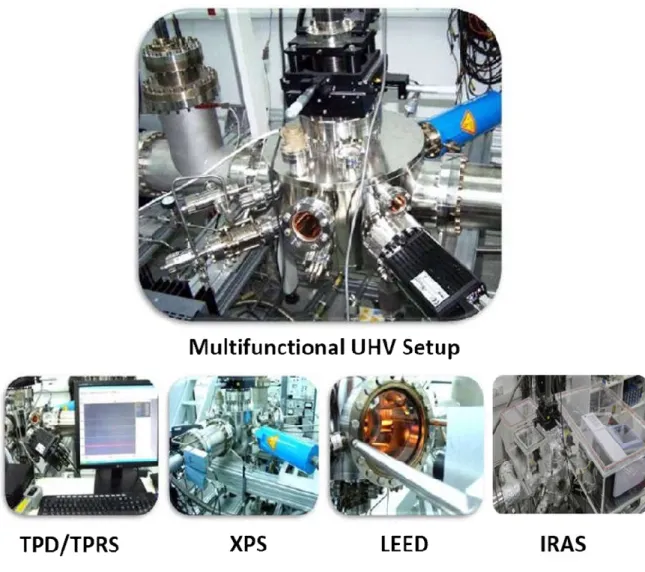
Figure 2.1 represents the photograph of the experimental setup that was used to conduct this study. This setup has a base pressure of 1×10⁻¹⁰ Torr and this ultra-high vacuum environment is obtained via a turbomolecular pump (Varian, TV 551 Navigator, with a pumping speed of 550 L/s) that is coupled to an oil-free scroll pump (Agilent Varian SH-110). Besides, the UHV chamber is equipped with an X-ray Photoemission Spectroscopy (XPS) setup, a custom-made Low Energy Electron Diffraction (LEED) setup, a custom-made Infrared Reflection Absorption Spectroscopy setup (IRAS), temperature programed desorption (TPD) and temperature programmed reaction spectroscopy (TPRS) modules, custom-made manganese (Mn) thin film evaporators and an Ar+ sputtering ion gun (LK Technologies, NGI3000) which is used for surface cleaning purposes. Moreover, chamber also contains three separate gas dosing lines equipped with separate high precision leak valves, where each of these lines were allocated for a specific adsorbate. Besides, the setup contains a titanium sublimation pump (TSP) (Varian, Model 916-0017) which facilitates the removal of sticky gases (e.g. H2O) or gases with low compression factor (e.g. H2)from the UHV chamber. Currently used Pd(111) single crystal sample (10 mm-diameter × 1 mm-thickness disc, polished on both side, purity > 99.999%, MaTeck GmbH) was affixed on Ta wires which allowed cooling of the sample with liquid nitrogen to 90 K and heating it up to 1073 K via resistive heating. The temperature of the sample was measured by using a K-type thermocouple (thickness: 0.005 in., Omega Inc.) which is spot-welded on the upper side of the Pd(111) disc.
13
Figure 2.1. Photographs of the UHV experimental setup.
2.2 Surface Characterization Techniques
The work presented in this thesis was performed by using multiple surface characterization techniques. In this study, LEED was used to obtain surface-sensitive crystallographic information about the single crystal model catalyst. In addition, XPS was used in order to make surface-sensitive elemental/oxidation state analysis and quantifiy the coverage
of MnOx thin films on Pd(111) prepared via thermal evaporation method. TPD/TPRS
techniques were used in order to quantify the adsorbate coverages and determine reaction products, providing mechanistic information about the FA dehydrogenation reactions. Some of
14
the fundamental aspects of the currenlty utilized experimental techniques are given in the following sections.
2.3 Low Energy Electron Diffraction (LEED)
Low energy electron diffraction (LEED) is a unique technique that is used for determining the surface structures of single crystals and well-defined adsorbate overlayers [69]. LEED makes use of low energy electrons ( 25-200 eV range) since outermost layer of a metal, i.e the surface, can only be selectively probed by using electrons with low kinetic energies, as can be seen from Figure 2.2.
Figure 2.2. Plot of electron inelastic mean free path (IMFP) values of various
materials as a function of electron kinetic energy. (The “universal curve”) Adapted from Ref. [69].
In this technique, the sample of interest is bombarded by low energy electrons and this bombardment causes electrons to elestically scatter from the surface. Then these elastically scattered electrons are accelarated towards a phosphoresence screen. During the this scattering
15
process, crystallinity/order of the surface allows elastically scattered electrons to have constructive intereference. The constructive interference process is governed by 2D-Bragg conditon given below, where n corresponds to the diffraction order, λ corresponds to the wavelenght of the electrons, d is the surface lattice parameter and θ is the angle of diffraction of electrons with respect to the surface normal.
= ( ) (2.1)
The constructive interference of elastically scattered electrons is observed as a diffraction pattern on the phophoresence screen (See Figure 2.4a) and this pattern gives information about the surface crystal structure. It should be noted that LEED diffraction patterns reveal information in the momentum space (k-space/reciprocal space) of the elastically scattered electrons. Therefore, obtained diffraction patterns does not directly correspond to the real space positions of the atoms on the surface. On the other hand, the Pontryagin duality [70] between the k-space and the real space allows translation of reciprocal space information into real space information by relatively simple linear algebraic vectoral operations. A simple representation of the relationship between the momentum and the real vector spaces can be found in Figure 2.3 [71].
Figure 2.3 Schematic representation of a LEED experiment. (a1, a2) are unit cell vectors and (a1*, a2*) are the corresponding momentum space vectors. Adapted from Ref. [71].
16
As can be seen from Figure 2.4b, a LEED setup has three main components. The electron gun generates electrons via thermionic emission and generated electrons are accelerated towards the sample. In general, a negative potential is applied on the retarding grids shown in Figure 2.4b since they are used for filtering out the inelastically scattered electrons from the surface in order to achieve more clear diffraction patterns and eliminate background illumination in the LEED images. Lastly, a positively biased luminescent screen (5.14 kV in the current work) collects the remaining elastically scattered electrons from the surface and generates spots on the screen that corresponds to the diffraction pattern obtained from the surface.
Figure 2.4. (a) Sample LEED diffraction pattern obtained on a phosphorescence
screen. (b) Schematic of a LEED setup. Adapted from Ref. [72].
In the current work, LEED measuremets were done by using electrons with ~70 eV energy since these electrons can selectively probe the sample surface and wavelength of these electrons (ca. 15 nm) are also sufficient enough to resolve the lattice parameter of Pd surface atoms and give information about the surface crystal structure.
17
2.4 X-Ray Photoelectron Spectroscopy (XPS)
X-Ray Photoelectron Spectroscopy (XPS) is technique that is used for elemental and
oxidation state analysis. The basis of this technique is the photoelectric effect, where core level
electrons are ejected from a solid material as a result of the X-Ray irradiation [69]. In summary, in an XPS measurement, X-Ray photons with energy hv is absorbed by a core electron with a
certain binding energy (BE). Thus, kinetic energy (KE) of an ejected electron can be calculated
from Equation 2.2, where the work function of the spectrometer is denoted with ϕ.
= ℎ − – (2.2)
The electrons that are emitted from the sample surface as a result of this process is called as ‘photoelectrons’ and the kinetic energy of these electrons typically range within 0-1.1 keV [73]. Consequently, the kinetic energy range of photoelectrons makes XPS a surface sensitive technique since IMFP of electrons is less than 2 nm between 100 eV - 1.1 keV energy range, as can be seen in Figure 2.2.
XPS signals are labelled based on the total angular momentum quantum number (j) of the ejected photoelectrons that is given in Equation 2.3.
= + , ≥ 0 (2.3) As can be seen from Equation 2.3, total angular momentum quantum number is the summation of the angular momentum quantum number (l) and spin quantum (s) of an electron. Since s can only be either 1/2 or –1/2, a single photoelectron will generate two different signals at every energy level when l > 1. For instance, photoelectrons ejected from Pd3d level will have two different signals labelled as Pd 3d5/2 and Pd3/2 (see Figure 2.10), this is also referred as spin-orbit coupling [69].
As can be seen from Figure 2.5, a basic XPS setup consists of two main components, namely the X-Ray source and the photoelectron energy analyzer. In the current work, the used
18
X-Ray source had a dual anode configuration (Riber Model CX 700, see Figure 2.5a) which consisted of Mg (hv = 1253.6 eV, full width half maximum, (FHWM) = 0.70 eV) and Al (hv = 1486.6 eV, FHWM = 0.85) anodes. In this anode configuration, anode materials were coated on a cupper surface since the high thermal conductivity of cupper allows anodes to be cooled via water cooling. Besides, the X-Ray source contained two tungsten filaments that are in close proximity with Mg and Al anodes and these filaments provided the electrons for X-Ray generation via thermionic emission. During all XPS measurements, X-Rays were generated by applying 250 W power on the Mg anode (Anode voltage = 10 kV, Filament emission current = 25 mA).
Two different types of energy analyzers used in XPS spectrometers are given in Figures 2.5b and 2.5c.
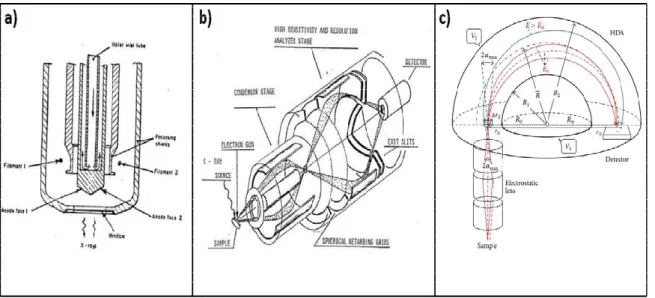
Figure 2.5. (a) Schematic of the dual anode X-Ray source used in this work.
Adapted from Ref [74]. (b) Schematic of the double-pass cylindrical mirror energy analyzer used in this work. Adapted from Ref. [75]. (c) Schematic of a hemispherical energy analyzer Adapted from Ref. [76].
The energy analyzer that is given in Figure 2.5b is called as double-pass cylindrical mirror energy analyzer (CMA) and this type of energy analyzer (Riber EA 150) is present in our current XPS configuration. CMA has two stages as can be seen from Figure 2.5b. In the
19
first stage, photoelectrons are focused to the entrance slit of the analyzer, where this process provides some tolerance for the sample alignment (~3 mm). At the second stage, previously focused photoelectrons are slowed down by the negatively biased spherical retarding grids. As a result of this retardation, electrons that are only in a certain energy range can pass-through the second stage and reach the electron multiplier. Therefore, the energy resolution depends on the potential difference between the initial stage and the spherical retarding grids (F1). Consequently, CMA acts as a band pass filter. In the current work, F1 is optimized as 27 V for a survey scan and 7 V for a region scan. On the other hand, the voltage that is used for focusing the photoelectrons towards the electron multiplier (F2) is optimized as 50 V for survey scan and 25 V for region scan.
The hemispherical energy analyzer given in Figure 2.5c (HMA) is commonly used in modern XPS devices. It works by applying a potential difference on the photoelectrons coming from the surface and bending their trajectories. Since photoelectrons with higher kinetic energies will have a longer flight time compared to the lower energy photoelectrons, they will hit a further point on the detector plane. As a result, HMA resolves photoelectron kinetic energies by making the use of different trajectories followed by the photoelectrons. Consequently, HMA has a better energy resolution compared to CMA.
2.5
Temperature
Programmed
Desorption/Reaction
Spectroscopy
(TPD/TPRS)
Temperature programmed desorption (TPD) is a charcterization technique that is used for obtaining information about the desorption processes occuring on particular adsorbent/substrate systems. In cases where more than one adsorbate are present on the substrate surface or in the existence of a thermally induced chemical reaction, TPD technique is also refered as temperature programmed reaction spectroscopy (TPRS). In these techniques,
20
at first, gas phase atoms/molecules are adsorbed on a substrace surface at a specific adsorption temperature. Then, substrate is heated via a linear temperature ramp while the desorbed species are simultatenously monitored by a mass spectrometer. In an environemnt where pumping speed is sufficient, shapes of the partial pressure curves that are obtained from the TPD experiments give information about the kinetic and thermodynamics of adsorption [77].
In a TPD experiment, the rate of desorption can be mathematically expressed by using the Polanyi-Wigner equation given in Equation 2.6 [78].
= − = (2.4)
= + , = (2.5)
= − = = − = = ( ) (2.6)
Where r is the desorption rate, θ is the adsorbate coverage, m is the order of desorption, t is the time, kdes is the rate constant of desorption, A is the pre-exponential factor, Edes is the
desorption energy, R is the universal gas constant, T is the temperature, To is the initial
adsorption temperature and β is the linear heating rate. Equation 2.6 predicts that desorption process occurs only at particular temperatures since the magnitude of temperature should be high enough to overcome Edes so that the desorption process can take place. Besides,
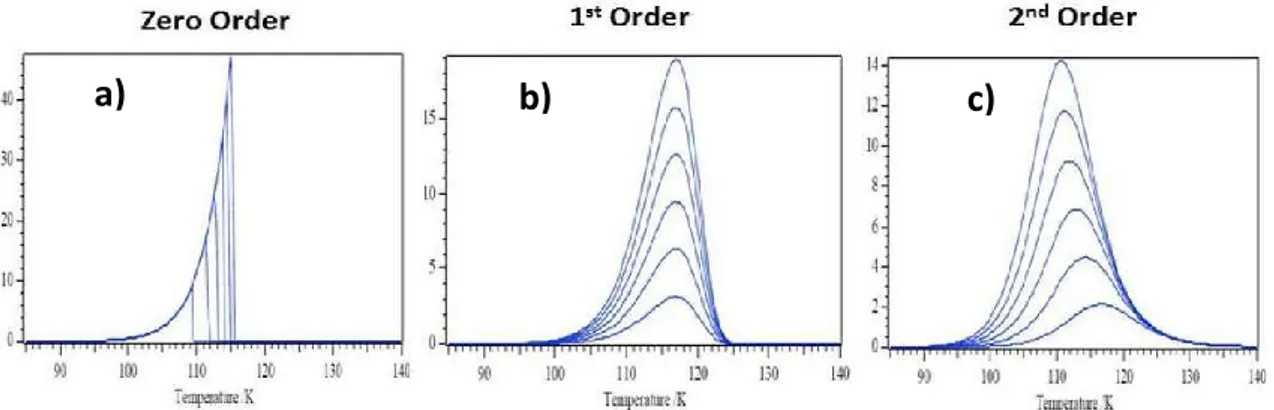
Polanyi-Wigner equation also indicates that adsorbates with different desorption orders will yield desorption curves with different shapes. The three most commonly observed desorption orders and their corresponding desorption curves are given in Figure 2.6. A zeroth order desorption (m = 0) means that desorption rate is independent of adsorbate coverage. Consequently, the zeroth order desorption is obtained in a regime where there is an excess supply of adsorbates on the substrace surface. Figure 2.6a shows how increasing the coverage affects the zeroth order desorption process. As can be seen from Figure 2.6a, increasing the coverage does not alter the leading edge profiles of the TPD spectra. However, it shifts the desorption maxima of
21
the TPD spectra towards higher temperatures, where the increase in the desorption maxima is mainly due to the longer duration of time required to complete the desorption with increasing number of adsorbates on the surface.
First order desorption kinetics (m = 1) indicates that desorption rate is linearly proportional to the adsorbate coverage. This type of desorption kinetics is observed when the adsorbates can reversibly and non-dissociatively/molecularly adsorb and desorb from the surface. As can be seen from Figure 2.6b, first order desorption peaks have a certain asymmetry and increasing the coverage does not change the desorption temperature of the first order desorption peaks.
Figure 2.6. Sample TPD spectra obtained for (a) zeroth order (b) first order (c)
second order desorption kinetics as a function of increasing adsorbate coverage. Adapted from Ref. [68].
Moreover, for adsorbates that show both first order desorption kinetics and
layer-by-layer growth on the substrate surface, TPD intensities corresponding to sub-monolayer-by-layer coverages eventually reach a saturation when the substrate surface is totally occupied by the adsorbates (see Figure 3.2.). As a result, this specific saturation point can be used as a reference for 1 monolayer (ML) and can be utilized to quantify the adsorbate coverage of the remaining TPD profiles [71]. On the other hand, second order desorption (m = 2) kinetics means that desorption rate is directly proportional to the square of the adsorbate coverage. This type of
22
desorption kinetics is obtained upon recombinative desorption of species that are originally dissociatively adsorbed on the surface [78]. It should be noted that an increase in adsorbate coverage increases the collision probability of the dissociated species on the surface. Consequently, as can be seen from Figure 2.6c, desorption maxima of second order TPD profiles shifts to a lower temperature with increasing adsorbate coverage.
As mentioned earlier, TPD profiles can be also used extract information about kinetics and thermodynamics of desorption. For instance, Redhead Analysis can be used in order to calculate the desorption energy of an adsorbate following first order desorption kinetics [79]. Equation 2.7 represents the Redhead Equation that is used for determining the adsorption energies of adsorbates with 1st order desorption kinetics, where kinetic parameters are assumed to be independent of adsorbate coverage [69]. It should be noted that Tm corresponds to the
desorption maxima of the TPD peak in Equation 2.7.
= ( − 3.46) (2.7)
In Equation 2.7, A/β ratio gives information about the statistical density of microstates. It should be noted that desorption processes become more facile with increasing number of available microstates at the transition state. Consequently, A/β ratio is usually set between 108 – 1013 K-1 since desorption transition state is assumed to be neither tight nor loose, revealing a moderate magnitude of statistical density of microstates.
Another method that can be used for obtaining information about desorption kinetics/thermodynamics is the leading-edge analysis. In this technique, a linear portion of the TPD curve that is located around the peak take-off region is used in order to calculate the desorption energy of an adsorbate [80]. By using the data points that corresponds to the linear portion of the TPD curve, a ln(r) vs 1/T curve is constructed and desorption energy is calculated from the slope of this curve. While the leading-edge analysis requires a smaller number of
23
assumptions/approximations compared to the Redhead Analysis, the former approach is often less frequently used as it requires TPD profiles with very high S/N ratio for achieving precise numerical results [69].
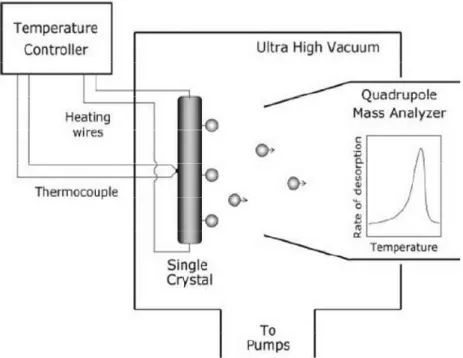
Figure 2.7 represents the schematic of a TPD/TPRS module that is used in UHV surface science applications. In the current work, PID-controlled linear sample heater (Heatwave, Model 101303) and a quadrupole mass spectrometer (QMS) (Ametek Dycor Dymaxion DM200) were used for the TPD/TPRS experiments. All of the TPD/TPRS measurements were performed with a heating rate of 1 K/s, 70 eV QMS beam energy and 30 ms dwell time for each desorption channel. Temperature logging rate was 5 s-1 (corresponding to a temperature recording step size of 0.2 K) while QMS had a unit resolution that allowed us to distinguish m/z peaks separated by 1 unit (e.g m/z = 46 from m/z = 47).
Figure 2.7. Schematic of a TPD/TPRS module that is used for UHV
24
2.6 Experimental Procedures
2.6.1 Cleaning of Pd(111) Single Crystal Model Catalyst
At the beginning of every experiment, Pd(111) sample surface was cleaned by using three different procedures depending on the amount of the contaminations present on the Pd(111) surface. The first procedure involved multiple cleaning cycles with O2(g), where Pd(111) was exposed to oxygen (Linde AG, purity ≥ 99.999%)) by using a high precision leak valve allocated for oxygen dosage (PO2 = 1.0 × 10⁻⁸ Torr, 5 min at 600 K) and then consecutively annealed at 1000 K for 5-10 min in UHV. In the second method, after exposing the Pd(111) sample to the conditions given above, sample was flash-heated to 1000 K and then
etched by Ar+ (Ar(g), Linde AG, purity ≥ 99.999%) at room temperature (RT), followed by
successive annealing at 1000 K in UHV for 5-10 min. The last procedure included Ar+ sputtering at RT and subsequent annealing of Pd(111) at 1000 K in vacuum for 5-10 min. After conducting one of these cleaning procedures, cleanliness of the Pd(111) model catalyst was verified by performing XPS measurements and blank TPD experiments.
Figure 2.8 represents XPS survey spectrum and a blank TPD profile for m/z = 28 (CO) obtained from a clean Pd(111) surface. Since the major contamination on the clean Pd(111) surface was mostly due to the adsorption of background CO, we rutinely performed m/z = 28 (CO) TPD and XPS analyses after the cleaning protocols. As can be seen from Figure 2.8a, within the detection limit of the XPS spectrometer, Pd(111) surface does not contain any considerable contaminations after cleaning the surface with Ar+ sputtering. m/z = 28 (CO) TPD profile given in Figure 2.8b is also in accordance with this observation, since Pd(111) surface practically does not yield any strongly-bound CO species on the surface after cleaning. It should also be pointed out that the survey spectrum contains ‘ghost’ peaks, i.e. the XPS signals which are observed due to the simultaneous irradiation of the sample with unwanted X-Ray emission coming from Al portion of the Mg/Al dual anode.
25 800 600 400 200 0 5x 10 4 XPS Survey Spectrum of Pd(111) XPS I nt en sity (a. u .)
Binding Energy (eV)
Pd(3d) Pd(3s) Pd(3p) Pd(3d) loss feature Pd(3p) Ghost Pd(4p) Ghost Pd(3d) 1x1 0 -8 Temperature (K) QM S In te nsi ty (m /z = 2 8 a .u .)
Blank TPD obtained from Pd(111)
a) b)
200 400 600 800 1000
Figure 2.8. (a) XPS Survey Spectrum obtained from clean Pd(111). (b) m/z =
28 (CO) TPD profile obtained from blank TPD obtained from clean Pd(111).
2.6.2 Doubly-Deuterated Formic Acid Residual Gas analysis (RGA)
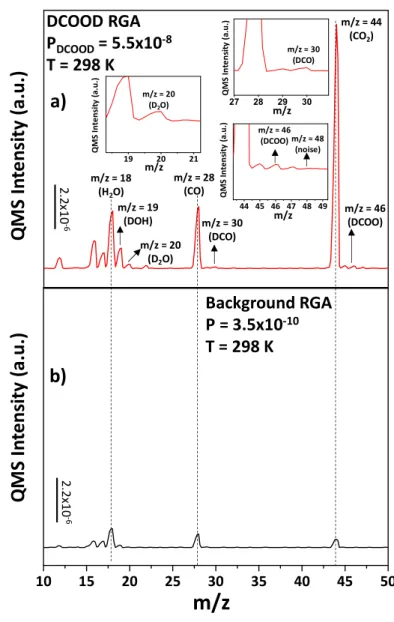
Doubly-deuterated formic acid residual gas analysis (RGA) was done in order to verify the deuterium labelling of DCOOD. It should be noted that our QMS was able to perform RGA analysis within a 40 amu range. Consequently, RGA data was collected between m/z = 10 and m/z = 40 range in order to be able to detect the signals that can conclusively identify the presence of DCOOD. Figure 2.9a represents the DCOOD RGA that is obtained at 298 K (RT) when chamber was filled with 5.5x10⁻⁸ Torr of DCOOD while Figure 2.9b represents the background RGA of the chamber that is obtained prior to DCOOD exposure at the same temperature. As can be seen from Figure 2.9b, background RGA spectrum does not contain any m/z = 30 (DCO) and m/z = 46 (DCOO) signals, which are two conclusive signals that belong to the fragmentation of DCOOD. On the other hand, Figure 2.9a reveals that DCOOD exposure causes formation of relatively weak m/z = 30 (DCO) and m/z = 46 (DCOO) signals. Consequently, presence of m/z = 30 (DCO) and m/z = 46 (DCOO) fragments in Figure 2.9a verified the presence of the doubly-deuterated formic acid.
26 10 15 20 25 30 35 40 45 50 m/z = 46 (DCOO) m/z = 30 (DCO) m/z = 44 (CO2) m/z = 28 (CO) m/z = 18 (H2O) m/z = 20 (D2O)
m/z
Q
M
S
In
tens
ity
(
a.
u
.)
Q
M
S
In
te
n
si
ty
(a.u
.)
2.2x10 -6 2.2 x10 -6 27 28 29 30 m/z = 30 (DCO) m/z Q M S In te n sit y (a .u .) 19 20 21 m/z = 20 (D2O) m/z QMS Inte nsit y ( a. u .) 44 45 46 47 48 49 m/z = 46 (DCOO) m/z = 48 (noise) m/z Q MS Inten sit y (a .u .)DCOOD RGA
P
DCOOD= 5.5x10
-8T = 298 K
Background RGA
P = 3.5x10
-10T = 298 K
m/z = 19 (DOH)a)
b)
Figure 2.9. (a) DCOOD RGA obtained at 298K and PDCOOD= 5.5x10⁻⁸ Torr. (b) Background RGA spectrum of the UHV chamber obtained at 298K.
2.6.3 Protecting Deuterium Labelling of Doubly-Deuterated Formic Acid
In the current work, we used doubly-deuterated formic acid (DCOOD) (Cambridge
Isotopes Laboratories Inc., Formic Acid-D2, D > 98 %, D2O < 5 %) as the FA source, since deuterium labelling allowed us to distinguish the specific contributions of FA, NH3 and MnOx
to the dehydrogenationprocess (see Chapters 3 and 4). Consequently, some precautions were
27
(l) was transferred into a UHV-compatible glass bulb attached to a VCR Swagelok nupro UHV valve in a glove box in order minimize H-D exchange events that can occur between the
atmospheric H2O and DCOOD. Then, this DCOOD (l) containing bulb was connected to the
gas manifold of the UHV chamber dosing lines. The container bulb was also covered with a thick layer of aluminum foil to avoid photochemical reactions. Lastly, before each FA experiment, a fresh dose of DCOOD(g) (25 Torr) was transferred into the manifold (after 1-2 freeze-thaw cycles) and to the dedicated DCOOD dosing line since FA is known to decompose upon its long-term interaction with stainless steel [25].
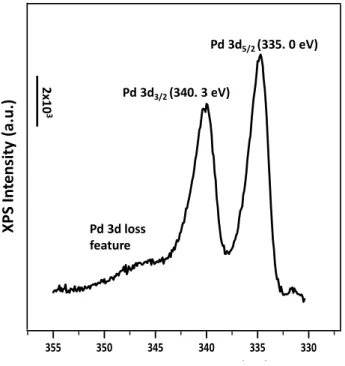
2.6.4 Characterization of Pd(111) Single Crystal Model Catalyst
XPS and LEED was used in order to characterize oxidation state and surface crystal structure of the clean Pd(111) surface. Figure 2.10 represents the Pd3d spectrum that is obtained from clean Pd(111). As can be seen from Figure 2.10, Pd 3d5/2 signal is located around 335.1 eV, which indicates that clean Pd is in metallic form [81].
355 350 345 340 335 330 2 x1 03 XP S In te ns it y (a.u .)
Binding Energy (eV)
Pd 3d3/2 (340. 3 eV)
Pd 3d5/2 (335. 0 eV)
Pd 3d loss feature
28
Figure 2.11a represents the LEED pattern of an unclean sample while Figure 2.11b represents the LEED pattern of a clean Pd(111) surface. Note that clean Pd(111) surface yields much brighter and sharper spots on the phosphorescence LEED screen since more low energy electrons can reach to the surface and scatter from Pd atoms in the absence of contaminations. Besides, hexagonal c(1x1) LEED patterns observed in both figures verified the (111) crystal structure of the clean Pd single crystal surface as well as showing that contaminations generally do not disrupt the (111) surface crystal structure of the model catalyst.
a)
b)
Figure 2.11. (a) LEED pattern of unclean Pd(111) surface (b) LEED pattern
of clean Pd(111) surface
2.6.5 Deposition of Manganese (Mn) on Pd(111)
Mn(s) was deposited on the Pd(111) surface via a thermal evaporation process. In this method, high purity Mn metal (MaTek Manganese foil casted, purity: 99.9%) was evaporated in vacuum and then the source vapor was condensed on the surface of specific substrate [82]. Figure 2.12a shows the three custom-made Mn-evaporators that are designed for the thermal
29
evaporation process, where these designs are labelled as 1, 2 and 3 respectively. In design 1, a rectangular Mn piece (1cm x 1cm x 2cm) was sandwiched between two tantalum (Ta) foils and these foils were spot welded from their sides in order to achieve mechanical stability. In design 2, a Mn piece with identical dimensions was placed inside a tungsten (W) coil. Similarly, in design 3, another identical Mn piece was placed between two claws which are made from Ta foil. It should be noted that in all of the designs, two tungsten (W) wires were spot welded to the both sides of each Mn-evaporator (See Figure 2.12b) in order to overcome the depth of the evaporator line and place the Mn-evaporators in inner side of the thin film compartment given in Figure 2.12c. a) b) c) 1 2 3
Figure 2.12 (a) Top-view of custom-made evaporators. It should be noted that different
Mn-evaporators are labelled as 1, 2, and 3; (b) Side-view of the custom-made Mn evaporators. (c) Thin film doser compartment of the UHV setup.
In the current work (Chapter 4), evaporator 1 was used since other designs suffered from unstable Mn deposition rates. Mn-evaporator 1 was heated by a DC power supply (Maksimel Elektronik, 30 W DC Power Supply) by applying a power of 18 W to the evaporator A (V = 1.5 V, I = 12 A). Since Mn evaporator was not equipped with a shutter, Pd(111) sample was transferred to the thin film doser compartment after evaporator 1 was heated for 12-15 mins at 12 A in order to warm the Mn source up.
30
The XPS analysis discussed in Section 4.1 revealed that, when evaporator 1 is warmed up, it had a deposition rate of 1.5 ML/min if the dosing parameters that are described above are used. In other words, this custom-made evaporator is roughly capable of forming 2-3 nanometers (nm) thick Mn thin films on Pd(111) surface per minute (after evaporator is warmed up for 12-15 mins) in vacuum at RT when 18 W power is applied.
31
CHAPTER 3
Effects of Brønsted Bases on Formic Acid Dehydrogenation Selectivity of
Pd(111) Single Crystal Model Catalyst
This Chapter is reprinted (adapted) with permission from (Karakurt, B., Koçak, Y. and Ozensoy, E. Enhancement of Formic Acid Dehydrogenation Selectivity of Pd(111) Single Crystal Model Catalyst Surface via Brønsted Bases. The Journal of Physical Chemistry C, 2019, 123,47, pp 228777 - 22788). Copyright (2019) American Chemical Society.
Figure 3.1. Schematic illustration of the enhancement in FA dehydrogenation
over Pd(111) single crystal model catalyst surface upon NH3 functionalization [8].


![Figure 3.1. Schematic illustration of the enhancement in FA dehydrogenation over Pd(111) single crystal model catalyst surface upon NH 3 functionalization [8]](https://thumb-eu.123doks.com/thumbv2/9libnet/5683766.114430/46.892.265.651.465.855/figure-schematic-illustration-enhancement-dehydrogenation-crystal-catalyst-functionalization.webp)