ONLINE FIRST
This is a provisional PDF only. Copyedited and fully formatted version will be made available soon.
ISSN: 0015-5659 e-ISSN: 1644-3284
The evaluation of cerebral venous normal anatomy and
variations by phase-contrast cranial magnetic resonance
venography
Authors: E. Doğan, M. Apaydın
DOI: 10.5603/FM.a2021.0027 Article type: Original article Submitted: 2021-01-05 Accepted: 2021-02-05
Published online: 2021-03-01
This article has been peer reviewed and published immediately upon acceptance.
It is an open access article, which means that it can be downloaded, printed, and distributed freely, provided the work is properly cited.
The evaluation of cerebral venous normal anatomy and variations by phase-contrast cranial magnetic resonance venography
E. Doğan, M. Apaydın, The evaluation of cerebral venous normal anatomy with MRI venography
E. Doğan1, M. Apaydın2
1Department of Radiology, Faculty of Medicine, Muğla Sıtkı Koçman University, Mugla, Turkey
2Department of Radiology, İzmir Atatürk Education and Research Hospital, Izmir, Turkey
Address for correspondence: Ass. Pr. Emrah Doğan, Muğla Sıtkı Koçman University Education and Research Hospital, Department of Radiology, 228 sok. Obam sitesi No:15 Kötekli/Menteşe, Muğla, Turkey, tel: +905066619794, fax: +90 2522123599, e-mail: [email protected]; [email protected]
Abstract
Background: The aim of our study is to determine the ability of the PC-CMRV technique to detect cranial anatomy, variations, thrombosis, to reveal the deficits of the technique and to discuss the reasons for these deficits on a physics basis.
Materials and methods: PC’s detection rates of anatomic variations and physiological filling defects (FDs) were evaluated in 136 patients and compared with the time-of-flight (TOF) technique MRI and cadaveric studies.
Results: The dominance correlation between the three evaluated sinuses (transverse sinus
(TS), sigmoid sinus, jugular vein) which originated from different embryological buds were
statistically significant and the right vessel chain was dominant. PC is inadequate to show some vessels like inferior sagittal sinus (anatomically, this vessel is approximately present in 100% of the cases, but it was only visualized in 41.2% of the patients in PC-MRI).
Visualization of major veins was sufficient. PC-MRI creates physiological FDs in 27.2% (72,3% middle,10.3% inner,17% outer part) of the patients. The FDs were concentrated in the middle part and not observed in the dominant sinus.
Conclusions: The defects of visualization are present due to the PC’s technique. It can be misdiagnosed as agenesis or thrombosis. PC creates a high incidence of physiologic FDs in
TS. The results are not reliable, especially if FDs are in the middle part or non-dominant side.
Key words: magnetic resonance, venography, dural sinuses, phase contrast, arachnoid granulations
INTRODUCTION
Cranial magnetic resonance venography (CMRV) is the basic imaging method in the evaluation of venous sinuses, since it is a non-invasive and non-irradiating technique [1]. Time-of-flight (TOF) and phase-contrast (PC) are the techniques used in CMRV [2]. CMRV is the most common method used in scientific research to evaluate venous variations [3]. Our study is one of the first studies performed with the PC technique using a 1.5 Tesla MRI machine.
According to literature, right chain vascular structures are remarkably dominant. Why
is that? Transverse sinus (TS) and sigmoid sinus (SS) originate from the posterior plexus, jugular vein (JV) originates from the anterior cardinal vein (ACV). The correlation between
these embryological structures can be determined by comparison of dominance [4]. Can the
embryological mechanisms be explained by evaluating the correlation of vascular structures originating from different embryological bud's? Is the embryological mechanism independent or interdependent?
Venography is a technique mostly used to detect thrombosis. Filling defects (FDs) are the main diagnostic finding in cranial magnetic resonance venography (CMRV), but it can also be seen as physiological except for thrombosis [3,5]. The percentage of these defects had been evaluated in previous studies [5-7], however the points where the defect is located on the
TS are not specified. In which segments are FDs common? Which physical and physiological mechanisms can be associated with these FDs?
The aim of our study is to determine the ability of the PC-CMRV technique to detect cranial anatomy, variations, thrombosis, to reveal the deficits of the technique and to discuss the reasons for these deficits on a physics basis.
MATERIAL AND METHODS Patients
Ethics committee approval was obtained for this study with document number 0945/7. 214 patients who had CMRV were chosen for the preliminary exam. Patients with a history of operation, thrombosis, ischemic change, tumor, congenital anomalies, small vessel disease and demyelinating diseases were excluded from the study. All subjects were followed up for two years to exclude thrombosis.
Finally, 136 patients were included in the study :50 males and 86 females; mean age [±SD], 48,7 ± 16,3 years, range, 18-93 years. Males mean age [±SD] is 47,6 ± 12,9 years; range between19 and 86 years old. Females mean age [±SD] is 50,6 ± 13,7 years; range between 18 and 93 years old. All our patients were in the adult age group. CMRV and
conventional MRI’s (CMRI) of all the patients were evaluated by one experienced radiologist and one neuroradiologist and evaluated together again in case of a discrepancy.
Imaging examinations
A 1.5-tesla PHILIPS (The New Intera Nova, Philips medical system, Best,
Netherlands) device was used for scanning. CMRV examinations were performed using the 3D PC technique without applying any saturation band. Maximum intensity projections (MIPs) were created at the MR operating console for the 3D CMRV dataset. The standard parameters that were used as follow: FOV = matrix 230/70 = 256x256, slice 160, thickness =1, Col= 1, TR / TE: 16 / 6,8. The images were obtained with axial sections in 3D / FFE sequence. The last images were created with a velocity encoding (VENC) method by applying bipolar gradients sequentially along the cardinal directions (x-, y-, and z-).
Image analysis
The images obtained with the picture archiving and communication system (PACS) were scanned in different projections for various veins in each patient. All veins were evaluated in raw images and 3D MIP images obtained by PC technique.
TS, SS, JVs dominancy were determined according to gender. Measurements were
from the SS junction for the JV [8,9]. If there is a difference greater than 1/5 between the sinuses, the larger side was evaluated as dominant.
In addition, Superior sagittal sinus (SSS), Inferior sagittal sinus (ISS), Straight sinus
(StS), internal cerebral vein (ICV), Galen vein (GV), Basal vein of Rosenthal (BVOR), occipital vein (OV), Labbe vein (LV) and Trolard vein (TrlV) were evaluated bilaterally. All
vein's PC visualization rates were compared with anatomical cadaveric studies and we found the real visualization. The bilateral TS was divided into 3 equal parts (I: Inner part, II: Middle part III: Outer part) and physiological FDs’ percentages were calculated.
Statistical analysis
The obtained data were enrolled and tabulated using the Office excel (Microsoft) data recording system. The data were analysed using statistical software (SPSS, IBM). All
continuous variables were expressed as counts and averages were calculated (mean [± SD]). Percentages were calculated for qualitative values. Pearson and chi-square analysis were used for comparisons. The p value < 0,05 was accepted as statistically significant. Kendal Tau B test was performed in the non-parametric correlation analysis.
RESULTS
Dominances of TS, SS and JV were evaluated:
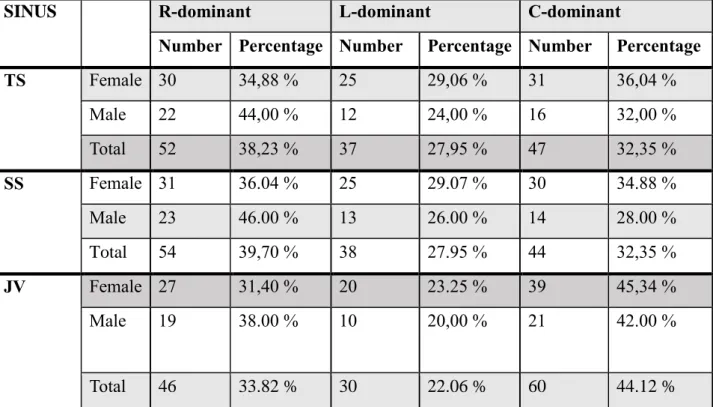
For TS: Right(R)-dominance was found in 52(38,23 %), left(L)-dominance in 37(27,95%), co-dominance in 47(32,35%) of the patients.
For SS: R-dominance was found in 54(39,70%), L-dominance in 38(27,95%), co-dominance in 44(32,35%) of the patients.
For JV: R-dominance was found in 46(33,82%), L-dominance in 30(22,06%), co-dominance in 60 (44,12%) of the patients.
According to gender:
For males; TS: R-dominance was found in 20(44,00%), L-dominance in 12(24,00%), co-dominance in 16(32,00%) of the patients SS: R-co-dominance was found in 23(46,00%), L-dominance in 13(26,00%), co-L-dominance in 14(28,00%) of the patients JV: R-L-dominance was
found in 19(%38,00) L-dominance in 10 (20,00%), co-dominance in 21 (42,00%) of the patients.
For females; TS: R-dominance was found in 30(34,88%), L-dominance in 25(29,06%), co-dominance in 31(36,04%) SS: R-co-dominance was found in 31(36,04%), L-co-dominance in 25(29,07%), co-dominance in 30(34,88%) of the patients JV: R-dominant was found in 27(%31,40) L-dominance in 20(23,25%), co-dominance in 39(45,34%) of patients.
The TS, SS, JV's dominances' prevalence and frequency according to gender group are demonstrated in Table 1.
There was no statistically significant difference according to gender ( TS, p=0,567; SS, p=0,507; JV, p=0,726).
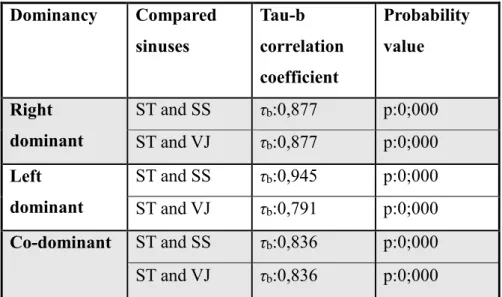
Kendal Tau B correlation analysis was applied to evaluate the relationship between
TS, SS, and JV dominance. The dominance relationship between the three evaluated sinuses
on the right and left separately was statistically significant. The strongest correlation (τb: 0.945) was found between left TS and left SS. The lowest level of relationship (τb: 0,791) was found between left TS and left JV. Tau b correlation between sinuses is demonstrated in Table 2.
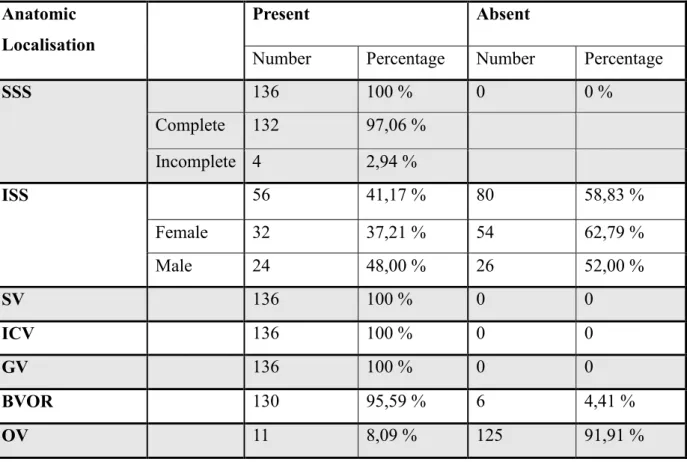
All patients had SSS. However, SSS was completely visualized in 132(97,06%) patients. In 4(2,94%) patients, the anterior part of the SSS was not seen. ISS were visualized in 56(41,17%) of the patients [32 (37,21%) females 24 (48,00%) males]. StV, ICV, GV were visualized in all of the patients. BVOR was seen in 130(95,59%) and OC in 11(8,09%) of the patients. The percentage of detection of venous structures in the study are demonstrated in Table 3.
The existence of TrlV and LV were coded (as ‘+’ present, ‘-’ absent).
For TrlV: R+L+ was found in 28(20,59%), R+L- in 30(22,06%), R-L+ in 23(16,91%), R-L- in 55(40,44%) of the patients.
According to gender:
For females, R+L+ was found in 17(19,77%), R+L- in 19(22,09%), L+ in 13(15,12%), R-L- in 37(43,02%) of the patients.
For males, R+L+ was found in 11(22,00%), R+L- in 11(22,00%), R-L+ in 10(20,00%), R-L- in 18(36,00%) of the patients.
For LV: R+L+ was found in 73(53,67%), R+L- in 27(19,85%), R-L+ in 21(15,44%), R-L- in 15(11,03%) of the patients.
According to gender:
For females, R+L+ was found in 49(56,98%), R+L- in 17(19,77%), L+ in 10(11,63%), R-L- in 10(11,63%) of the patients.
For males, R+L+ was found in 24(48,00%), R+L- in 10(20,00%), R-L+ in 11(22,00%), R-L- in 5(10,00%) of the patients.
There was no statistical difference according to gender. (p:0,153 for TrlV and p:0,060 for LV). Bilaterally, TrlV and LV visualization rates according to the gender are demonstrated in Table 4.
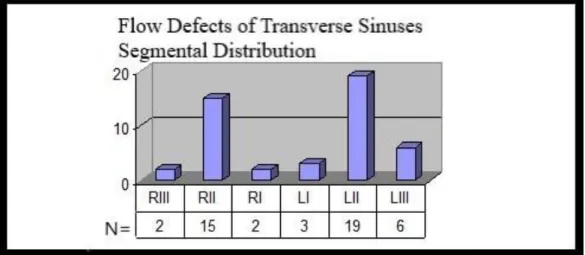
Finally, physiological FDs in the TS were evaluated. They were present in 37 of 136 patients (27,2%). 10 of these patients had FDs in more than one segment. In total 47 FDs were determined. 34 of them were in the middle segments.
Two patients (1,48%) had FDs in the right outer part: one partial (0,74%) and one complete (0,74%). Both of them were in the non-dominant sinuses. Fifteen FDs (11,03%) were in the middle part of the right TS: thirteen were partial (9,55%) and two complete
(1,48%). Thirteen were in the non-dominant sinuses, whereas two in the co-dominant sinuses. Two patients (1,48%) had FDs in the right inner part: one partial (0,74%) and one complete (0,74%). Both of them were in the non-dominant sinuses. Three patients (2,21%) had FDs in the left inner part: two partial (1,48%) and one complete (0,74%). Three of them were in non-dominant sinuses. Nineteen (13,97%) were in the middle part of the left TS: sixteen partial (11,76%) and three complete (2,21%). Sixteen were in the non-dominant sinuses, whereas three in the co-dominant sinuses. Six (4,41%) were in the outer part of the left TS: one partial (0,74%) and five complete (3,67%). Five were in the non-dominant sinuses, whereas one in the co-dominant sinuses. There was no FD in the dominant sinuses. The FDs according to segments were demonstrated in figure (Fig. 1).
DISCUSSION
The dominance of the cerebral venous vessels is crucial before the radical neck dissection, excision of tumours invading the TS, SS, JV or glomus jugular tumours that may require ligation of the internal JVs [10]. In this study TS, SS, and JV’s dominances were found as right dominance (44%), co-dominance (32%) and left dominance (24%) (Fig. 2). Although the percentages change, the order didn't change for both anatomic and radiological studies as well as this study [5,11,12]. Why right dominance is more visualized than left? We can find
the answer to this question in the hypotheses belonging to the embryological development period. The superior vena cava originates from the right ACV together with the right JV. The caudal part of the left ACV largely regresses in the development process. If it does not regress, an anomaly called double vena cava occurs. ACVs merge with the posterior plexus which gives origin to TS and SS. Earlier joins coinciding with the regression process on the left, possibly lead to recessive left vessel chain. ACV regression on the left side influences not only
JV but also TS and SS [4,13]. This study revealed that if the TS was dominant, the SS and JV
were also dominant on the same side [2]. It showed that ipsilateral embryological buds move together. This information supports the hypothesis above.
Since the use of oral contraceptives and pregnancy is associated with cranial venous thrombosis, the use of CMRV is more common in women [3]. In our study, the majority of our patients were females (86 females, 50 males). There was no statistically significant gender-related difference between the TS, SS and JV dominances (p=0,567 for TS, p=0,507 for SS, p=0,726 for JV). The results of Goyal et al. were similar [14].
PC’s venous detection rates were evaluated and compared with anatomic studies. SSS was found at a rate of 100%. This finding is similar to the literature [5-7]. SSS develops from the marginal sinus. Partial fusion defect at the attachment point of the marginal sinus to the foramen cecum causes a partial growth defect anteriorly. This situation is called partial split
sinus (PSS) [2]. In Kaplan and Browder's cadaveric series, PSS prevalence was found as 6%
[15]. In our study, PSS variant of the SSS was observed at a rate of 2.94%. The signal loss may occur in the anterior section because the flow is going in the same direction as the artery, when an inferior saturation band is used to prevent arterial flow in TOF images [9]. In
comparison with cadaveric studies, the percentage values are lower in our study. Its mean is that there is no signal loss due to PC technique in this area, unlike TOF.
In radiological studies, the presence of the ISS was noted between 33-43% [16,17]. In our study, it was found at a rate of 41.17% (Fig. 3). In this case, it is necessary to look at the cadaveric studies. According to these ones, ISS was not detected in only 1% of the cases. To sum up, normally ISS is present but devices' visualization and technique aren’t adequate to show this vessel [18]. We looked at a study performed with more primitive device (0.35-tesla low-resolution) conducted by Sharma for explain more clearly the effect of device quality on venous visualization. Visualization rates with the low-tesla device of ISS, BVOR, ICV are respectively 11%, 34%, 60%.
In this study, many vascular structures that we visualized could not be sufficiently imaged. We can say that the lower the quality of the device, the poorer the visualization [19]. 3T, 5T and 7T devices’ visualization of minor venous vessel probably will be higher than our study. It is open to further research.
In our study, BVOR was detected at a rate of 95.58%. It was not observed unilaterally in five and bilaterally in one of the patients. In Ayanzen's TOF research, BVOR was detected in 91% of the patients. Our data are close to these findings [5]. We didn’t find a cadaveric study to compare the percentage of basal vein [18]. StS, ICV, and GV were detected in all of the patients. Results of other studies were similar to ours [5,19]. When FDs are found in 100% visualized veins, it should be accepted primarily as pathological.
It has been reported that the OV is more prominent in patients with thrombosis [20]. If the TS and SS are hypoplastic, the OV is used as an alternative outflow pathway [9]. In our study, the OV detection rate with PC was found as 8,09%. OV prevalence is between 4% and 35.5% according to data from reviewed anatomic and radiological TOF studies by Goyal et al [14]. Our results were included in the aforementioned interval (Fig 4).
TrlV and LV form the main venous communicant anastomotic network. The LV
provides the connection between the silvian veins and the posterior group, whereas the TrlV provides the connection between the SSS and the silvian veins. For this reason, it is also named as trolard-labbe circle. For example, when JV ligation is performed, if this network is not fully developed, venous infarction is probable. The LV should be preserved in temporal lobectomies and surgical interventions for epilepsy. Isolated thrombosis in LV, TrlV and related infarct cases have been reported in the literature [21,3]. The angiographic studies elaborating information about these veins are present too [22]. Returning to our main subject, after we indicated why the LV and TrlV should be fully visualized and their clinical
importance; our technique's detecting rate of LV and TrlV is close to other anatomical and radiological studies [5-7]. In addition, during our study, we noticed that there was no study according to gender regarding LV and TrlV, and we added it as a subtopic to the paper. There was no statistically significant difference (p:0,153 for TrlV and p:0,060 for LV) according to gender (Fig 5 a,b).
CMRI evaluation can give useful findings about thrombosis but it is not adequate in the final diagnosis. In MRI; the intensity of the thrombus changes according to the period.
What is the weaknesses of CMRI and CMRV? Thrombus due to effect of deoxyhemoglobin
appears isointense at T1 and hypointense at T2 in the first 5 days. During this period, the hypointensity of the thrombus at T2 makes it impossible to be detected in CMRI. Thus,
venous thrombus can only be detected by angiography [3]. Since 7% of deaths due to venous thrombosis happens in this period, it is important for the patient to be diagnosed early. Unfortunately, diagnosis is usually delayed for 7 days [9]. In these early days, where CMRI does not show any benefit and there is a risk of mortality, misleading sinus FDs are more important. Patients are mostly diagnosed within 5-15 days. This phase is also called the
metheamoglobin phase. During this period, the thrombus T1 and T2 are hyperintense [3]. T1
hyperintensity is reflected as hyperintense in TOF technique also. Deleting of the flow void leads to interpreting the CMRV as normal. This situation is not seen in the PC technique. In this period PC is superior than TOF [9]. After 15 days, re-canalization phase (chronic phase) starts [3]. In the chronic phase, pathways form within the thrombus. There is also dural enhancement accompanying capillary formation. Thus, it leads to a false negative result in contrast-enhanced MRI angiographic evaluation [9]. In this period, it cannot be mentioned that contrast enhanced MR angiography, which is accepted to be more advantageous than non-contrast CMRV, is superior to TOF and PC. It will be useful to evaluate CMRV FDs by comparing them with CMRI. Each technique has its pros and cons according to the period. It will be useful to evaluate CMRV images together with CMRI to prevent FDs from causing false diagnosis. In the early period, contrast enhanced MRI angiography, digital subtraction angiography in selected cases can be used for diagnosis [23].
TOF technique is used overwhelmingly in the CMRV examinations. The reason why PC research is rarely used is the long time according to TOF scanning [2]. Before mentioning the physical mechanisms of FDs, let’s briefly talk about the general points of the techniques. Phase shift is undesirable in TOF therefore, "phase compensation technique" is used to prevent this. Phase shift that we want to prevent in TOF constitutes the basic of imaging in PC. In this technique, images are taken in pairs (phase shift) while operating in (+) and (-) gradient directions. Fixed textures are removed from the image with "Image subtraction"; thus, only vascular structures are made visible. The technique is not sensitive to saturation due to flow; consequently, vascular structures with slow blood flow are better visualized in PC than in TOF. In addition, functional information such as flow direction and speed can be obtained with this technique [24]. PC's background suppression feature and anatomic detailing are superior to TOF’s ones [2,25].
PC’s has many disadvantages. The duration is long in PC and the eddy current effect is evident. It is sensitive to turbulence, spin saturation and intervoxel dephasing. It is also
affected by intrinsic factors of the nucleus. Gradient imperfection secondary to inappropriate setting is creating aliasing artifacts in the flow direction as well. Gradient performance is
directly related to device quality. There are many biomedical engineering articles in the literature about PC gradient settings. It is necessary to predict the appropriate gradient phase in advance [2].
Apart from this, there are some factors that cause FDs independent from the technique. This group consists of arachnoid granules (AG) and fibrotic bands located in the sinuses [9].
SSS and TSs are the most common places where AGs are seen. The majority of them are
located between the middle and lateral parts in the TS (92%) [26-28]. Apart from the prominent eddy current effect due to PC technique, AG contributes to the formation of FD with mechanical effects [27,28]. Fibrotic bands can make mechanical barrier effect too but it is rarely seen [9].
The FD were detected in the centre (R2-L2) at the rate of 72,3%, in the inner part
(R3-L1) at the rate of 10.3%, in the outer part (R1-L3) at the rate of 17% in TS (Fig. 6). All the
disadvantages resulting from intrinsic nuclear factors mentioned above are present in all of the segments. Gradient effects are more pronounced on sharp turns in the segments R3-L1 and
R1-L3 (outer and inner parts of TS). Besides, when the eddy current effect and the over
mentioned physical barrier effects (AG) are added, a complex set of causes creates artifacts in corners and central segments [2,25,29].
The movements of the spins in the presence of magnetic field gradients change the phase of the MR signal. These effects occur if blood flow goes a long way in the imaging volume, such as the TS. Phase shifts created by this movement cause artifacts in the phase coding direction and degrade image quality. This physical effect is more pronounced in PC than TOF [25]. The intrinsic nuclear factors contribute also to cause L2-R2 (middle parts of
right and left TS) midpoint artifacts. Since the flow continues on a linear line, it will not be
affected by the gradient effect’s refraction. The AGs is considered as the primary flow defect factor in the middle part. AGs are concentrated between the middle and lateral segments. When blood crosses from a physiological barrier like AG, the eddy current effect is towards the part where the blood is going, not where it comes. Considering the anatomical point where AGs are concentrated, this area exactly corresponds to the middle part of the sinus [25]. Since that the venous sinuses are structures that don’t have a muscularis mucosa, that can expand according to the flow rate and they don’t contain valves; two-way flows are possible and reverse flows are more pronounced in the middle section according to the hydro physics rules [3,25]. Add to this, the venous sinuses that are connected to the right atrium by a relatively short vascular way without valves, are affected by diastolic contractions [13]. Another question is why physiological FDs are not usually detected in the SSS in MRI? Two theorems
can be put forward for this. The first is the flow rate. The TS is the main portal, collecting all venous blood. It is connected to the superior vena cava via the SS and JV. It is clear that SSS and other minor veins have lower flow rate. The second reason is the presence of AGs. Despite AGs are abundant in the SSS, giant AGs are found in the TS thus eddy current effects of giant AGs can be more prominent. [3,25].
The FDs were in the non-dominant or co-dominant TSs. No FD was found in the dominant TS. Since the non-dominant sinus percentage was higher on the left side, the
frequency of FDs was higher on the left side too (right 40.4%, left 59.6%). To conclude, a FD in the dominant sinus should be primarily interpreted as thrombosis in PC studies. Physio pathologically, in recessive sinuses, eddy currents are sharper. When the diameter of the sinus is narrow, the number of spins per unit area decreases. The space-occupying effects of AGs become more pronounced.
The FD rates with TOF technique that were found by Ayanzen, Alper and Saad Ahmet; are respectively 31%, 24% and 10.8% [5-7]. In our study, the rate that was found is 27%. We can say that our FD rates are similar to other TOF and PC studies.
The study has some limitations. The tests have not been confirmed with anatomic specimen.
CONCLUSIONS
This study is the first to assess the performance of PC technique by using normal anatomic and variations data. It is also the first time that dominances were correlated for explaining embryologic movements during the development of this region. Our results showed that the right vessel group is mostly dominant and found statistically significant correlations between the dominances of TS, SS and JV originating from different
embryological buds. Left ACV regression also affects the posterior plexus during superior
vena cava’s embryological development at right. Our article supports this embryological
theorem. The visualization degree of major veins in PC were sufficient but it was inadequate for determining some vessels like ISS (anatomic presence was approximately 100%,
visualization was only 41,2%). In comparison with our device, low-tesla device’s visualization of vessels is poorer. The higher the quality of the device, the higher the
visualization rate. FDs observed in the veins normally visualized should primarily considered as thrombosis. For the first time, TS’s FDs was evaluated according to segments in PC and causes of FD’s were discussed based on physiopathology. Indeed, PC creates a high proportion of physiological FDs in TS. Results should not be trusted, especially if FDs are
present in the middle part or non-dominant side. In the middle segment, defects are primarily related to slow flow and AG while eddy current artifacts affected the corner parts. TOF and PC are similar to create FDs. Let’s remind, the research has been done in normal patients and concerns the PC's ability to demonstrate normal anatomy and its variations. PC may be superior for showing thrombosis because of the above mentioned physical rules. This topic will be opened future research.
Availability of data and material: This is a retrospective study. Approval was obtained from İzmir Atatürk Training and Research Hospital with 0945/7 before the study. The data were obtained from the pacs system and no illegal or prohibited data was included in the study.
Code availability: During the study, the programs purchased by Muğla Sıtkı Koçman University and İzmir Atatürk Education and research hospital were used legally.
REFERENCES
1.Ferro JM, Sousa DA (2019) Cerebral Venous Thrombosis: an Update. Curr Neurol Neurosci Rep Aug 23;19(10):74. https://doi.org/10.1007/s11910-019-0988-x
2.Surendrababu NR, Subathira, Livingstone RS (2006) Variations in the cerebral venous anatomy and pitfalls in the diagnosis of cerebral venous sinus thrombosis: low field MR experience. Indian J Med Sci Apr;60(4):135-142. https://doi.org/10.4103/0019-5359.24677.
3.Sajjad Z (2006) MRI and MRV in cerebral venous thrombosis. J Pak Med Assoc Nov;56(11):523-526. PMID: 17183982.
4.Manjila S, Bazil T, Thomas M, Mani S, Kay M, Udayasankar U (2018) A review of extraaxial developmental venous anomalies of the brain involving dural venous flow or sinuses: persistent embryonic sinuses, sinus pericranii, venous varices or aneurysmal malformations, and enlarged emissary veins. Neurosurg Focus 45(1):E9. https://doi.org/ 10.3171/2018.5.FOCUS18107.
5.Ayanzen RH, Bird RC, Keller PJ, McCully FJ, Theobald MR, Heiserman JE (2000) Cerebral MR Venography: Normal Anatomy and Potential Diagnostic Pitfalls. American Journal of Neuroradiology 21(1):74-78.
PMID: 10669228
6.Ahmed MS, Imtiaz S, Shazlee MK, Ali M, Iqbal J, Usman R (2018) Normal variations in cerebral venous anatomy and their potential pitfalls on 2D TOF MRV examination: Results from a private tertiary care hospital in Karachi. J Pak Med Assoc 68(7):1009-1013. PMID: 30317292
7.Alper F, Kantarci M, Dane S, Gumustekin K, Onbas O, Durur I (2004) Importance of anatomical asymmetries of transverse sinuses: an MR venographic study. Cerebrovasc Dis 18(3):236-239.
https://doi.org/10.1159/000079960
8.Canedo-Antelo M, Baleato-González S, Mosqueira AJ, Casas-Martínez J, Oleaga L, Vilanova JC, Luna-Alcalá A, García-Figueiras R. (2009) Radiologic Clues to Cerebral Venous Thrombosis.
Radiographics. Oct;39(6):1611-1628. https://doi.org/10.1148/rg.2019190015
9.Provenzale JM, Kranz PG (2011) Dural Sinus Thrombosis: Sources of Error in Image Interpretation. AJR Am J Roentgenol Jan;196(1):23-31. https://doi.org/10.2214/AJR.10.5323
10.Durgun B, Ilgıt ET, Cizmeli MO, Atasever A (1993) Evaluation by angiography of the lateral dominance of the drainage of the dural venous sinuses. Surg Radiol Anat 15(2):125-130. https://doi.org/10.1007/BF01628311. 11.Browning H (1953) The confluence of dural venous sinuses. Am j Anat 93:307-329.
https://doi.org/10.1002/aja.1000930302
12.Manara R, Mardari R, Ermani M, Severino MS, Santelli L, Carollo C. Transverse dural sinuses: incidence of anatomical variants and flow artefacts with 2D time-of-flight MR venography at 1 Tesla. Radiol Med. 2010 Mar;115(2):326-38. English, Italian. doi: 10.1007/s11547-010-0480-9. Epub 2010 Jan 8. PMID: 20058094. 13.Tubbs RS, Goren O, McBain L (2020) Anatomy, Imaging and Surgery of the Intracranial Dural Venous Sinuses. , 1st Edn. Elsevier book, Seattle, Washington, pp 1-7.
14.Goyal G, Singh R, Bansal N, Paliwal VK (2016) Anatomical Variations of Cerebral MR Venography: Is Gender Matter? Neurointervention. Sep; 11(2):92–98. https://doi.org/ 10.5469/neuroint.2016.11.2.92 15.Kaplan HA, Browder J (1973) Atresia of the rostral superior sagittal sinus: substitute parasagittal venous channels. J Neurosurg 38:602–607. https://doi.org/ 10.3171/jns.1973.38.5.0602
16. Farb RI, Scott JN, Willinsky RA, Montanera WJ, Wright GA, Brugge KG (2003) Intracranial Venous System: Gadolinium-enhanced Three-dimensional MR Venography with Auto-triggered Elliptic Centric-ordered Sequence-Initial Experience. Radiology 226(1):203-209. https://doi.org/10.1148/radiol.2261020670
17.Mattle HP, Wentz KU, Edelman RR, Wallner B, Finn JP, Barnes P, Atkinson DJ, Kleefield J, Hoogewoud HM (1991) Cerebral venography with MR. Radiology 178(2):453-458.
https://doi.org/10.1148/radiology.178.2.1987608
18. Ivashchuk RG, Tubbs S (2020) Anatomy, Imaging and Surgery of Intracranial Dural Venous Sinuses, 1st Edn. Elsevier book, Seattle, Washington, p. 29-35.
19.Sharma UK, Sharma K (2012) Intracranial MR Venography Using Low Field Magnets: Normal Anatomy and Variations in the Nepalese Population. J Nepal Med Assoc 52 (186): 61-65. https://doi.org/10.31729/jnma.3 20.Shin HS, Choi DS, Baek HJ, Choi HC, Choi HY, Park MJ, Kim JE, Han JY, Park S (2017) The oblique occipital sinus: anatomical study using bone subtraction 3D CT venography. Surg Radiol Anat Jun;39(6):619-628. doi: 10.1007/s00276-016-1767-x.
21.Cullen S, Demengie F, Ozanne A, Alvarez H, Mercier Ph, Brassier G, Lasjaunias P (2005) The Anastomotic Venous Circle of the Base of the Brain. Interventional Neuroradiology 11:325-332.
https://doi.org/10.1177/159101990501100404
22.Silva PS, Vilarinho A, Carvalho B, Vaz R (2014) Anatomical variations of the vein of Labbé: an angiographic study. Surg Radiol Anat Oct;36(8):769-773. doi: 10.1007/s00276-014-1264-z.
23.Rizzo, L., Crasto, S.G., Rudà, R. et a. (2010) Cerebral venous thrombosis: role of CT, MRI and MRA in the emergency setting. Radiol med 115, 313–325 https://doi.org/10.1007/s11547-010-0493-4
24.Konez O (1995) Manyetik rezonans görüntüleme [Turkish Book]. 1st Edn. Nobel tıp kitap evleri ltd, Istanbul, pp 12-95.
25.Wang J, Wang J, Sun J, Gong X. Evaluation of the anatomy and variants of internal cerebral veins with phase-sensitive MR imaging (2010) Surg Radiol Anat Aug;32(7):669-674 https://doi.org/: 10.1007/s00276-010-0669-6. 26.Haroun AA, Mahafza WS, Al Najar MS (2007) Arachnoid granulations in the cerebral dural sinuses as demonstrated by contrast-enhanced 3D magnetic resonance venography. Surg Radiol Anat Jun;29(4):323-328. https://doi.org/ 10.1007/s00276-007-0211-7.
27.Trimble CR, Harnsberger HR, Castillo M et-al. (2010) "Giant" arachnoid granulations just like CSF?: NOT!!. AJNR Am J Neuroradiol.;31 (9): 1724-1728. https://doi.org/10.3174/ajnr.A2157
28.Apaydin FD, Yalcinoglu O, Yildiz A, Arpaci T, Duce MN, Ozer C, Bagdatoglu C (2003) Arachnoid granulations in the transverse sinuses of a patient with ocular melanoma. J Clin Neurosci 10(1):132-134. https://doi.org/10.1016/S0967-5868(02)00112-1
29.Ozsvath RR, Casey SO, Lustrin ES, Alberico RA, Hassankhani A, Patel M (1997) Cerebral venography: comparison of CT and MR projection venography AJR Am J Roentgenol. Dec;169(6):1699-1707. https://doi.org/10.2214/ajr.169.6.9393193.
Table 1. TS,SS,JV dominances according to gender and side
SINUS R-dominant L-dominant C-dominant
Number Percentage Number Percentage Number Percentage
TS Female 30 34,88 % 25 29,06 % 31 36,04 % Male 22 44,00 % 12 24,00 % 16 32,00 % Total 52 38,23 % 37 27,95 % 47 32,35 % SS Female 31 36.04 % 25 29.07 % 30 34.88 % Male 23 46.00 % 13 26.00 % 14 28.00 % Total 54 39,70 % 38 27.95 % 44 32,35 % JV Female 27 31,40 % 20 23.25 % 39 45,34 % Male 19 38.00 % 10 20,00 % 21 42.00 % Total 46 33.82 % 30 22.06 % 60 44.12 %
Table 2. Dominances correlation of the TS, SS,JV sinuses with keddall tau -b test Dominancy Compared sinuses Tau-b correlation coefficient Probability value Right dominant ST and SS τb:0,877 p:0;000 ST and VJ τb:0,877 p:0;000 Left dominant ST and SS τb:0,945 p:0;000 ST and VJ τb:0,791 p:0;000 Co-dominant ST and SS τb:0,836 p:0;000 ST and VJ τb:0,836 p:0;000
Table 3. PC’s visualization ratio in cranial venous vessels Anatomic
Localisation
Present Absent
Number Percentage Number Percentage
SSS 136 100 % 0 0 % Complete 132 97,06 % Incomplete 4 2,94 % ISS 56 41,17 % 80 58,83 % Female 32 37,21 % 54 62,79 % Male 24 48,00 % 26 52,00 % SV 136 100 % 0 0 ICV 136 100 % 0 0 GV 136 100 % 0 0 BVOR 130 95,59 % 6 4,41 % OV 11 8,09 % 125 91,91 %
Table 4. PC’s visualization ratio of Trolard and Labbe veins Veins R+ L+ R+ L- R- L+ R- L- Numb er Percenta ge Numb er Percenta ge Numb er Percenta ge Numb er Percenta ge Trolard Female 17 19,77 % 19 22,09 % 13 15,12 % 37 43,02 % Male 11 22,00 % 11 22,00 % 10 20,00 % 18 36,00 % Total 28 20,59 % 30 22,06 % 23 16,91 % 55 40,44 % Labbe Female 49 56,98 % 17 19,77 % 10 11,63 % 10 11,63 % Male 24 48,00 % 10 20,00 % 11 22,00 % 5 10,00 % Total 73 53,67 % 27 19,85 % 21 15,44 % 15 11,03 %
Figure 1: Segmental distribution of filling defects in transverse sinuses, abbreviations; R: right, L: left.
Figure 2. Venous sinuses are dominant in right (arrow: SS arrowhead: TS cutted arrowhead: JV)
Flo,,
,
Defed
ofTran
s
Y
Segmerr
al
Di
tribution
20 10 RIII RII RI LI N= 2 15 2 3.
e
ınuse LII LIII 19 6Figure 3: Internal cerebral veins (arrow) and GV (arrowhead) in MIB images
Figure 5: TrldVs (arrowheads) and LVs (arrows)
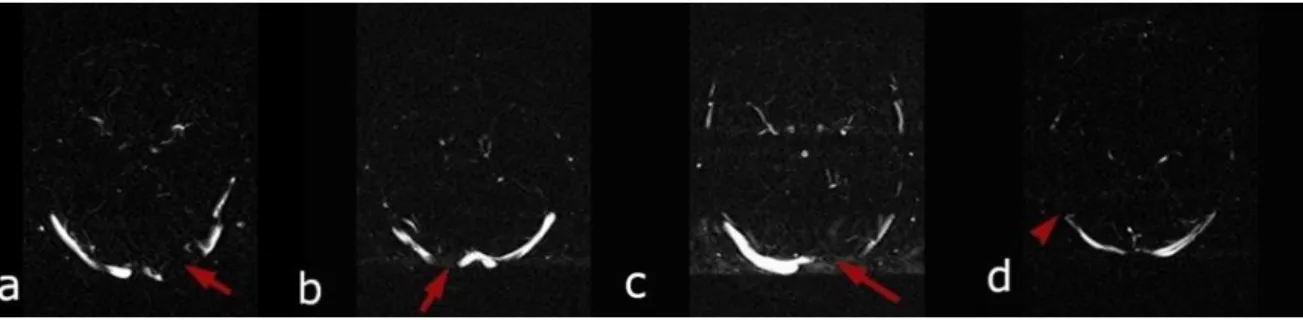
Figure 6: Physiological filling defects of TS a. Filling defect of left inner and middle segments (arrow) b. Filling defects of right inner segment (arrow) c. Filling defect of left inner and middle segments (arrow) d. Filling defect of right outer segment (arrowhead)