FUNCTIONAL CHANGES IN THE HUMAN
CORTEX OVER THE COURSE OF VISUAL
PERCEPTUAL LEARNING
a thesis submitted to
the graduate school of engineering and science
of bilkent university
in partial fulfillment of the requirements for
the degree of
master of science
in
neuroscience
By
Beyza Akkoyunlu
March 2020
Functional Changes in the Human Cortex Over the Course of Visual Perceptual Learning
By Beyza Akkoyunlu March 2020
We certify that we have read this thesis and that in our opinion it is fully adequate, in scope and in quality, as a thesis for the degree of Master of Science.
H¨useyin Boyacı(Advisor)
Burcu Ay¸sen ¨Urgen
Dicle Nahide D¨ovencio¨glu
Approved for the Graduate School of Engineering and Science:
Ezhan Kara¸san
ABSTRACT
FUNCTIONAL CHANGES IN THE HUMAN CORTEX
OVER THE COURSE OF VISUAL PERCEPTUAL
LEARNING
Beyza Akkoyunlu M.S. in Neuroscience Advisor: H¨useyin Boyacı
March 2020
In this study we assessed functional changes through visual perceptual learning with bisection discrimination task. Before learning, after third session of learning and after learning ended, behavioral threshold and fMRI data has been collected. Our results showed that while participants showed threshold decrease in the mid-learning session, the post-mid-learning thresholds are turned to pre-mid-learning levels. These results might be due to fatigue which caused by our experiment. Besides to training condition, we also tested location and task specificity. The results showed that only 150◦polar angle location showed significant change between ses-sions. Along with the behavioral data, we collected task-based fMRI data while participants performing training and control conditions in the scanner. The anal-ysis showed task-based BOLD response changed with session. However, post-hoc tests did not reveal significant results. The resting-state functional connectivity analysis showed that the functional connectivity between V1 and V2 regions is significantly increased. The Post Hoc analysis showed significant change in the 210◦and 150◦polar angle conditions. The changes in the behavioral and func-tional connectivity measurements at 150◦polar angle conditions, these results might indicate the effect of the inter-hemispheric connections. Moreover, our analysis on resting state data also revealed that, while there is no change be-tween pre-learning and mid-learning sessions, connectivity changes significantly in the post-learning session compared to other sessions. This finding supports the idea that functional connectivity changes related to perceptual learning might be occurring at the late phases of the learning. Overall, to rule out the confounds in the behavioral measurements and to link the behavioral data with the neural data, additional measurements should be taken in the future.
iv
¨
OZET
G ¨
ORSEL ALGISAL ¨
O ˘
GRENME S ¨
URECINDE INSAN
KORTEKSINDEKI FONKSIYONEL DE ˘
GISIMLER
Beyza Akkoyunlu N¨orobilimler, Y¨uksek Lisans Tez Danı¸smanı: H¨useyin Boyacı
Mart 2020
Bu ¸calı¸smada g¨orsel algısal ¨o˘grenme s¨urecinde beyinde ger¸cekle¸sen fonksiyonel de˘gi¸siklikler incelenmi¸stir. Bu ama¸cla, ¨o˘grenme ¨oncesinde, ¨u¸c¨unc¨u ¨o˘grenme seansından sonra ve ¨o˘grenme tamamlandıktan sonra davranı¸ssal e¸sik ¨ol¸c¨umleri ve i¸slevsel manyetik rezonans g¨or¨unt¨uleme(iMRG) ¨ol¸c¨umleri alınmı¸stır. Sonu¸clar, katılımcıların ¨o˘grenme-¨oncesi ve ¨o˘grenme-s¨urecinde alınan ¨ol¸c¨umlerde algısal e¸si˘gin d¨u¸st¨u˘g¨un¨u g¨osterirken, ¨o˘grenme-sonrası alınan ¨ol¸c¨umlerde algısal e¸sik de˘gerleri ¨o˘grenme ¨oncesi de˘gerlere d¨onm¨u¸st¨ur. G¨orev ve yer spesifikli˘gini in-celemek adına alınan kontrol ¨ol¸c¨umleri yalnızca ayna pozisyonu olan 210◦kutupsal a¸cıda ¨o˘grenme b¨olgesine benzer de˘gi¸siklik g¨ozlemlenmi¸stir. Bu de˘gi¸siklik ¨o˘grenme ko¸suluna benzer olarak, ¨o˘grenme ¨ocesine kıyasla ¨o˘grenme s¨urecinde iyile¸sme g¨ostermi¸s, ancak algısal e¸sik ¨o˘grenme sonrası ¨ol¸c¨umlerde yeniden ¨o˘grenme ¨oncesi seviyeesine d¨onm¨u¸st¨ur. Bu sonu¸cların uzun deney s¨urecindeki yorgunluktan kaynaklanmı¸s olabilece˘gi d¨u¸s¨un¨ulmektedir. Davranı¸ssal verilerle birlikte, g¨ orev-temelli ve dinlenme hali i¸slevsel ¸cekimleri de toplanmı¸stır. G¨orev temelli i¸slevsel ¸cekimlerin sonucunda gruplar arasında oturumlar arasında farklıla¸smı¸stır. Ancak post-hoc testi istatistiksel olarak anlamlı bir sonu¸c vermemi¸stir. Dinlenme hali i¸slevsel ba˘glantısallık sonu¸cları ise, ¨o˘grenme ko¸sulu ve 150◦kutupsal a¸cının V1 ve V2 b¨olgeleri arasındaki i¸slevsel ba˘glantısallı˘gın ¨o˘grenme-sonrasında, ¨o˘grenme ¨
oncesi ve ¨o˘grenme s¨urecinde alınan ¨ol¸c¨umlere g¨ore arttı˘gını g¨ostermektedir. Kon-trol b¨olgesindeki de˘gi¸sme, davranı¸ssal veri ile de˘gerlendirildi˘ginde hemisferler arası ba˘glantısallı˘gın bir sonucu olarak de˘gerlendirilebilir. Bununla birlikte, bu sonu¸clar algısal ¨o˘grenme ile g¨ozlemlenen i¸slevsel ba˘glantısallık de˘gi¸simlerinin ¨
o˘grenmenin ge¸c d¨onemlerinde olabilece˘gini destekler niteliktedir. Genel olarak, davranı¸ssal verilerdeki karı¸stırıcı de˘gi¸skenlerin etkisini azaltmak ve davranı¸ssal ve n¨oral verilerin ili¸skisini incelemek adına ek ¨ol¸c¨umler alınmalıdır.
vi
Acknowledgement
First of all, I would like to thank to Assoc. Prof. Dr. H¨useyin Boyacı, for his guidance through my Master’s. In these years, I learned much more than just neuroscience. I am thankful that I have the chance to start my academic journey with him.
I would also like to thank my jury committee, Dr. Burcu Ay¸sen ¨Urgen and Dr. Dicle D¨ovencio˘glu, for their time and invaluable feedback. Even these catas-trophic days, they gave such insight to me which helped me to develop myself beyond the scope of this thesis.
I am grateful for the valuable feedback, help and support offered by Dilara Eri¸sen and Batuhan Erkat. Their intellectual contributions and companionship made this thesis possible. I would also like to thank all members of Computational and Biological Vision Lab, especially Buse Merve ¨Urgen, Ecem Altan, Cem Benar and Cemre Yılmaz. It was a great experience for me to share my achievements and failures in a such supporting environment.
I am also thankful to my parents, Davut and Selma, who tried their best to support me in every way. I am also grateful for the friendship offered by Rabia S¸en. She and her loving dog Safari brought great joy to my life and my home in the last three years.
I’m also thankful to ˙Imran Samancı and my cat Mestan, even though they came into my life so late, they were there in the hardest phases of this thesis. Their endless moral support helped me to get through these hard times.
Lastly, I would like to thank the people who has devoted their time to this thesis.
Contents
1 Introduction 1
1.1 Behavioral Effects of Perceptual Learning . . . 3
1.2 Neural Substrates of Perceptual Learning . . . 4
1.2.1 Functional Correlates of Perceptual Learning in the Human Brain . . . 4
1.2.2 Structural Correlates of Perceptual Learning in the Human Brain . . . 8
1.3 Scope and Motivation of the Present Study . . . 10
2 Behavioral Experiment 12 2.1 Background . . . 12
2.2 Method . . . 14
2.2.1 Participants . . . 14
2.2.2 Stimuli and Apparatus . . . 15
CONTENTS ix
2.2.4 Data Analysis . . . 18
2.3 Results . . . 19
2.3.1 Training condition . . . 19
2.3.2 Control Conditions . . . 20
3 Task Related Functional Magnetic Resonance Imaging 23 3.1 Background . . . 23
3.2 Methods . . . 24
3.2.1 Participants . . . 24
3.2.2 MRI Data Acquisition . . . 24
3.2.3 MRI Data Analysis . . . 27
3.3 Results . . . 29
3.3.1 Training condition . . . 33
3.3.2 Control Conditions . . . 34
3.4 Intermediate Discussion . . . 35
4 Resting State Functional Magnetic Resonance Imaging 37 4.1 Background . . . 37
4.2 Method . . . 38
CONTENTS x
4.2.2 Resting State fMRI Protocol . . . 38
4.3 Analysis . . . 38
4.3.1 Preprocessing . . . 38
4.3.2 Functional Connectivity Analysis . . . 39
4.3.3 Second-level Analysis . . . 39
4.4 Intermediate Discussion . . . 40
5 General Discussion 42 A Appendix 58 A.1 Individual threshold data for training and task based fMRI, and behavioral performance on task-based fMRI scans . . . 58
List of Figures
2.1 Outline of experiment . . . 14
2.2 Stimulus specifics. . . 16
2.3 Time course of single trial in behavioral experiment . . . 17
2.4 Threshold changes across visual locations with vertical task . . . . 20
2.5 Threshold changes across visual locations with horizontal task . . 21
3.1 Experimental design of functional localizer scan . . . 26
3.2 Time course of single trial in task based fMRI scan . . . 28
3.3 Functional localizer scan analysis pipeline . . . 30
3.4 Task-based fMRI scan analysis pipeline . . . 30
3.5 Left-hemisphere functional ROIs . . . 31
3.6 Right-hemisphere functional ROIs . . . 32
3.7 BOLD amplitude change for the training condition . . . 33
LIST OF FIGURES xii
3.9 BOLD amplitudes for horizontal bisection discrimination task . . 35
4.1 Resting-state functional connectivity analysis pipeline . . . 39
4.2 Connectivity changes between sessions . . . 40
A.1 Individual data representing thresholds of all blocks . . . 59
A.2 Individual data representing thresholds of first and last training blocks for each session . . . 60
A.3 Individual task-based fMRI data for Vertical 210◦polar angle con-dition . . . 61
A.4 Individual task-based fMRI data for Vertical 150◦polar angle con-dition . . . 62
A.5 Individual task-based fMRI data for Vertical 45◦polar angle condition 63 A.6 Individual task-based fMRI data for Horizontal 210◦polar angle
condition . . . 64
A.7 Individual task-based fMRI data for Horizontal 45◦polar angle con-dition . . . 65
List of Tables
2.1 Within Subjects Effects . . . 19
2.2 Post Hoc Comparisons - Session . . . 19
2.3 Descriptives for vertical bisection discrimination thresholds . . . . 20
2.4 Within subjects effects for vertical bisection discrimination thresh-olds . . . 21
2.5 Descriptives for horizontal bisection discrimination thresholds . . 22
Chapter 1
Introduction
The world that surrounds us constantly changes, to adapt to these changes visual system stays plastic even in adulthood. Perceptual learning is considered as a manifestation of adult neuroplasticity in the visual system. Perceptual learn-ing term refers to increased performance in a perceptual domain with experience and/or practice. Improved performance can be seen in basic sensory discrimina-tion e.g. contrast discriminadiscrimina-tion, or more complex tasks such as detecting ab-normalities from a noisy ultrasound picture. The variety of tasks creates several real-world applications for perceptual training. Professions that require intense performance at visual tasks, for instance, radiology, benefit from visual percep-tual learning. Moreover, perceppercep-tual learning can be used for therapeutic aims, e.g. people with visual deficits receive perceptual learning-based therapies and show improvement with affected visual tasks[1].
Neuroplasticity can be defined as the reorganization of the brain structure and/or function as a result of changing environment and/or physiology. A mile-stone study by Wiesel and Hubel (1963) with cats showed that the visual system, particularly ocular dominance can be affected by life experience in a limited time period, which is named as critical period [2]. The critical period refers to a term in which neurons are more sensitive to experience. It has been believed that experience-dependent changes are limited to the critical period and the brain is
stabilized after development. However, growing evidence shows that neuroplas-ticity can occur in adulthood. Adult neuroplasneuroplas-ticity is shown in many different cortical regions such as the motor cortex [3], auditory [4, 5], and visual cortex [6] Visual cortex plasticity can be induced with experience. Pathology is one such situation. After retina is lesioned, the cortical region which is responsible for processing corresponding retinal area becomes silenced. In the recovery phase, the silenced cortical region starts to process visual input from areas which was not affected by the lesion. This phenomenon is seen in primates [7] and humans through fMRI. In one study, scientists are worked with patients with macular degeneration. Macular degeneration refers to a disorder that causes vision loss in the fovea and usually develops with age. The analysis showed that the cortical area which processes foveal input in healthy humans, reorganized to process stim-uli that are in the periphery [8]. In the absence of pathology, the visual cortex also shows plasticity through perceptual learning [9]. Perceptual learning induced visual cortex plasticity helps participants to improve their visual abilities.
Perceptual learning is defined more than one century ago by William James [10], and since then numerous research has been conducted to understand its behavioral basis. On the other hand, the research on neural substrates of percep-tual learning is limited due to constraints on neuroimaging techniques in the past. Nevertheless, relatively more recent neuroimaging studies enabled understanding its neural basis. Given the practical and theoretical influence of perceptual learn-ing, it is important to unravel its neural underpinnings.
This thesis aimed to determine the functional changes in the human cortex at different phases of perceptual learning. To give a holistic view first, I will review the previous experimental and theoretical work on perceptual learning. Then, I will present our experimental setting and findings.
1.1
Behavioral Effects of Perceptual Learning
Perceptual learning has been reported in the visual system [11], taste [12], in the auditory system [4], olfactory learning [13], somatosensory learning [14]. In the scope of this thesis, I will review the hallmarks of visual perceptual learning. In vision, perceptual learning has been shown in the most basic tasks such as orientation discrimination [15, 16], spatial frequency discrimination[17], contrast discrimination [18], and hyper-acuity [19, 20]. Moreover, perceptual learning is also evident in higher-level tasks such as motion discrimination [21], texture discrimination [22, 23], as well as in more higher-level tasks such as face discrim-ination [24].
Perceptual learning results in improved performance with relatively limited training. It has been shown that even 200 trials show the learning effect [25]. Beyond that, the improved performance gained from perceptual learning was preserved over years [26, 27, 28]. The long-lasting performance improvements are accepted as a manifestation of permanent changes in the sensory information processing.
Another hallmark of perceptual learning is that improvement on a particular task is lost even with slight changes in the task characteristics. When the stimulus appeared in a different retinal position, or at different angle participants perform poorly in these tasks. This hallmark of perceptual learning is called specificity. It has been shown that improved performance is specific to trained retinal location [19] and angle [19, 29, 25], orientation [25] and trained eye [15].
Nonetheless, it has been shown that specificity is affected by numerous fac-tors. It has been shown that with orientation discrimination when the training stimuli had a wide range, the performance improvement transferred to untrained orientations[30]. It also has been shown that prolonged training results in the reduced transfer of learning[31]. Moreover, novel training paradigms resulted in the complete transfer to new tasks and new spatial locations [32, 33]. This freshly developed results challenged the perceptual learning theories which will
be discussed in the next section.
The extensive behavioral research on perceptual learning revealed well-established results that answer when and how performance increases, how long its effects have lasted.
However, its neural basis is still undetermined. Even though the compelling findings from behavioral studies, such as specificity, guide the neural theories of perceptual learning, literature shows conflicting results. To understand which mechanisms mediate the increase in the perceptual performance more research is needed.
1.2
Neural Substrates of Perceptual Learning
In the course of perceptual learning research, diverse theories have been de-veloped for understanding its neural basis. Two fundamental questions are being asked in regards to this issue. First,which neural mechanisms are used for percep-tual learning?And where does perceppercep-tual learning originate? And in this section, I will review the previous research which might be the potential answer for these questions.
1.2.1
Functional Correlates of Perceptual Learning in the
Human Brain
Regarding underlying physiological mechanisms of functional plasticity, Kar-markar and Dan [34] offered three possible scenarios: a possible explanation is that the response amplitude will increase to the trained stimulus. Another view is that learning might increase the cortical representation of the trained stimulus by allocating more neurons to process it. Furthermore, a distinct possibility is that learning would change the tuning curve’s shape. These three different mech-anisms are investigated by using different neuroimaging techniques and analysis
techniques. For answering where perceptual learning take place, copious experi-mental and theoretical work resulted with discrete answers. The relatively early theories focused on single brain regions to explain the neural basis. While some theories argues that perceptual learning based changes takes place in the different processing levels of visual cortex, other theories suggest temporal and/or frontal brain regions assist the learning process.
One of the early period views argues that perceptual learning is related to changes in the early visual cortex [22]. This view takes ground from the speci-ficity of perceptual learning. Since neurons in early visual regions have location and orientation specificity, early visual areas have been considered the base of plasticity in the visual perceptual learning.
Supporting this theory, Schoups et. al (2001) trained two rhesus monkeys with an orientation discrimination task. The recordings from monkeys’ V1 regions showed that the tuning curves are changed. The trained neurons became more responsive to the training stimulus. In humans, fMRI studies showed that blood oxygenation level-dependent (BOLD) signal increased with training in the V1 region. In Furmanski and colleagues research, participants trained on contrast discrimination task. After the learning, fMRI results showed response increase to trained stimuli, in the V1 region. [35]. Moreover, they did not detect any changes in the V2 and V3 region. The authors argued that, the converged receptive fields in the higher level might create a smaller region, and due to its size fMRI might not capture the changes in this region. Similarly, an electroencephalography (EEG) from Bao and colleagues [36] found that amplitude of responses in the primary visual cortex (V1) differed with learning.
Yotsumoto [37] and colleagues trained participants with texture-discrimination task in a series of experiment. In the first experiment, they collected fMRI data before training, after the first day of the training and when training is ended, in another saying 13 days later after experiment started and final measurements are taken 25 days later after experiment started. The fMRI results showed that, the BOLD amplitude is increased after first session of training, nonetheless, the am-plitude turned into the baseline level in the 25th day of experiment, which means
after training ended. To investigate if the decrease in the BOLD amplitude is originated by ending training, they conducted second experiment. In this exper-iment, they carried out the same experiment procedure from first experexper-iment, in addition, the participants continued to receiving training between 13th day and 25th day. The fMRI experiment from second experiment showed a similar pattern to first experiment. Therefore, authors claimed that, the signal increase at the early phases of learning is caused by synaptic strengthening which is triggered with training. Moreover, the signal is reduced at the late phases of the learning, since the learning is saturated, the synaptic strengthening is stopped.
Some scientists considered the middle-level visual processing areas such as V4 and MT as the locus of perceptual learning. This view raised from the behavioral findings showing learning transfers to untrained directions when participants are trained with larger direction intervals. Scientists argued that these results indi-cate contribution of mid-level visual processing, where neurons responsive to a wide range of orientations and locations. In a study, which collected fMRI data along with learning data, participants were trained with motion discrimination task. The fMRI results showed that BOLD response in the MST region, which is responsible from motion detection, is increased after learning and this increase is correlated with behavioral performance [21]. BOLD response is also increased in the V2 and V3A areas, however, those changes did not correlate with the behavioral improvement.
A research by Chen and colleagues, trained participants with motion direc-tion discriminadirec-tion task[38]. This research used univariate analysis to investigate changes in the response amplitude. Besides, they also analyzed data with mul-tivariate analyzing techniques to decode orientation information. The results showed significant BOLD amplitude and decoding accuracy change for the V3A region. These changes were also present one month after learning ended.
Furthermore, it has been also suggested that visual perceptual learning is as-sociated with changes in beyond the visual cortex. This view claims that decision making and/or attention-related brain regions underlay visual perceptual learn-ing. A study with monkeys, using motion direction discrimination task, found
that neural firing rate to trained stimulus in the LIP which is known to be re-lated to perceptual decision making is changed with training while they did not find any changes in the MT [39]. The scientists interpreted these results as an indicator of performance improvement’s dependency on higher level processes rather than sensory. In an fMRI study with humans, researchers trained par-ticipants on an orientation discrimination task with reinforcement. To identify which brain regions contain information related to learning, the scientists run a voxel-wise comparison analysis, the results showed that only the ACC region had a significant relationship with learning [40]. More recent research with face view discrimination task revealed that with learning, the left fusiform area, a region in the inferior temporal cortex which is responsible for processing faces increased its response[24]. MRI data collected, also, one month after training ended and, the change in the BOLD amplitude is vanished. Nevertheless, decoding accuracy of the left fusiform area increased after the learning, and this increase was persistent after one month.
Taken together, previous literature presents evidence for changes in the dis-crete neural regions. Unlike the before-mentioned views, a lately revived per-spective suggests that perceptual learning takes ground from various brain re-gions [41, 42, 43, 44]. These multi-region theories takes ground from different mechanisms. For instance two stage model [41] claims that two different plas-ticity mechanisms occurs in relation to perceptual learning, on the other hand, reverse-hierarchy theory [43] claims that at the early phases of perceptual learn-ing, higher-level brain regions assist learning and at the late phases, the early-perceptual regions takes over. In a recent study [45], participants are trained with motion discrimination task, and neural changes in whole-brain are assessed with fMRI. The neuroimaging results showed that, while the BOLD signal in the training direction in the V3A and MT+ is changed with learning, activity in the intraparietal sulcus (IPS) changed for trained and untrained directions[45]. More-over, scientists have found additional areas such as frontal eye field (FEF), ventral premotor cortex (PMv) which are related to perceptual decision making[46, 47],
also showed signal expansion for training direction. Unlike this study, the ma-jority of the studies which reviewed above, mostly focused on limited brain re-gions. Nonetheless, previous research with investigated resting-state functional connectivity gives us an opportunity to understand how the functional properties changes with learning in whole-brain. Lewis and colleagues trained participants with shape identification task showed changes in resting-state functional connec-tivity in the dorsal attention network which contains spatially distributed brain regions between different lobes [48]. Similarly, after participants trained on a motion discrimination task, the MT region’s connectivity with widespread brain regions are changed [49].
In sum, studies that investigated functional modification which is related to perceptual learning, provide supporting evidence for Karmarkar and Dan’s three hypotheses [34]. However, which mechanism is vital for the behavioral perfor-mance increase is still an open question. Regarding to the locus of perceptual learning, individual studies give different answers. To resolve these inconsisten-cies in the literature, studies which investigate whole-brain regions are needed. Also, unraveling the time-course of these changes would help us to understand how perceptual learning established.
1.2.2
Structural Correlates of Perceptual Learning in the
Human Brain
The functional plasticity is often accompanied by structural plasticity. The structural plasticity is implemented by various physiological mechanisms such as building or detaching synapses, changing place of axonal branches [50]. In hu-mans, the structural changes related to perceptual learning assessed with anatom-ical MRI imaging. The analysis of the cortanatom-ical thickness showed that cortanatom-ical thickness changes in the perceptual learning-related areas are correlated with learning. An MRI study conducted on humans with motion-color conjunction search task showed that the cortical thickness in the right posterior superior temporal sulcus (pSTS), which is an area that responsive to coherently moving
stimuli, increased with the training [51]. Moreover, the functional runs showed that the pSTS area’s BOLD response is increased with the learning as well. Along the same line, Bi and colleagues are trained their participants on face view dis-crimination task [24]. The learning modulation index which quantifies the neural processing changes related to learning, showed a significant correlation with be-havioral learning.
Regarding cellular mechanisms of perceptual learning-induced plasticity, it has been claimed that perceptual learning and long term potentiation (LTP) has similar traits [52]. LTP is one of the models of activity-dependent plasticity. The term refers to strengthened synaptic connections as a result of long-lasting stimulation. LTP is first shown in the hippocampus [53] and later research also showed in the amygdala [54], primary motor cortex [3] and sensory cortices [5, 55]. According to Aberg and Herzog’s view, repetitive stimulus presentation, in other terms perceptual training, directly or through visual perceptual learning causes visually evoked potentials (VEP) which in turn results in LTP. In terms of spatial precision, the most sensitive measurements are taken from animals. In a study, rats are trained with spatial frequency discrimination tasks. After the last training session, the animals’ life immediately terminated and electrical stimulation applied to the slices taken from V1. The amplitude of field excitatory postsynaptic potentials was higher in the training group compared to control group rats [56] which indicated LTP-like activity.
Aberg and Herzog’s view based on perceptual learning-related plasticity is shared by other scientists like Gilbert and Li [57, 9]. Furthermore, Gilbert and Li claim that LTP changes the long-range horizontal connections in the V1. The view claims that the long-range horizontal connections undergo axonal sprouting and axonal pruning during reorganization of V1. Supporting this view, recent research with primates using two-photon imaging showed that new long-range horizontal connections are established with visual perceptual learning [58]. In the study, two adult monkeys are trained with contour detection task. The V1 region was imaged in three different time points: before training, in the sixth week and eighth week of training. The results showed that at different time points new axonal branches are formed and some of the preexisting axonal branches are
sprouted.
1.3
Scope and Motivation of the Present Study
In neuroscience, the locus of plasticity has the importance to understand adult visual plasticity in depth. Despite the long-standing interest in neural mech-anisms of perceptual learning, the literature still contains conflicting results. Therefore, ”which brain region or regions assist perceptual learning?” is a still an open question. To answer this question we conducted behavioral and MR imaging experiments. Our participants are trained with bisection discrimina-tion task which is a frequently used task in the perceptual learning literature [52, 59, 60, 19, 61, 29]. For detecting how brain regions change their function as a result of this learning process, we collected task-based and resting-state fMRI data. While task-based fMRI show us how BOLD signal changes performing training task, resting-state fMRI inform us about the changes in the functional connectivity between brain regions.
As outlined in the previous sections, the literature showed that the BOLD signal showed different characteristics at different time points of the training [37, 38], therefore to get a full picture of the learning-related changes we also collected neural data at different time points. These time points were as follows before-learning, mid-learning, after-learning. Since a big portion of the learning occurs at the early phases, to capture changes which occur in the early phase of learning, we collected MRI data after third training session. Then, participants received five additional session of training to assure saturation of learning.
In our study, we used multimodal imaging by collecting task-based fMRI, rest-ing state fMRI, population receptive fields (pRF), Neurite Orientation Dispersion and Density Imaging (NODDI) and tractography. We believe that by virtue of high-resolution fMRI we will be able to capture the neuronal changes in the human cortex. In the extent of this thesis only, task-based and resting-state functional connectivity changes are assessed. Nonetheless, the output from pRFs will be
used to delineate sub-regions of the visual cortex. Together with the functional localizer and pRF delineation maps, we analyzed the perceptual learning-based functional changes in depth.
Chapter 2
Behavioral Experiment
2.1
Background
To train participants on perceptual learning, we have used line bisection discrimination task, which is used widely in the visual perceptual learning litera-ture [19, 61, 29, 62, 60, 63]. A research by Crist and colleagues [19] investigated specificity of bisection discrimination task. Bisection discrimination task consists three lines, participants’ task determine the middle line’s displacement direction. In this study, participants are trained with vertical bisection discrimination task in lower-left visual field. The practiced trial number in a day varied between 450 to 900 and participants completed three to five sessions in each week. However, authors did not specify how long the training lasted on average. As a result of training, all participants showed reduction in thresholds, the amount of reduction is varied between 22% to 71% with 51% mean. When participants thresholds are compared for horizontal bisection discrimination task in the trained visual region, the mean improvement decreased to 20% . Similarly, when authors compared the before-after thresholds in the untrained spatial locations with trained task, the reduction in the thresholds started to disappear as the distance from trained lo-cation got bigger. The researchers concluded improved performance with that bisection discrimination task is specific to trained task’s charactheristics.
Four years after Crist et al.’s study, another study assessed the specificity of the bisection discrimination task. In this experiment, participants trained with 450 trial in each day, for ten sessions. They tested how change in the configura-tion of the bisecconfigura-tion discriminaconfigura-tion task effects transfer. For this purpose, they tested transfer for the dot bisection discrimination task, tilted bisection discrim-ination task. The results showed that, even when orientation of the trained task changes for 10◦increased performance with training diminishes. Moreover, they also showed that changing the color or length of the stimulus also dissolve the learning effect [29].
One of the main purposes of choosing this stimuli is that we wanted to asses if there is a neural change in the conditions which shows specificity. As reviewed above previous research shows that bisection discrimination task is spe-cific to trained location, to replicate previous research we also collected data from different polar angles in the same eccentricity. Moreover, we also collected that from the trained spatial location and 90 ◦rotated task to test task specificity. Another purpose of choosing this stimuli is t have a stimulus which shares the receptive field properties of V1. As known for a long time, simple cells in V1 has elongated receptive fields, each V1 cell is responsive to certain orientations [64].
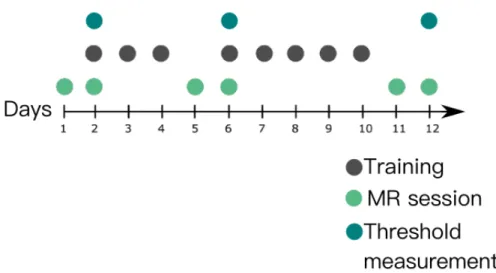
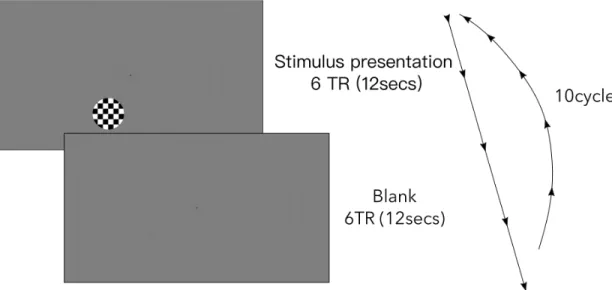
In behavioral experiment sessions, we collected participants threshold for training and control conditions. Number of days/sessions for training varies across studies, and there is not an exact conventional procedure for training in the lit-erature. However, a very common interval for training is 5 to 10 days in general. Accordingly, we determined 8 sessions and 12 days, which include 11 psychoph-sysics sessions which includes 8 training and 3 threshold measurement session and 6 fMRI sessions. The outline of the experiment is given in Figure 2.1
Figure 2.1: Outline of experiment. The data collected over 12 days. Baseline, in other saying pre-training MR measurements were taken when participants were naive. After second MR session, threshold measurements were assessed and then participants received their first training. After 3rd training session, the mid MR measurements and thresholds were taken. After 8th, last, training session MR and threshold measurements were collected again.
2.2
Method
2.2.1
Participants
Six participants participated in this study (5 female, 1 male, age range: 18-30, M=23,5, SD=4,46 ). Five participants were right handed. All participants had normal or corrected vision and, no history of neurological disorders. The study is approved by Bilkent University Human Ethics Committee. Before the experiment, all participants gave consent by signing informed consent forms. For each one hour, participants were promised to receive 15TL worth gift card. The gifts were promised to be given at very end of the experiment (after one month the training is completed).
2.2.2
Stimuli and Apparatus
The experiment is programmed in MATLAB2017 with using Psychtoolbox-3 [65, 66] Stimuli presented in NEC MultiSync LCD 2190UXp (21-inch, 1600x1200, 60Hz) monitor. Participants seated 95cm away from monitor, their heads immobilized with chin-rest.
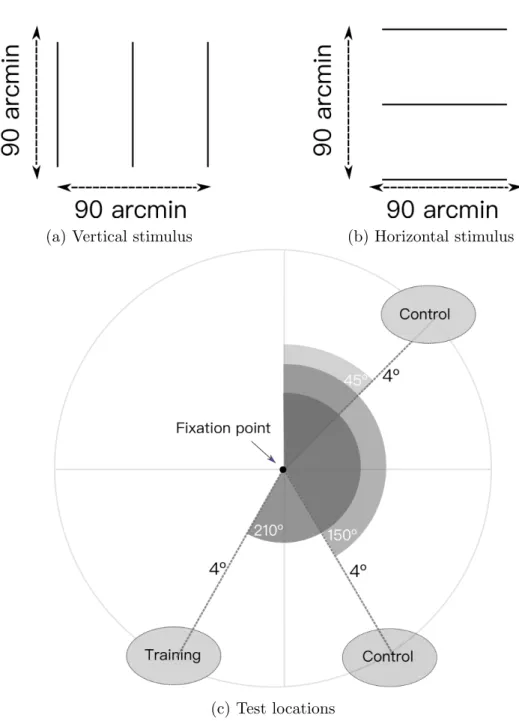
Bisection stimuli contained three vertical lines, the outer elements placed with 1.5◦distance. The length of lines was also 1.5◦. The central line of the bi-section stimulus placed slightly closer to one of the outer lines. The displacement direction of central line determined randomly in each trial. For determining the amount of the displacement, adaptive staircase method had been used [67].
The vertical bisection discrimination stimulus is presented with a gray background and a fixation point on the center of the screen. The fixation point and task stimulus are presented as black. In the training condition, participants trained at 210◦polar angle, vertically. Additionally, the experiment had five con-trol conditions in the behavioral sessions. The concon-trol conditions are as follow: 210◦polar angle horizontal stimulus, 150◦polar angle vertical, 150◦polar angle horizontal, 45◦polar angle vertical, 45◦polar angle horizontal.
The control conditions are used to evaluate task and location specificity of the learning. The participants did not receive training for these conditions but underwent threshold measurements at three different time points during the experimental time course as described in Figure 2.1.
2.2.3
Task and Experimental Design
In each trial, a black fixation point presented continuously. Participants are asked to fixate on the fixation point. The bisection stimulus presented for 300ms. After stimulus presentation, participants’ response obtained without time limit. In the vertical bisection task, the middle line placed closer to left or right line; in the horizontal bisection task, the middle line placed closer to upper or
(a) Vertical stimulus (b) Horizontal stimulus
(c) Test locations
Figure 2.2: Stimulus specifics: The height and width of the stimulus was 90’, which corresponds to 1.5 degree. The stimulus contained three lines. According to conditions, the lines appeared vertically (a) or horizontally (b). The middle point of stimulus was 4◦away from the fixation point. While polar angle of training location is 210◦, the 45◦and 150◦polar angles are used as control locations. For behavioral experiments, the threshold measurements are taken with vertical and horizontal stimulus at all of the three spatial locations. However, training was only done at 210◦polar angle with vertical stimulus.
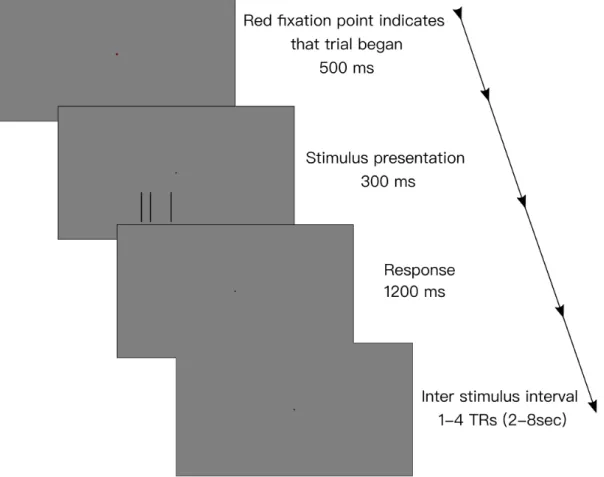
Figure 2.3: Time course of single trial in behavioral experiment: The stimulus presented for 300 ms. After stimulus presentation, a blank screen with only fixation point appeared to wait participants response. Participants responded using the direction keys on the keyboard. After response is collected 300ms break was given before presenting the next trial. The visualized trial is belongs to the training condition.
lower line. In a two- forced alternative choice (2AFC) task, participants asked to indicate the central line’s displacement by pressing direction keys on the key-board. The next trial initiated 300ms after the participant responded. Test line displacements are determined according to participant’s response history with two 3-up 1-down staircases. Figure 2.3 shows the temporal configuration of the stimulus.
Threshold measurement: Threshold measurements were acquired before training (1st measurement), after third session of training (2nd measurement), after training completed (3rd measurement). In each measurement session, par-ticipants completed 150 trials for each condition. The threshold measurements were obtained from three different polar angle with both vertical and horizontal
bisection task. The sorting of the conditions was randomized for each participant.
The staircase method comprised two staircases: easy and hard. Each staircase consisted of 75 trials, which results in 150 trials in one threshold mea-surement block. The easy staircase started with 0.5◦and the hard started with 0.08 degree, step size was 0.05◦for both of the staircases .
Training session: In each training session, participants completed 10 blocks, each of them containing 120 trials. There were 8 training sessions in the experiment which results in 9600 trial for each participant. In the training blocks, the stimulus presented at 210 polar angle, vertically. The test intensities are determined with 3up-1down staircases. The starting values of staircases and the step size was identical to threshold measurement staircase values, as stated above.
Training sessions conducted on a daily basis except the one day break between third and fourth session of training. The break is given in order to collect MRI data.
2.2.4
Data Analysis
Behavioral analyses are conducted on MATLAB2017b, using Psignifit4 [68] toolbox. Psychometric function are fitted with Weibull function. To compare the thresholds, repeated measures ANOVA performed. Statistical analysis is performed using JASP software [69].
2.3
Results
2.3.1
Training condition
The pre-training measurements showed that the mean thresholds for ver-tical bisection discrimination task presented at 210◦polar angle was 4.35 arcmin (SD=1.01). The mid-training threshold which were taken after third session of training, measurements showed that the mean threshold decreased to 2.90 arcmin (SD=0.83). One day after training ended, post-training measurements were taken. The results showed that the mean threshold increased to 4.56 arcmin (SD=1.83). For descriptive figure for training condition please see Figure 2.4.
The 3x1 repeated measures ANOVA test, independent variable was session (with 3 levels: pre-learning, mid-learning and post-learning) revealed effect of ses-sion in the training condition (210◦polar angle, training stimuli) (F(2,10)=4.35, p=0.04), please see table 2.4. The post-hoc analysis on session, did not reveal any effect between sessions (please see Table 3.1).
Table 2.1: Within Subjects Effects
Sum of Squares df Mean Square F p Session 9.750 2 4.875 4.348 0.044 Residual 11.212 10 1.121
Table 2.2: Post Hoc Comparisons - Session
Mean Difference SE t pholm
Mid Post -1.655 0.643 -2.574 0.100 Pre -1.446 0.458 -3.155 0.076 Post Pre 0.210 0.705 0.297 0.778 Note. Bonferroni adjusted confidence
Figure 2.4: Threshold changes across visual locations with horizontal task.
2.3.2
Control Conditions
2.3.2.1 Location Specificity
The location specificity was evaluated by comparing threshold changes in the control locations (150◦and 45◦polar angle), with vertical discrimination task. The descriptive information regarding to vertical conditions are given in Table2.4 and Figure 2.4.
Table 2.3: Descriptives for vertical bisection discrimination thresholds
Session Location Mean SD N Pre 210 polar angle 4.350 1.011 6 150 polar angle 4.919 1.479 6 45 polar angle 7.775 2.098 6 Mid 210 polar angle 2.904 0.831 6 150 polar angle 3.068 1.398 6 45 polar angle 7.104 2.449 6 Post 210 polar angle 4.559 1.816 6 150 polar angle 3.806 1.020 6 45 polar angle 5.425 1.506 6
To assess location specificity, repeated measures of ANOVA performed . The ANOVA test had a factorial design with two independent variables, session(with 3 levels: pre-learning, mid-learning and post-learning) and loca-tion(with 3 levels: 210◦, 150◦and 45◦polar angle). The results of ANOVA showed
Figure 2.5: Threshold changes across visual locations with horizontal task.
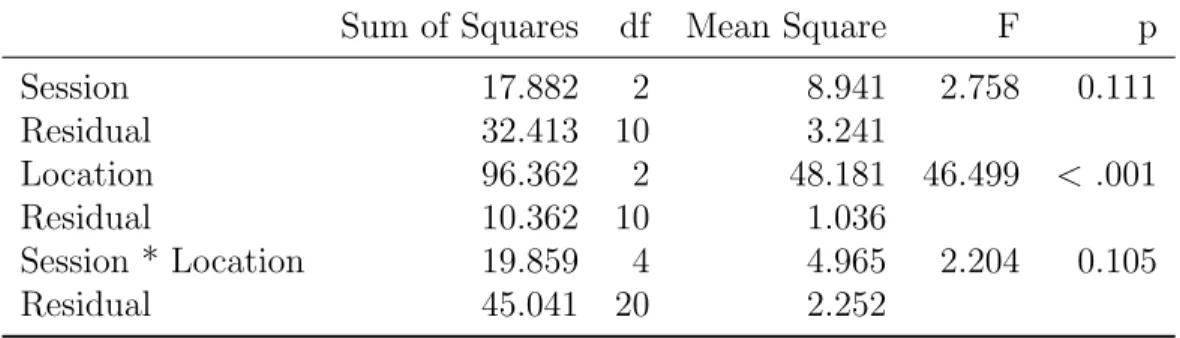
effect of location (F(2,10)=46.50, p= 0.0000270). There was no effect of session (F(2,10)=2.76, p=0.11). Interaction of session and location was also insignificant (F(2,10)=2.20, p=0.11) The simple main effects analysis showed session’s effect on 210◦and 150◦polar angle locations was significant (F(2,10)=4.35 ,p=0.04 and F(2,10)=4.42, p=0.04). For the 45◦polar angle condition, the simple effect of session was insignificant (F(2,10)=1.61, p=0.25).
Table 2.4: Within subjects effects for vertical bisection discrimination thresholds
Sum of Squares df Mean Square F p Session 17.882 2 8.941 2.758 0.111 Residual 32.413 10 3.241 Location 96.362 2 48.181 46.499 < .001 Residual 10.362 10 1.036 Session * Location 19.859 4 4.965 2.204 0.105 Residual 45.041 20 2.252 2.3.2.2 Task Specificity
To test task specificity, threshold measurements with horizontal bisection discrimination task evaluated. The horizontal bisection discrimination thresholds were taken in 210◦, 150 ◦and 45◦polar angles. Descriptive information regarding to this threshold measurements are given in Table 2.5 and Figure 2.5.
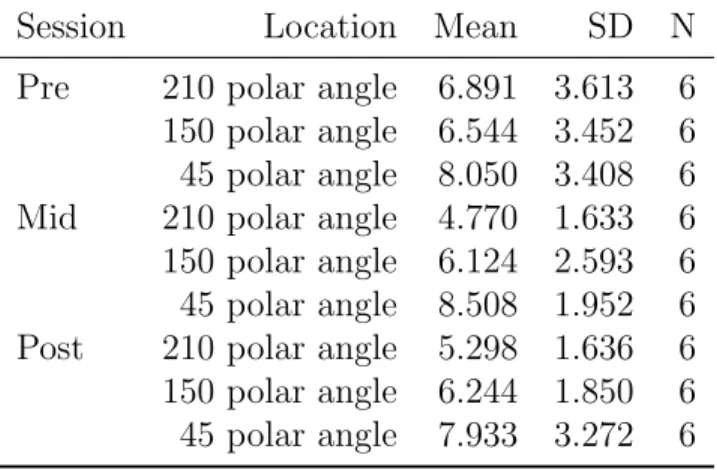
Table 2.5: Descriptives for horizontal bisection discrimination thresholds
Session Location Mean SD N Pre 210 polar angle 6.891 3.613 6 150 polar angle 6.544 3.452 6 45 polar angle 8.050 3.408 6 Mid 210 polar angle 4.770 1.633 6 150 polar angle 6.124 2.593 6 45 polar angle 8.508 1.952 6 Post 210 polar angle 5.298 1.636 6 150 polar angle 6.244 1.850 6 45 polar angle 7.933 3.272 6
Task specificity assessed with repeated measures of ANOVA test us-ing horizontal bisection discrimination task thresholds. The ANOVA test had a factorial design with two independent variables, session(with 3 levels: pre-learning, mid-learning and post-learning) and location(with 3 levels: 210◦, 150◦and 45◦polar angle). The ANOVA results showed that there were no effect of location(F(2,10)=3.86, p=0.06) and session
Chapter 3
Task Related Functional
Magnetic Resonance Imaging
3.1
Background
The functional MR imaging developed three decades ago and has been used extensively in neuroscience research thanks to its non-invasive nature. In visual perceptual learning, task-based fMRI has been used widely to examine which brain regions are related to the learning process. Moreover, scientists assessed how the functional properties are changed in the perceptual-learning related regions.
As reviewed earlier, previous research showed that with learning, the func-tional properties of various brain regions had changed [40, 70, 71, 28, 72, 73, 21, 74, 24, 35]. To investigate changes in the BOLD signal, we collected fMRI data while participants performing a bisection discrimination task in the scanner. The task-related fMRI data collected at trained (210 polar angle) and untrained lo-cations (45 and 150 polar angle) with trained task (vertical stimulus) to examine how location specificity is represented in the BOLD signal. Moreover, we also collected data with rotated stimulus(horizontal bisection discrimination task) at
trained (210 polar angle) and untrained (45 polar angle) locations, to test the task specificity. For a more sensitive analysis, we collected functional localizer and pRF data. From the intersection of these two analysis, we obtained stimu-lus processing functional ROIs for each visual subregion. After that, the BOLD amplitude and the shape of hemodynamic response function have assessed.
3.2
Methods
3.2.1
Participants
Participants who attended the behavioral sessions, also attended to all MRI sessions. However, one of the subject’s data did not analyzed, because functional localizer runs did not show significant activation for progress further steps of analysis. By excluding this subject, the mean of subjects’ (5 female) age became 22,75 and the standard deviation became 4,60. Before every MR session, participants were given informed consent form. For each hour spent in the MR sessions, participants are promised of 25TL worth gift card. The gift card given at the very end of experiment (after the final session).
3.2.2
MRI Data Acquisition
3.2.2.1 Apparatus
The data collected at the National Magnetic Resonance Research Center (UMRAM), Bilkent University. MRI data collected on a Siemens Tim Trio 3T scanner with a 32-channel phase array head coil. The stimuli was displayed on a MR compatible LCD monitor (TELEMED, 1920 X 1080 pixel, 32 inch). Partici-pants looked the monitor through a mirror placed above their eyes. The viewing distance from the scanner was 168cm. Participants’ response is transmitted by a MR compatible response pad (Current Design, fORP 904 fMRI trigger and
response system).
3.2.2.2 MRI Acqusition Parameters
Anatomical images are collected with an T1-weighted 3D MPRAGE squence (1x1x1 mm3 resolution, TE: 3.02 ms, TR: 2600 ms, FOV read: 256, FOV phase: 87.5, flip angle: 8 degrees). For functional scans, T2*-weighted se-quence is used (1.6x1.6x1.6 mm3 isotropic voxel, TR:2000ms, TE:42.8ms, Flip
Angle: 80 degrees, Slice thickness: 1.6mm, Number of Slices: 76, FOV:192mm, Multiband factor: 4, EPI factor: 120).
For distortion correction, two images which have opposite phase encoding direction, in other saying blip-up blip-down data, has collected in the anterior-posterior and anterior-posterior-anterior direction. The blip-up blip-down data is col-lected with a gradient echo EPI sequence (1.6x1.6x1.6 isotropic voxel, TR:10484, TE:76.6, Flip Angle:80, FoV:192mm, Slice number:76, Multiband factor: 1, EPI factor: 120).
3.2.2.3 Functional Localizer Scan
To determine region of interest, for each stimulus location (45, 150, 210 polar angles) that are used in the task-based fMRI, a functional localizer scan obtained. The functional localizer runs are conducted in separate runs for each location, the order of runs are randomized. A circle flickering (at 10 Hz) checker-board stimulus which has 90’ size was used. For each test location a separate run has carried out. The localizer scan had 10 repetition of 12TR length blocks. At the beginning of the scan, 5TR dummy scans collected to ensure signal is saturated and 6TR rest collected. In each block, 6TR checkerboard stimulus pre-sented, then 6TR of rest period initiated, meaning no stimulus is presented. After 10 blocks, 5TR of overrun images are collected. Each run lasted 136TR, equals to 4minutes 32 seconds. During whole functional localizer scan, participants fixated on the fixation point in the middle of the screen. While the functional localizer
Figure 3.1: Experimental design of functional localizer scan. The scan had block design. In each block, 6TR (12 seconds) a checkerboard stimulus flickering at 10Hz presented. After stimulus presentation 6TR (12seconds) break were given. This cycle is repeated for 10 times.
scans were carried out, to ensure participants are looking to the fixation point, a fixation task has been performed. Participants indicated the color of the fixation point by pressing the assigned button on the response box. A visual representa-tion of localizer run is given in Figure 3.1.
3.2.2.4 Task Based fMRI Stimuli and Task
For the behavioral task which was performed in the scanner, the parame-ters of the behavioral task are revised. The stimulus size was 90’ and eccentricity was 4◦, as in the behavioral experiments. The task based scan contained 5 runs, each of the runs containing one condition. The scanned conditions were train-ing condition(vertical-210 polar angle stimulus), control 1 (vertical-45 polar angle stimulus), control 2(vertical-150 polar angle stimulus), control 3 (horizontal-210 polar angle stimulus), control 4 (horizontal-45 polar angle stimulus) conditions. The order of task based fMRI scans is counterbalanced between participants.
Method of constant stimuli was used, the middle line presented at 6,12 and, 18 arcmin away from the middle of the outer lines. The direction and amount of displacement was randomized for each run. Each run consisted of 48 trials, 8 trials for test line displacement. At the beginning of each run, 5TR dummy runs were collected to ensure signal is saturated. Then for 6TR rest data obtained. Rapid event related design is used in the fMRI experiment. Each event lasted one TR, at the beginning of the trial the fixation point turned red for 500ms to indicate test stimulus will be presented soon. Then test stimulus presented for 300ms, response duration is limited with 1200ms. Participants indicated the direction of displacement by pressing the assigned button on response boxes. After each event, jittered inter-stimulus interval is given which varied between 1 and 4 TR. A visual representation of time course of a trial is given in the Figure 3.2. After all trials completed, 5TR overrun collected in order to capture signal fully. Each run lasted 185TRs which equals to 6minute 22seconds.
3.2.3
MRI Data Analysis
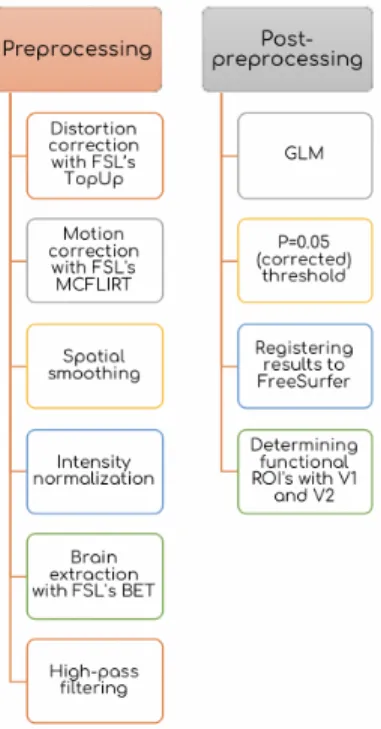
3.2.3.1 Preprocessing
Anatomical Surface Reconstruction: The high-resolution anatomical im-ages are skull stripped, segmented to white and gray matter, normalized for inten-sity and smoothed, surface reconstructed by using FreeSurfer’s recon-all command [75].
Functional Scan Preprocessing: Before starting preprocessing, five volumes are deleted in order to assure signal quality. For distortion correction, FSL’s TopUp has been used to unwarp each functional run. After distortion correction FSL’s FMRI Expert Analysis Tool (FEAT) version 6.00 has been used. FMRI data registrated to each subject’s own anatomical images and standard MNI152 spaces using FSL’s FLIRT. Motion correction applied to functional images using FSL’s MCFLIRT and spatial smoothing (Gaussian kernel, FWHM 5mm) and high pass filtering applied. The intensity normalisation applied by using a single
Figure 3.2: Time course of single trial in task based fMRI scan. Before stimulus presentation, the fixation point turned red for 500ms to indicate that the stimulus will be presented soon. Then, the stimulus presented for 300ms. Participants were given 1200ms for response. After trial ended, blank screen with only fixation point presented until the inter stimulus interval has ended. The inter stimulus interval is jittered between 1-4TR (2-8 seconds)
multiplicative factor. The brain is extracted from functional scans using brain extraction tool (BET).
3.2.3.2 First Level Analysis
Functional Localizer Scans: The General Linear Model (GLM) applied with using FSL’s FEAT. For removing the temporal autocorrelations, FILM prewhitening applied. For thresholding data, P=0.05 (corrected) threshold set as cut point.
Task Based fMRI scans: The analysis is conducted at MATLAB using cus-tom code. From the preprocessed task based run raw signal timecourse extracted. Then, the mean of each ROI, z-scored and detrended. For estimating BOLD am-plitude, Pernet’s percent signal change formula is adapted to our experiment [76]. To determining signal change due to task, the baseline signal which corresponds to 12 second rest measurement, extracted from the mean of the signal after 2 seconds of stimulus onset.
3.2.3.3 Second Level Analysis
For comparing the diffeerent time-points, repeated measures of ANOVA had performed using JASP software.
3.3
Results
To asses the changes occur during the task we used functional ROI’s de-rived from pre-training functional localizer runs. To separate functional regions to visual regions, we planned to use visual region borders which derived from pRF analysis. However, the pRF analysis did not yield sufficient measurements for de-lineation of visual areas for all subjects. Therefore, to be consistent FreeSurfer’s
Figure 3.3: Functional localizer scan analysis pipeline
(a) sub-01 left hemisphere (b) sub-02 left hemisphere
(c) sub-04 left hemisphere (d) sub-05 left hemisphere
(e) sub-07 left hemisphere
Figure 3.5: Left-hemisphere functional ROIs.The green region represents V1 bor-der, the ocean-blue represents V2 border. V1 and V2 borders are drawn by Freesurfer in subject’s native anatomical space. 150◦polar angle functional local-izer activation’s intersection with visual regions are represented with Turkish-blue in the V2 region and red in the V1 region. 45 ◦polar angle functional localizer activation’s intersection with visual regions are represented with white in the V2 region and yellow in the V1 region. All the functional localizer scans are derived from pre-learning scans except sub-04. In sub-04’s pre-session localizer scans did not yield reliable results, therefore, post-session localizer runs are used to identify
(a) sub-01 right hemisphere (b) sub-02 right hemisphere
(c) sub-04 right hemisphere (d) sub-05 right hemisphere
(e) sub-07 right hemisphere
Figure 3.6: Right-hemisphere functional ROIs.The green region represents V1 border, the ocean-blue represents V2 border. V1 and V2 borders are drawn by Freesurfer in subject’s native anatomical space. 210 ◦polar angle functional localizer activation’s intersection with visual regions are represented with dark-magenta in the V2 region and black in the V1 region.
Figure 3.7: BOLD amplitude change for the training condition
anatomic delineations of V1 and V2 regions are used to divide functional localizer to visual regions.
3.3.1
Training condition
A 2x3 repeated measures ANOVA was conducted to investigate the effect of brain region (with 2 levels: V1 and V2) and the scanning session(with three levels: pre-learning, mid-learning, and post-learning). Session (F(2,8)= 6.62, p=0.02) had effect. On the other hand, there is no effect of region(F(1,4)=0.14, p=0.73). Post-hoc test on session, did not show any effect,too (please see Table 3.1)
Table 3.1: Post Hoc Comparisons - Session
Mean Difference SE t pholm
Mid Post 0.814 0.275 2.960 0.083 Pre 0.739 0.193 3.835 0.056 Post Pre -0.075 0.266 -0.282 0.792
(a) 45◦polar angle (b) 150◦polar angle
(c) 210◦polar angle
Figure 3.8: BOLD amplitudes for vertical bisection discrimination tasks. Each plot shows one of the test locations. 45◦polar angle presented at the a, 150◦polar angle presented at the b and 210◦polar angle presented at the c.
3.3.2
Control Conditions
3.3.2.1 Location Specificity
A 3x3x2 repeated measures ANOVA was conducted to investigate the ef-fect of session (with 3 levels: pre-learning, mid-learning and, post-learning), loca-tion (with 3 levels: 210◦, 150◦, and 45◦polar angle), region(with 2 levels: V1 and V2). There was no effect of session (F(2,8)=0.54, p=0.60), location (F(2,8)=0.19, p=0.83), and region(F(1,4)=0.06, p=0.82). The descriptive plots of conditions are given in Figure 3.8.
(a) 45◦polar angle (b) 210◦polar angle
Figure 3.9: BOLD amplitudes for horizontal bisection discrimination tasks. The plot on the left (a) shows BOLD amplitude while participants performing hori-zontal bisection discrimination task at 45◦polar angle, 210◦polar angle shown on the right(b).
3.3.2.2 Task Specificity
A 3x3x2 repeated measuresANOVA analysis performed with the same de-sign as 3.3.2.1 section, except in this analysis, location had two sub-levels as 210◦and 45◦polar angle. There was no effect of session (F(2,8)=0.64, p=0.55), lo-cation (F(1,4)=0.36, p=0.58), and region(F(1,4)=0.38, p=0.57). The descriptive plots of BOLD amplitude in the horizontal conditions given in the Figure 3.9.
3.4
Intermediate Discussion
In this part of the thesis, we obtained task-based fMRI data before-training, mid-training and post-training. The BOLD amplitude while partic-ipants performing training task changed between sessions. However, post-hoc tests did not reveal any effect.
For the control conditions, the analysis which examines neural effects of location specificity showed that neither 150◦polar angle vertical discrimination task nor 45◦polar angle task did not show any significant change between sessions. Furthermore, task specificity control conditions that participants are performed horizontal bisection discrimination task, did not yield any significant changes
between sessions.
Overall, the analysis of task-based fMRI data did not showed any signifi-cant evidence across perceptual training in terms of BOLD amplitude in the V1 and V2 regions. However, given that our sample size is very small, this might introduced noise into the data. Increasing sample size would clarify the results.
Chapter 4
Resting State Functional
Magnetic Resonance Imaging
4.1
Background
Almost three decade ago, Biswal and colleagues instructed participants to rest in the scanner and collected functional MRI images [77]. The correlation analysis of this data showed that timecourse of a seed region selected from left motor cortex, had correlated with other brain regions’ timecourses in the motor system. The findings of this research has been replicated with numerous studies [78].It has been believed that, the correlations in the timecourses represented the functional communications in the anatomically distant brain regions.
In terms of plasticity, previous researches has shown functional connectiv-ity changes with training. Guerra-Carrillo and other researchers reviewed and evaluated over ten studies which focused on changes in the resting state func-tional connectivity in time-course of learning. They concluded that, resting-state
functional connectivity can capture the experience-dependent changes in the func-tional arthitecture. [79]. Moreover, as reviewed in the Introduction chapler (Sec-tion 1.2.1.), visual perceptual learning studies also showed change in the func-tional connectivity in resting state networks [48, 45] and connectivity between visual areas [48, 49].
4.2
Method
4.2.1
Participants and MRI Acqusition Parameters
The information related to participants were given in 2.2.1 and 3.2.1 Par-ticipants sections and information regarding to MR sessions were given in the 3.2.2.2 MRI Acqusition Parameters section.
4.2.2
Resting State fMRI Protocol
In resting state scan, 305 volumes (approximately 10minutes) are obtained. Participants instructed to fixate gray fixation point on the black background and asked to think nothing specific and remain passive. Resting state scans were obtained first in each MR session to avoid confounds.
4.3
Analysis
4.3.1
Preprocessing
Before starting preprocessing, five volumes are deleted in order to assure signal quality. For distortion correction, FSL’s TopUp has been used to unwarp each run. After distortion correction, motion correction applied using FSL’s
Figure 4.1: Resting-state functional connectivity analysis pipeline
MCFLIRT. Then, high-pass filtering (0.005 Hz) applied to the data. Then by using ICA-AROMA the data denoised.
4.3.2
Functional Connectivity Analysis
For analyzing functional connectivity, Pearson’s linear correlation coef-ficient is calculated between each functional ROI. The process of determining ROI’s are explained in the Section 3.3. Correlation coefficients are converted using Fischer’s r-to-z transformation.
4.3.3
Second-level Analysis
For comparing different timepoints, 3x3 repeated measures of ANOVA carried out tested location ( with 3 levels: 210◦, 150◦, 45◦polar angles) and session
Figure 4.2: Connectivity changes across sessions.
(with 3 levels: pre-learning, mid-learning, post-learning). The results showed significant main effect of session (F(2,8)=28.72, p=0.000223). The main effect of location was insignificant (F(2,8)=0.64, p=0.64). Post Hoc comparison showed that post session was significantly different from pre session (p= 0.000939, Holm corrected) and from mid session (p= 0.00396, Holm corrected). Moreover, simple main effect analysis showed that 210◦(p <0.05) and 150◦(p <0.005) polar angle are significantly changed between sessions. Descriptive plot visualizing group means are given in Figure 4.2.
4.4
Intermediate Discussion
The analysis of the resting-state functional-connectivity between V1-V2 regions which process 4◦eccentricity conducted. The results showed statistically significant changes in 210◦which is the training condition. Previous research also supports this findings [48, 49]. Furthermore, 150◦polar angle in the post-training session also showed significant change between sessions. Besides, there was no significant change between pre-training and mid-training conditions at these locations.
the opposite hemisphere because of inter-hemispheric connections. The simple main effect analysis revealed that, there is no significant effect of session on 45◦polar angle. Since 45◦polar angle is free from inter-hemispheric connections, it also supports the our previous interpretation.
The most notable finding from this analysis that, while functional con-nectivity changes did not show any significant change between pre-training and mid-training sessions, strong changewas seen at the late phases of the perceptual training.
Chapter 5
General Discussion
The main purpose of this study was to examine the functional changes through the visual perceptual learning process. For this purpose, we investigated the effect of learning, task specificity, location specificity in V1 and V2 regions. Our results showed that learning changed thee task-based fMRI response and resting-state functional connectivity. Previous research on this matter reports inconsistent results. While some researchers report change in the responsiveness to the trained stimuli [15, 73, 21], there are also reports which did not find such a change [38, 24]. Therefore, the contribution of early visual areas for the accommodation of visual perceptual learning and its mechanisms are still in question. In order to reveal the early visual areas’ role in visual perceptual learning, participants received perceptual training and in the course of learning, we collected task-based and resting-state fMRI data.
Participants are trained with a bisection discrimination task at 210◦polar angle, 4◦eccentricity with vertical stimulus. The threshold measurements with the training stimulus settings showed that the discrimination threshold scaled-down, the post-learning threshold results turned back to pre-learning levels. This finding is contradicting with the literature, usually, perceptual learning’s effect shown to be long-lasting, persistent over the years [26, 80]. Unlearning a visual skill which is learned, did not reported before. To have a deeper understanding
about the training, we represented our whole training data in the Appendix, Fig-ure A.2. As we can see from that figFig-ure, the thresholds from each training block shows great fluctuations, the fluctuations got bigger after mid-learning measure-ments. One exceptional characteristic of our experiment is the long-lasting and time-consuming nature of it with the additional MR sessions. Our psychophysics measurements show similarity with other studies which reported achievement of perceptual learning[19, 29]. Previous researches which trained participants with the bisection discrimination task had varying daily trial numbers from 450[29, 19] to 1600[81], and the total trial numbers are varied between 1200[63] to 10000∼ (authors did not specify the exact number)[19]. Our training regime included 800 trials per day and eight training sessions. Yet, each MR session in our experiment took around 1.5 hours and there were totally 6 MR sessions. This might caused decreased motivation and hence attention. The effect of attention on threshold measurements is shown before[82, 83]. Given that our experiment occupied par-ticipants for almost two weeks, contained six exhaustive MR sessions, at the very end of the experiment our participants might had fatigue, hence as the experi-ment proceeded, their performance might got affected by lack of motivation and attention.
Another behavioral aspect of our study was assessing classical perceptual learning’s specificity, for this purpose we had five behavioral control conditions. The control conditions were contained two additional polar angles which are 210◦and 45◦, and horizontal bisection discrimination task. While control loca-tions are used to assess location specificity, the horizontal task used to evaluate task specificity. We observed a threshold decrease at vertical 150◦polar angle condition, which is the mirror location, at mid-learning sessions, like the training condition, threshold decrease effect is diminished at the post-learning session. As discussed earlier the post-learning measurements might not reflect the actual per-formance of the participants and fatigue might create a confound. Regarding the threshold decrease between pre-learning and mid-learning sessions at 150◦polar angle with the vertical task, inter-hemispheric connections might be a possible explanation for it. It is known that, mirror positions in the visual cortex share callosal connections [84]. Neurons at the vertical 150◦polar angle, 4◦eccentricity