Contents lists available atScienceDirect
Bioresource Technology
journal homepage:www.elsevier.com/locate/biortech
Combustion behaviors of spent mushroom substrate using MS and
TG-FTIR: Thermal conversion, kinetic, thermodynamic and emission analyses
Jianli Huang
a, Jingyong Liu
a,⁎, Jiacong Chen
a, Wuming Xie
a, Jiahong Kuo
a, Xingwen Lu
a,
Kenlin Chang
a,b, Shaoting Wen
a, Guang Sun
a, Haiming Cai
a, Musa Buyukada
c, Fatih Evrendilek
c,daSchool of Environmental Science and Engineering, Guangdong University of Technology, Guangzhou 510006, China bInstitute of Environmental Engineering, National Sun Yat-Sen University, Kaohsiung 80424, Taiwan
cDepartment of Environmental Engineering, Abant Izzet Baysal University, Bolu 14052, Turkey dDepartment of Environmental Engineering, Ardahan University, Ardahan 75002, Turkey
A R T I C L E I N F O
Keywords:
Spent mushroom substrate Combustion
TG-FTIR TG-MS
Iso-conversional methods
A B S T R A C T
The present study systematically investigated the combustion characteristics of spent mushroom substrate (SMS) using TG-MS (thermogravimetric/mass spectrometry) and TG-FTIR (thermogravimetric/Fourier transform in-frared spectrometry) underfive heating rates. The physicochemical characteristics and combustion index pointed to SMS as a promising biofuel for power generation. The high correlation coefficient of the fitting plots and similar activation energy calculated by various methods indicated that four suitable iso-conversional methods were used. The activation energy varied from 130.06 to 192.95 kJ/mol with a mean value of 171.49 kJ/ mol using Flynn–Wall–Ozawa and decreased with the increased conversion degree. The most common emissions peaked at the range of 200–400 °C corresponding to volatile combustion stage, except for CO2, NO2and NO. The
peak CO2emission occurred at 439.11 °C mainly due to the combustion offixed carbon.
1. Introduction
The disposal of spent mushroom substrate (SMS) as the byproduct of mushroom cultivation industry has created a public health concern due to a growing rate of its waste generation in China. Heilongjiang, a province of China, alone generates 2.5 million tons of SMS per 6 million tons of mushroom production annually (Meng et al., 2018b). The an-nual generation rate of SMS was estimated at 13.2 million (Meng et al., 2017) and has started to exceed its application rate for the feedstock, bioremediation of contaminated soils, and agricultural soil amendments (Zhang et al., 2017; Nakatsuka et al., 2016). However, the traditional disposal methods of compost and landfill are not sustainable to deal with excessive SMS due to its slow decomposition rate. Its high salt, nitrogen and phosphorus contents further limit its application due to the pollution of underground and surface water resources (Slezak et al., 2018). There exists an urgent need tofind a clean and low-cost tech-nique to continue the sustainable development of mushroom industries. SMS usually consists of residual mushroom mycelia, wood chips, hydrocarbons, and residual nutrients including nitrogen, phosphorus, and potassium (Meng et al., 2018a). The presence of recalcitrant (dif-ficult-to-decompose) carbon content renders SMS not suitable for its traditional disposal unless it is co-composted with other biomass to
improve their properties (Meng et al., 2018b). Not only does the im-proper management of excessive SMS cause environmental pollution but also it expends the opportunity of using it as a cheap, renewable and abundant biofuel (Dhyani et al., 2018; Kapu et al., 2012). SMS was reported to be rich in cellulose (38.7%), hemicelluloses (18.4%), and lignin (20.2%) and to have higher volatile matter and lower ash con-tents than does bituminous coal (Zhu et al., 2013; Zhou et al., 2016). This indicates a better burned out performance for SMS and promising opportunities for advanced thermal conversion technologies appear to achieve energy and environmental securities.
The thermochemical methods including (co-)combustion, (co-)pyr-olysis, and (co-)gasification are commonly used to optimize the con-version of chemical energy stored in biomass wastes to fuel (Gao et al., 2013; Huang et al., 2016). Electricity generation, and reductions of greenhouse gas emissions, air pollutants, and solid waste volume are the main advantages of the advanced biomass combustion process equipped with an efficient incineration system (Mladenović et al., 2018). On account of being renewable, CO2 neutral and low in the
emission of air pollutants, biomass may be relied on as a com-plementary to fossil fuels in order to reduce their role in total energy consumption (Wang et al., 2016). In so doing, however, the availability, chemical composition, and blend ratio of biomass, and the heating
https://doi.org/10.1016/j.biortech.2018.06.106
Received 28 May 2018; Received in revised form 28 June 2018; Accepted 29 June 2018
⁎Corresponding author.
E-mail addresses:[email protected],[email protected](J. Liu).
Available online 02 July 2018
0960-8524/ © 2018 Elsevier Ltd. All rights reserved.
rates, residence time, reaction temperature, kinetics, and thermo-dynamic behaviors of the thermochemical process need to be taken into account concurrently for the design and optimization of reactors, in-cinerator, and exhaust gas purification facilities (Müsellim et al., 2018). Non-isothermal thermogravimetric analysis (TGA) is regarded as the most effective, less expensive and simplest technique to study the thermal decomposition behavior of the combustion process (Mureddu et al., 2018; Müsellim et al., 2018). Thus, the thermal decomposition variables and optimum operational conditions of biomass can be de-termined under a range of heating rates. The mass loss, decomposition rate, and heatflow of biomass samples can be monitored in real time using a thermal analyzer to obtain thermogravimetric (TG), derivative thermogravimetric (DTG) and differential scanning calorimetry (DSC) curves during the thermal degradation process. From these curves, significant combustion properties such as peak temperature (TP), and
maximum mass loss rate (−RP) can be also derived. DSC curves were
utilized to quantify the exothermic and endothermic behaviors during combustion. The model-free methods such as Flynn–Wall–Ozawa (FWO), Kissinger-Akahira-Sunose (KAS), distributed activation energy model (DEAM), and Kissinger have been more widely used than did the model-fitting approaches in order to obtain accurate kinetic parameters such as apparent activation energy (Ea), and the other thermodynamic
parameters calculated from Ea including pre-exponential factor (A),
Gibbs free energy change (ΔG), entropy change (ΔS), and enthalpy change (ΔH).
The introduction of TGA coupled with mass spectrometry (TG–MS) enabled emissions of common gases such as H2, CH4, CO, CO2, NOX,
and SO2from the combustion process to be quantified. In addition,
Fourier transform infrared spectrometry (TG–FTIR) measures the var-ious functional groups in real time during the thermal degradation (Luo et al., 2017). Therefore, the coupled MS and FTIR can be more feasible to evaluate the gas phases of complex mixtures during the combustion of SMS. Many studies have investigated the pyrolysis and compost technologies of SMS (e.g.,Meng et al., 2017; Jiang et al., 2014, 2017). However, there exists no study focusing on thermal degradation beha-viors of SMS and its gaseous products evolved during its combustion, the most important and mature technology commonly used in biomass treatment systems. Experimental studies are needed to pose the po-tential of SMS as an alternative biofuel and to optimize the industrial scale combustion technologies for SMS.
The objectives of this study were to (1) estimate the kinetic beha-viors of the SMS combustion using a TG analyzer under thefive heating rates (5, 10, 15, 20 and 25 K/min); (2) evaluate its feasibility as a po-tential biofuel computing the ignition (Di), burnout performance (Di),
flammability (C), and comprehensive combustion (S) indices; (3) un-derstand the exothermic characteristics of SMS oxidation reaction; (4) compute the thermodynamic parameters (Ea, A,ΔG, ΔS, and ΔH) using
the iso-conversional methods (FWO, KAS, DAEM and Kissinger); and (5) identify gaseous products in real time using the TG-MS and TG–FTIR techniques.
2. Materials and methods
2.1. Preparation and physicochemical analyses of samples
The samples used in this study were collected from a mushroom industry in Xiamen of the Fujian province of China after the last cycle harvest of mushroom wasfinished. After the removal of their moisture by naturally drying, the samples were crushed and then all passed through a sieve with a mesh size of 74μm. The particles were put into an oven at 105 °C for 24 h to lower their moisture content and stored in a desiccator for the experimental runs.
The proximate and ultimate analyses were conducted to determine the components and elements of SMS. The contents of moisture (M, 8.89%), ash (A, 10.90%) and volatile matters (VM, 62.93%) were
de-termined according to The Proximate Analysis of Solid Biofuels of China
(GB/T 28731-2012), whilefixed carbon (FC, 17.28%) was calculated from the following equation: FC = 100−(M + A + VM) (Mishra and
Mohanty, 2018). The major elements (C 42.49%, H 5.80%, N 2.15% and S 0.10%) were tested using an elemental analyzer (Vario EL cube by Elementar), while O content (29.67%) was calculated thus: O (%) = 100%-C-H-N-S-M-A (Xie et al., 2018b).
2.2. TGA/DSC experiments
The thermogravimetric analyses coupled with the TGA/DSC ex-periments were carried out using a TG analyzer (NETZSCH STA 409 PC) at thefive heating rates of 5, 10, 15, 20 and 25 K/min in air atmo-sphere. A blank experiment was conducted following each condition to obtain the baseline to reduce the systematic errors. To ensure the ex-perimental repeatability, reaction conditions were conducted at least twice and found to vary within 2% between the experiments. About 5.5 ± 0.5 mg samples were put into an alumina crucible, while the furnace was heated gradually to 900 °C with a gasflow rate of 50 mL/ min. The mass loss and heatflow were detected as a function of tem-perature or time using the analyzer software.
2.3. Combustion index
Based on the parameters from TGA such as ignition temperature (Ti), burnout temperature (Tb), average mass loss rate (−RV), maximum
mass loss rate (−Rp), and time range at half value of −Rp ( tΔ1/2),
comprehensive combustion index (S), ignition index (Di), burnout index
(Db) andflammability index (C) were calculated to evaluate the
com-bustion properties of SMS. The above four indices were computed as follows (Chen et al., 2017a; Wang et al., 2018; Xie et al., 2018d):
= − × − × S R R T T ( P) ( V) i2 b (1) = − × D R t t ( ) i P i p (2) = − × × D R t t t ( ) Δ b P p b 1/2 (3) = − C R T ( P) i2 (4)
where ti, tpand tbcorrespond to ignition, peak and burnout time,
re-spectively. A combustion process with a higher burnout index and ig-nition index indicates a better combustion performance. The higher the heating rates are, the higher the Dband Divalues are.
2.4. Kinetic and thermodynamic analyses
The TGA experiments can be used to calculate the kinetic para-meters of the thermal degradation and oxidation processes as follows Eq.(5)(Mureddu et al., 2018):
= dα
dt k T f α( )· ( ) (5)
where k T( )and conversion degreeαcan be expressed as:
= ⎛ ⎝− ⎞ ⎠ k T A E RT ( ) exp a (6) = − − ∞ α m m m m t 0 0 (7)
where m0,mtandm∞are ignition mass, sample mass at time t, and the
final sample residue; and R is the universal constant. For a constant heating rate,β=dT dt/ , Eq.(5)can be transformed into Eq.(8)(Chen et al., 2017b):
= − dα dT A βe · ( )f α E RT (a/ ) (8) The iso-conversional methods (also known as the model-free methods) are widely used for the kinetic studies of solid wastes. Different assumptions and approximations are involved in the different methods. These methods help to avoid the errors caused by the selected reaction mechanism to give an accurate Ea estimate. The Kissinger
method assumes that Eais a constant for a given conversion and is not
needed to be calculated for each conversion (Chandrasekaran et al., 2017; Mabuda et al., 2016). The FWO method uses the Doyle approx-imation assuming Eanot to be constant during the entire degradation
process but to vary as a function of conversion (Mabuda et al., 2016; Xie et al., 2018d). DAEM is widely used in the complex reaction mechanism models of pyrolysis and combustion of different types of biomass based on the kinetic parameters calculated (Mishra and Mohanty, 2018). FWO and KAS were the iso-conversional methodsfirst used to study the ki-netic behaviors of biomass materials using Doyle’s approximation, or KAS derived from Coats-Redfern approximation (Müsellim et al., 2018; Xie et al., 2018b). The Kissinger, FWO, KAS and DAEM methods were defined in Eqs.(9)–(12), respectively, where Eacan be determined from
their slopes: ⎜ ⎟ ⎜ ⎟ ⎛ ⎝ ⎞ ⎠ = ⎛ ⎝ ⎞ ⎠ − β T AR E E RT Kissinger: ln ln P a a P 2 (9) ⎜ ⎟ = ⎛ ⎝ ⎞ ⎠ − − β AE Rg α E RT FWO: lg lg ( ) 2.315 0.4567 a a (10) ⎜ ⎟ ⎛ ⎝ ⎞ ⎠= ⎛ ⎝ ⎞ ⎠ − β T AE Rg α E RT KAS:ln ln ( ) a a 2 (11) ⎜ ⎟ ⎛ ⎝ ⎞ ⎠ = ⎛ ⎝ ⎞ ⎠ + − β T AR E E RT DAEM: ln ln 0.6575 a a 2 (12)
The additional four thermodynamic parameters (A,ΔG, ΔS and ΔH) were computed from Ea estimates from the model-free methods
ac-cording to Eqs.(13)–(16)(Maia and de Morais, 2016).
⎜ ⎟ =⎛ ⎝ ⎜ ⎛ ⎝ ⎞ ⎠ ⎞ ⎠ ⎟ A β E E RT RT · a·exp a /( ) p p2 (13) = − H E RT Δ a (14) ⎜ ⎟ = + ⎛ ⎝ ⎞ ⎠ G E RT K T hA Δ a pln B p (15) = − S H G T Δ (Δ Δ )/ p (16)
where KBis the Boltzmann constant (1.381 × 10⁻³⁴J/K); h is the Plank
constant (6.626 × 10⁻³⁴J s); and Tpis DTG peak temperature (K).
2.5. TG-MS and TG–FTIR analyses
The TG-MS experiments were carried out from ambient temperature to 900 °C at a heating rate of 20 K/min using a Thermo Mass Photo TG-DTA-PIMS 410/S (Rigaku Corporation, Tokyo, Japan). The intensity of some common gases released from the combustion of SMS was mea-sured at the atmosphere of 80% He + 20% O2(150 mL/min).
The TG–FTIR experiments were conducted using a FTIR equipment (is50 FTIR by Thermo company) at 20 K/min under the air atmosphere. The TG analyzer was heated from room temperature to 900 °C and the generated emissions were transferred into a gas cell in FTIR through transfer line. Both transfer line and gas cell were kept at 260 °C against the condensation. The 4 cm−1scan resolution was set in a wavenumber region of 4000–500 cm−1.
3. Results and discussion
3.1. Analyses of physicochemical properties
Prior to the analysis of the combustion kinetic performance, un-derstanding the physicochemical properties of the feedstock material is of crucial importance. In this section, to evaluate its biofuel feasibility, the physical and chemical properties of SMS were compared to those of bituminous coal (Zhou et al., 2016) as a commonly used fossil fuel all over the word.
The organic volatile matters are the major bio-oil components. The volatile matter content of SMS (62.93%) was higher than that of bitu-minous coal (29.0%). Its high VMdue to its devolatilization and
oxi-dation indicated its better combustion properties. The easier degrada-tion of SMS thanfixed carbon at lower temperature also indicated its better combustion and burnout properties than coal. The lower ash content of SMS than coal (13.1%) pointed to its better combustion performance for solid waste reduction. The coal combustion generates a large amount of CO2emissions due to its higherfixed carbon content,
thus enhancing the greenhouse effect. Owing to its lower fixed carbon content (17.28%), SMS as an alternative biofuel is most likely to gen-erate less CO2emissions. SMS with 8.89% moisture was reported to be
feasible for the combustion process (Mishra and Mohanty, 2018). Volatile fuel ratio (VFR) defined as VM/(VM+ FC) was
demon-strated to be indicative of ignition property during combustion (Wang et al., 2016). The VFR value of SMS (0.78) was almost 2.2 times that of bituminous coal (0.35) and similar to that of pea waste (0.77) (Müsellim et al., 2018), but lower than sugarcane bagasse (0.94) (Xie et al., 2018d). These results also confirmed the better ignition proper-ties of SMS than coal. Sugarcane bagasse had the highest VFR value due to its high VMand low FC contents. The higher H and O contents of SMS
than bituminous coal represented its better reactivity and easier igni-tion performance (Wang et al., 2016). The high heating value (HHV, MJ/kg) of SMS was defined as the sum of (33.5C + 142.3H-15.4O-14.5N)/100 (Sahu et al., 2010). The HHV of SMS was lower than bi-tuminous coal. The higher FC content of bibi-tuminous coal shows its higher calorific value (27.80 MJ/kg) since FC contains more carbon-carbon bond due to more energy stored. As the ratios of H/C and O/C represent the degrees of aromaticity and carbonization, the higher atomic ratios of SMS than bituminous coal indicated the occurrence of the dehydration and carbonization reactions (Yousaf et al., 2017). The S contents of SMS and bituminous coal were similar, while the N content of SMS was higher than that of bituminous coal (1.38%) but lower than that of pea waste (2.90%) (Müsellim et al., 2018). The high N content is most likely to stem from the indispensable use of N fertilizer in the mushroom cultivation. An advanced and efficient process of deni-trification is required for the design and optimization of a given in-cinerator on a commercial scale. Given the above analyses, SMS ap-peared to be a promising feedstock for energy generation. Further studies are needed to evaluate and improve its fuel properties. 3.2. Thermogravimetric analyses
3.2.1. Decomposition behavior at 20 K/min
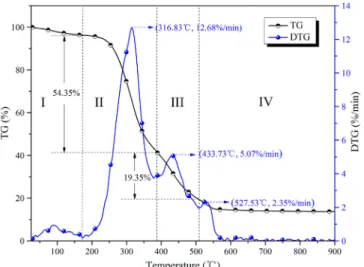
The TG and DTG curves for the combustion of SMS at 20 K/min are shown inFig. 1. According to the DTG curve, the following four peaks were observed due to the release of various components from the combustion of SMS: (1) the evaporation of moisture, (2) the burning of volatiles, (3) the combustion of FC, and (4) the degradation of inorganic materials and residuals.
Thefirst stage referring to the evaporation of moisture occurred from ambient temperature to 175.03 °C with a mass loss of 3.71%. Stage II (175.03–387.13 °C) was the major weight loss stage (54.53%) of the combustion process which accounted for 63.30% of the total weight loss (Table 1).Zhu et al (2013)estimated the total (hemi)cellulose and lignin content of SMS collected from a company in Tianjin, China, at
77.3%. The thermal degradation of the high (hemi)cellulose and lignin content of SMS was stated to primarily cause its mass loss (Dorez et al., 2014). Deng et al. (2016) found the thermal degradation of (hemi) cellulose and lignin to occur in the ranges of 160–240 °C, 240–360 °C and 160–627 °C, respectively, which was consistent with our study. The unstable structures such as heterocyclic, side chain and polycondensa-tion were easy to decompose at a low temperature (Luo et al., 2017). Hence, the major weight loss of SMS at stage II can be attributed to the decomposition of its (hemi)cellulose and lignin content. The maximum weight loss rate (−Rp) of 12.68%/min occurred at 316.83 °C due to the
burning of cellulose. The hemicellulose is easier to degrade than cel-lulose due to its low polymerization degree (Lin et al., 2017). Hence, the degradation and oxidation of hemicellulose, cellulose, and to a lesser extent, protein and lignin occurred at stage II. The release and combustion of volatiles were the major stage of the entire thermal de-gradation process. Stage III (387.13–508.93 °C) involved the combus-tion of FC and the residual volatiles with stronger chemical bonds like aromatic compounds where the weight loss (22.29%) was slightly higher than the FC content (17.28%) (Wang et al., 2018). With the increased reaction temperature at the stage IV, the degradation of in-organic matters and residuals led to the weight loss of 5.61%, in par-ticular releasing the alkali metals such as potassium and sodium (Deng et al., 2016). Finally, the reaction was almost completely accomplished at 600 °C where a constant weight was kept.
3.2.2. Effect of heating rate on combustion behavior
The TG and DTG curves at thefive heating rates are shown inFig. 2. Table 2shows the effect of heating rate on the combustion character-istic parameters clearly. The locations of the TG and DTG peaks shifted to a higher temperature with the increased heating rate. Biomass ma-terials were reported to be a poor conductor of heat which leads to a thermal lag along the temperature gradient (Mishra and Mohanty, 2018). Given the TG curves, the mass of the samples was kept constant at 600 °C which indicated the end of the reaction.
With the increased heating rate, Ti, Tpand Tb, rose from 256.42 to
267.00 °C, 291.72 to 320.20 °C and 517.42 to 552.00 °C, respectively. Lower heating rates performed better in promoting the heat transfer of the particle surface. The increased heating rate postponed the decom-position process. The values of−RPand−RVincreased from 3.31 to
17.16%/min and 0.50 to 2.61%/min, respectively, due to the increased thermal energy and the enhanced heat transfer between the inner portions and among the particles with the high heating rate (Mureddu et al., 2018). The−RP value of SMS was higher than that of wood
(11.20%/min at 20 K/min) (Deng et al., 2016) and coconut (6.60%/ min at 10 K/min) (Dorez et al., 2014). With the increased heating rate, the combustion rates increased, whereas the burnout time decreased (99.65, 50.99, 35.18, 27.08 and 22.17 min at 5, 10, 15, 20 and 25 K/ min, respectively). The high heating rate accelerated the reaction rate of the samples and reduced the burnout time values. The significant temperature difference between the internal and external particles hinders the heat transfer and the diffusion of volatiles. However, the high heating rate resulted in the high reaction rate with the high Tiand
Tb values which represented the opposite effect on the combustion
property (Wang et al., 2016). The heating rates influence the char-acteristic temperatures (Ti and Tb) responding to the mass loss rates
(−RPand–RV) and the characteristic times (ti, tbandΔt1/2). The values
of S, C, Di and Db increased from 0.32 × 10⁻⁷ to 7.60 × 10⁻⁷%2/
(min2·K3), 0.50 × 10⁻⁴ to 2.41 × 10⁻⁴%/(min·K2), 0.13 × 10⁻² to 11.80 × 10⁻²%/min3, and 0.004 × 10⁻²to 2.20 × 10⁻²%/min4, re-spectively. The value of Dbis 550 times higher at 25 K/min than 5 K/
Fig. 1. TG and DTG curves of SMS combustion at a heating rate of 20 K/min.
Table 1
Mass losses of SMS at different combustion temperatures at a heating rate of 20 K/min.
Stage Temperature range (°C)
Mass loss (%)
Maximum mass loss rate (%/min) Percentage (%) Total mass loss (%) I < 175.03 3.71 0.93 4.31 86.14 II 175.03–387.13 54.53 12.68 63.30 III 387.13–508.93 22.29 5.07 25.88 IV 508.93–900.00 5.61 2.35 6.51
min. The Divalue of SMS at 20 K/min was higher than that of
pulver-ized coal (4.69 × 10⁻²%/min3) and sewage sludge (4.23 × 10⁻²%/ min3), whereas its D
bvalue was lower than that of the two materials
(1.01 × 10⁻²%/min4 and 0.11 × 10⁻²%/min4), respectively (Wang
et al., 2018). In addition, the S value of SMS was higher than that of SS (4.91 × 10⁻⁷%2/(min2·K3) but lower than that of PC (6.68 × 10⁻⁷%2/
(min2·K3).
3.3. DSC and DDSC analyses
The heatflows were quantified as a function of heating rate and temperature.Fig. 3shows the DSC and DDSC curves obtained by the TGA/DSC experiments. The DDSC value is thefirst derivative of DSC
which can reflect the relationship between heat flow rate and tem-perature (Li et al., 2016). The DDSC curves describe the rates of change in DSC. The trends of the DSC and DTG curves were similar, with the three exothermic peaks observed in the DSC curves (Fig. 3a).
The exothermic peaks shifted to a higher temperature with a wider temperature range observed in response to the increased heating rate. Thefirst peak temperature of DSC (340.01 °C at 20 K/min) was higher than that of DTG (316.83 °C at 20 K/min) which indicated a hysteresis effect between the inner and outer particles to hinder the release of the heatflow. The first peak corresponded to the stage II inSection 3.2as the combustion of volatiles involved the exothermic reaction which resulted in the mass loss as can be evidently seen in the TG curves.
Thefirst and second peaks represented the combustion of volatiles and FC, respectively which was supported by similar results of other studies (Magalhães et al., 2017; Mureddu et al., 2018). The difference in the heat flow between the first (−16.05 mw/mg) and second (−15.46 mw/mg) peaks was negligible, whereas a significant differ-ence was observed in the DTG curves. This phenomenon may be at-tributed to the energy of carbon–carbon bond being higher than that of carbon–oxygen bonds as the volatiles involved more carbon–oxygen bonds than did FC (Mureddu et al., 2018). The decomposition peaks of the biomass samples are generally difficult to distinguish due to the quickly risen temperature with no time for the samples to complete their decomposition reaction.
The effect of the heating rates on the combustion process of SMS can be clearly seen inFig. 3b. The high heating rate resulted in the peak values of the heatflow rates, and their corresponding temperatures. For thefirst peak corresponding to the combustion of volatiles, the absolute heatflow rate increased from 0.44 to 7.67 mW/mg/min from 5 to 25 K/ min with a significant rise between 15 and 20 K/min. This suggested that the heating rates strengthened the exothermic behavior. By in-tegrating the DSC curves, the heat release from the entire combustion process at the heating rates were obtained to understand the exo-thermic behavior. The heat release grew with the increased heating rate (1356.8, 2078.9, 3118.5, 5100.6 and 4268.6 J/g corresponding to 5, 10, 15, 20 and 25 K/min, respectively). The heat release increased from 5 to 20 K/min but decreased significantly at 25 K/min. The high heating rates were reported to yield incomplete reactions which in turn caused experimental errors (Li et al., 2016). The similar results were showed in Table 2 in that the residuals increased at 25 K/min due to the in-complete reaction. In the commercial applications, a short reaction time and high efficiency are required in which case 20 K/min seems to be an appropriate choice to detect the thermal degradation properties of SMS.
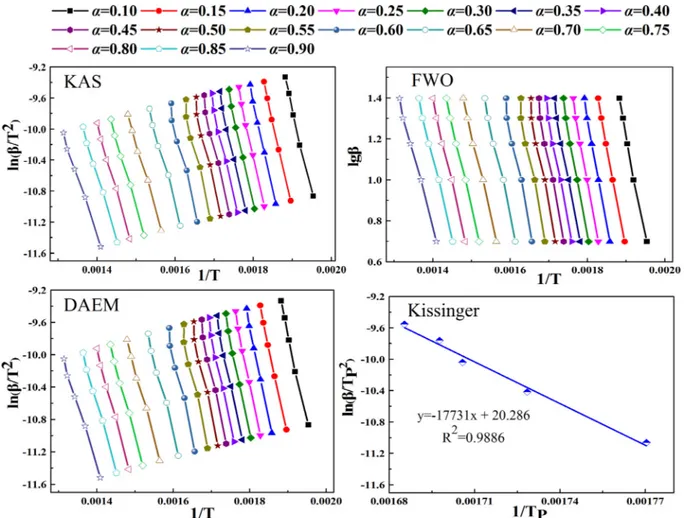
3.4. Kinetic analyses according to four iso-conversion methods
In the present study, the KAS, FWO, DAEM and Kissinger methods were used to determine the kinetic parameters. The curve-fitting plots based on the Arrhenius function were shown inFig. 4, whileTable 3 shows Eaand R2values in response to the different methods at different
α values. The Eavalues depended mainly on the chemical stability of a
Table 2
Combustion characteristic parameters of SMS based on thermogravimetric experiments.
β Temperature (°C) −Rp −RV Mr Time (min) Combustion parameters
Ti Tp Tb tp tb S C Di Db 5 256.42 291.72 517.42 3.31 0.50 12.64 54.41 99.65 0.32 0.50 0.13 0.004 10 256.50 305.40 523.70 6.63 1.00 13.78 29.07 50.99 1.26 1.01 0.94 0.061 15 260.60 313.10 536.50 9.67 1.52 13.94 20.30 35.18 2.68 1.42 2.81 0.270 20 264.23 316.83 545.03 12.68 1.95 13.86 15.74 27.08 4.40 1.84 6.12 0.790 25 267.00 320.20 552.00 17.16 2.61 14.70 13.08 22.17 7.60 2.41 11.80 2.200
β: heating rate in K/min; Ti, Tpand Tb: ignition, peak and burned-out temperatures in °C, respectively;−Rpand−RV: maximum and average mass loss rates of SMS in
%/min, respectively; Mr: residual percentage of SMS at the end of the thermal process in %; tpand tb: peak and burnout time in min, respectively; S: comprehensive
combustion index in 10−7%2/(min2·K3); C:flammability index in 10−4%/(min·K2); D
i: ignition index in 10−2%/min3; and Db: burnout index in10−2%/min4.
compound.
A strong linear relationship was found inFig. 4andTable 3given the R2values of over 0.9710 obtained by the iso-conversional methods.
These methods were highly correlated with the combustion process, thus yielding the accurate Eavalues. The Eaestimates by KAS, FWO,
DAEM and Kissinger were 170.18, 171.49, 170.12 and 147.42 kJ/mol,
respectively. The high R2values and the similar E
avalues point to the
kinetic models as the best descriptor of the combustion process of SMS. The Eavalues by FWO were slightly higher than the other methods.
Table 3shows the change in the Eavalues (from 130.06 to 192.95 kJ/
mol) with theα range of 0.10–0.90 with an interval of 0.05. The change in Ea withα reflects the kinetic complexity of the SMS combustion.
Overall, the Eavalues decreased with the combustion showing the
fol-lowing three regions. In the region I (0.10–0.25) ranging from 255.43 to 291.93 °C at 20 K/min close to the ignition temperature (Ti= 264.23 °C), Eavaried between 179.32 and 192.95 kJ/mol. The
increasing trend of Ea resulted mainly from the decomposition of
hemicellulose.Cao et al. (2016)had a similar conclusion in their study. The cleavage of some weak bonds led to the lower ignition activation energy (Maia and de Morais, 2016). The region II (0.25–0.70 at the range of 291.93–398.03 °C) corresponded to the stage II as discussed in Section 3.1. With the decomposition of cellulose, Ea decreased from
192.95 to 145.93 kJ/mol. The significant decrease in activation energy was related to the intense combustion of volatiles (Mureddu et al., 2018). Eaincreased from 145.93 to 149.64 kJ/mol and then declined to
130.06 kJ/mol with the decomposition offixed carbon and some in-organic materials in the region III (0.70–0.90) (Ceylan et al., 2014).
The Ea estimate of SMS by FWO was lower than that of coffee
grounds (218.91 kJ/mol) (Chen et al., 2017b) and sugarcane bagasse (192.82 kJ/mol) (Xie et al., 2018d) but higher than that of sulcis coal (105.81 kJ/mol) (Mureddu et al., 2018) and red pepper waste (92.93 kJ/mol) (Maia and de Morais, 2016). Since the high activation energy means more energy required to active the oxidation reaction, Ea
is considered a potential barrier of minimum energy to initiate the re-action for most thermochemical rere-actions (Yousaf et al., 2017).
Table 4 provides the estimates of the additional four
Fig. 4. Estimation of Eavalues according to four iso-conversion methods at different α values.
Table 3
Eaand R2values of SMS according to FWO, KAS, DAEM and Kissinger.
α FWO KAS DAEM
Ea R2 Ea R2 Ea R2 0.10 179.32 0.9959 179.91 0.9956 179.83 0.9956 0.15 184.39 0.999 184.99 0.9989 185.00 0.9988 0.20 190.58 0.9983 191.31 0.9981 191.23 0.9980 0.25 192.95 0.9971 193.64 0.9968 193.51 0.9967 0.30 190.89 0.9959 191.36 0.9955 191.24 0.9954 0.35 186.71 0.9937 186.82 0.9931 186.73 0.9930 0.40 186.54 0.9911 186.53 0.9902 186.52 0.9901 0.45 186.41 0.9861 186.28 0.9846 186.17 0.9844 0.50 185.96 0.9784 185.68 0.9761 185.61 0.9758 0.55 185.19 0.9739 184.71 0.971 184.63 0.9708 0.60 175.87 0.9814 174.69 0.9792 174.60 0.9790 0.65 155.26 0.9936 152.70 0.9926 152.69 0.9925 0.70 145.93 0.9975 142.53 0.9971 142.51 0.9971 0.75 147.47 0.9982 143.82 0.9979 143.74 0.9979 0.80 149.64 0.9978 145.83 0.9974 145.81 0.9975 0.85 142.20 0.9975 137.73 0.997 137.63 0.9970 0.90 130.06 0.9972 124.56 0.9966 124.54 0.9966 Average 171.49 170.18 170.12 Kissinger Ea= 147.42 kJ/mol; R2= 0.9886
thermodynamic parameters (ΔS, ΔG, ΔH and A) determined by FWO at 20 K/min. The A estimates are a function ofβ, Ea, and TPaccording to
Eq. (13) and ranged from 3.08 × 10¹¹ to 1.73 × 10¹⁷ with a mean
value of 3.78 × 10¹⁶.Maia and de Morais (2016) pointed out that the A values < 109s−1and≥109s−1may indicate a surface reaction (or
closed complex reaction) and a simple complex reaction, respectively. The frequency of collision between the reactants can be represented by A. Whenα ranged from 0.1 to 0.6, the high A values pointed to the combustion and release of SMS volatiles that involved a complex re-action.
With an average value of 166.32 kJ/mol,ΔH varied from 123.78 to 188.25 kJ/mol close to the start of the thermal decomposition, an in-dication of the reduced endothermicity of the reaction system. This finding was consistent with the thermal decomposition of sorghum straw (Dhyani et al., 2017). TheΔG values revealed the increased total energy of the reaction system and can be used to evaluate changes in the heatflow and the disorder (Huang et al., 2016). The conversion took place with the increased temperature and ΔG. The combustion unfolded in a narrow range of ΔG (146.18–147.67 kJ/mol) with an average value of 146.79 kJ/mol. The highΔG value means the lower reaction favorability and more energy needed to maintain the com-bustion of SMS. The ΔS value as the degree of disorder varied from -41.30 and 71.43 J/mol, with a negative value showing that the degree of disorder was lower than that of the initial reactant (Maia and de Morais, 2016). The low ΔS value (−41.30 J/mol) at the end of the reaction (α = 0.90) indicated its thermodynamic equilibrium where the decomposition of SMS was complete.
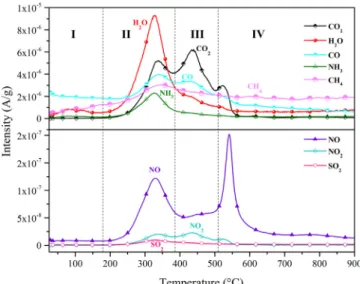
3.5. TG-MS analyses
The release of major gas emissions from the combustion of SMS and their relative intensity were detected using the TG-MS technique. With the adequate O2level, hydrocarbons were completely oxidized
gen-erating CO2 and H2O. The four stages in Fig. 5corresponded to the
stages discussed inSection 3.2. The stage I involved the evaporation of moisture. The stage II included the release of most common gases such as H2O, CO2, CO, NO, NO2and SO2with theirfirst peak upon the
de-gradation and oxidation of volatiles. Wang et al. (2017) reported si-milar thermal degradation peaks of protein and nitrogen oxides (NOX)
at 275 °C. The stage III corresponded to the combustion of FC with a large number of carbon–carbon bond where CO2emission peaked with
the release of NO2emission in small amounts. This conclusion is
sup-ported by the peak of the DTG curves.Gil et al. (2010)stated that the thermal decomposition of biomass under the oxidative atmosphere occurs in a two-stage reaction: the generations of (1) char and volatile,
and (2) small molecule gaseous products and ash when the char was burned out. The peak NO2emission occurred at the char combustion
stage. This indicated that part of N-containing compounds was ab-sorbed in char and oxidized generating NOxand CO2emissions at a
combustion stage of FC referred to inSection 3.2. Some studies pointed out three pathways for the formation of NOXthat followed the
fol-lowing reaction mechanism using the atmospheric N where NO in our study came mainly from fuel N (Kayahan and Özdoğan, 2016; Mladenović et al., 2018). NO was produced mainly by the oxidation of HCN and NHi. HCN was generated from the degradation of volatiles,
while NHiwas converted from HCN. Both were eventually converted
into NO or N2through a series of reactions. Due to the different
ele-mental contents of SMS, the intensities of the TG-MS-measured gases differed slightly in magnitude. For example, the maximum intensity was 9.30 × 10⁻⁶(A/g) for H2O (m/z = 18) and 9.66 × 10⁻⁹(A/g) for
SO2(m/z = 64). The peak of SO2emission observed only at the stage II
demonstrated that part of S remained in char and later was oxidized into SO2 at 334 °C. The SO2 concentration was determined by SO2
binding capability, and combustible and volatile S contents (Kayahan and Özdoğan, 2016).
The gas products were composed mainly of light volatiles such as H2O (m/z = 18), carbon oxides such as CO and CO2(m/z = 28 and 44),
nitrogen oxides such as NO and NO2(m/z = 30 and 46), and sulfur
oxides such as SO2(m/z = 64). In fact, a charge-mass ratio (m/z) may
correspond to a variety of ions. For example, an ion with m/z = 30 may correspond to NO, CH4N, and C2H6. Also, m/z = 17 represented the
fragment of H2O (OH−) in addition to NH3(Xie et al., 2018c). Hence,
the further FTIR experiments can be used to determine the functional groups of the compounds, and thus, the accurate components of the combustion process. The maximum intensity of m/z = 18 was observed at 329.64 °C with a small amount of NO2. This can be attributed to the
decomposition of a higher content of the stable compounds. Similar three peaks were observed during the emissions of CO2and NO2. The
peak temperatures of CO2 and NO2 emissions were 439.11 °C and
432.72 °C, respectively. Most of the detected gas products peakedfirst at a narrow range of 325–344 °C. Therefore, the control over these environmentally harmful gases can be best achieved using this tem-perature range. Most of the gas products emerged at the range of 200–600 °C, and the release of CO2 and NO2 emissions was almost
completed at above 600 °C. Table 4
Thermodynamic parameters for SMS combustion using FWO at 20 K/min.
α Ea(kJ/mol) A (s−1) ΔG (kJ/mol) ΔH (kJ/mol) ΔS (J/mol)
0.10 179.32 9.92 × 10¹⁵ 146.53 174.92 48.19 0.15 184.39 2.87 × 10¹⁶ 146.40 179.87 56.82 0.20 190.58 1.05 × 10¹⁷ 146.24 185.96 67.44 0.25 192.95 1.73 × 10¹⁷ 146.18 188.25 71.43 0.30 190.89 1.12 × 10¹⁷ 146.23 186.12 67.73 0.35 186.71 4.67 × 10¹⁶ 146.34 181.87 60.33 0.40 186.54 4.51 × 10¹⁶ 146.34 181.65 59.94 0.45 186.41 4.39 × 10¹⁶ 146.34 181.46 59.61 0.50 185.96 3.99 × 10¹⁶ 146.36 180.94 58.70 0.55 185.19 3.40 × 10¹⁶ 146.38 180.09 57.23 0.60 175.87 4.81 × 10¹⁵ 146.63 170.64 40.77 0.65 155.26 6.32 × 10¹³ 147.24 149.87 4.47 0.70 145.93 8.83 × 10¹² 147.54 140.35 -12.22 0.75 147.47 1.22 × 10¹³ 147.49 141.72 -9.80 0.80 149.64 1.93 × 10¹³ 147.42 143.74 -6.25 0.85 142.20 4.02 × 10¹² 147.67 136.15 -19.55 0.90 130.06 3.08 × 10¹¹ 148.11 123.78 -41.30 Average 171.49 3.78 × 10¹⁶ 146.79 166.32 33.15
Fig. 5. Emissions of gases evolved from SMS combustion based on TG-MS ex-periments.
3.6. FTIR analyses
The TG-FTIR experiments were conducted at 20 K/min and pro-vided the information concerning scanning time, infrared absorbance, and wavenumber. The gas products were generated in the range of 10–30 min that corresponded to the range of 230–630 °C. The gas products were identified according to their characteristic absorbance values (Gao et al., 2013).
The FTIR results indicated the abundant generation of C species such as CO2, CH4and CO from the SMS combustion. The doublet peaks
occurred at the wavenumber of 2400–2240 cm−1 due to the
asym-metric stretching vibration of CO2. The start of the thermal degradation
with large emissions of the gas products occurred at about 250 °C. Unlike the release of CO2emission, the peaks in the wavenumbers of
4000–3400 cm−1 and 1900–1300 cm−1
were not pronounced which indicated the generation of H2O (Gao et al., 2013). At low temperature,
a small absorption peak of CH4was detected at 2950–2800 cm−1. The
ignition temperature of CH4was above 500 °C, thus indicating that CH4
cannot be oxidized into CO2 at low temperature as well as in low
concentration. As the first step of combustion, most of CH4was
gen-erated from the pyrolysis of lignin which contained more methyl ra-dicals than hemicellulose which was the reason why the pyrolysis of hemicellulose did not produce CH4(Meng et al., 2013). CH4was
de-rived mainly from the cracking of weakly bonded methoxy group (–OCH3–) and stable methylene group (–CH2–) (Gao et al., 2013). The
generation of CH4and carbonyls can be suppressed at high temperature
due to the existence of O2(Yang et al., 2015). From the results of
TG-MS, the peak of m/z = 17 occurred with 327.51 °C and corresponded to H2O (-H) in addition to NH3. When the FTIR spectrogram was
com-pared at 10.82 and 12.83 min, the band of 966 and 3474 cm−1was assigned to the stretching of NH3and N–H, respectively. This result
indicated that m/z = 17 in Fig. 5 may respond to NH3 (Xie et al.,
2018a). The band of 1420–1300 cm−1resulted from SO2which was not
detected at high temperature. This suggested that S-containing com-pounds of SMS were unstable, or their concentration was lower than the detection limit. The peak of 2240–2060 cm−1corresponded to CO from
the degradation of cellulose and Boudouard reaction (Meng et al., 2013; Xie et al., 2018a). O–H stretching of water was detected at bands of 4000–3600 cm−1 and 1900–1300 cm−1 (Xie et al., 2018a). The
ab-sorption bands of 1900–1660 cm−1were a result of the C]O stretching
(Gao et al., 2013).
4. Conclusions
Combustion behaviors and characteristics of SMS and its gaseous products were quantified using TG-MS and TG-FTIR. The HHV estimate of SMS (17.61 MJ/kg) points to SMS as a promising biofuel for energy generation. The combustion of VMat 175.03–387.13 °C was the main
mass loss stage at 20 K/min. The mean Eavalues were estimated at
170.18, 171.49, 170.12 and 147.42 kJ/mol using KAS, FWO, DAEM and Kissinger, respectively. TG-MS results showed that the VM
com-bustion caused the maximum intensity of H2O, CO, NH3 and SO2
emissions, while that the corresponding CO2emission occurred at the
char combustion stage.
Acknowledgments
This research was financially supported by the Scientific and Technological Planning Project of Guangzhou, China (No. 201704030109 & 2016201604030058), and the Science and Technology Planning Project of Guangdong Province, China (No. 2015B020235013, 2017A050501036 & 2017A040403059), and Guangdong Special Support Program for Training High Level Talents (No. 2014TQ01Z248).
References
Cao, L., Yuan, X., Jiang, L., Li, C., Xiao, Z., Huang, Z., Chen, X., Zeng, G., Li, H., 2016. Thermogravimetric characteristics and kinetics analysis of oil cake and torrefied biomass blends. Fuel 175, 129–136.
Ceylan, S., Topcu, Y., Ceylan, Z., 2014. Thermal behaviour and kinetics of alga Polysiphonia elongata biomass during pyrolysis. Bioresour. Technol. 171, 193–198.
Chandrasekaran, A., Ramachandran, S., Subbiah, S., 2017. Determination of kinetic parameters in the pyrolysis operation and thermal behavior of Prosopis juliflora using thermogravimetric analysis. Bioresour. Technol. 233, 413–422.
Chen, J., Wang, Y., Lang, X., Ren, X.E., Fan, S., 2017a. Comparative evaluation of thermal oxidative decomposition for oil-plant residues via thermogravimetric analysis: thermal conversion characteristics, kinetics, and thermodynamics. Bioresour. Technol. 243, 37–46.
Chen, J., Xie, C., Liu, J., He, Y., Xie, W., Zhang, X., Chang, K., Kuo, J., Sun, J., Zheng, L., Sun, S., Buyukada, M., Evrendilek, F., 2017b. Co-combustion of sewage sludge and coffee grounds under increased O2/CO2atmospheres: thermodynamic characteristics,
kinetics and artificial neural network modeling. Bioresour. Technol. 250, 230–238.
Deng, S., Wang, X., Tan, H., Mikulčić, H., Yang, F., Li, Z., Duić, N., 2016.
Thermogravimetric study on the Co-combustion characteristics of oily sludge with plant biomass. Thermochim. Acta 633, 69–76.
Dhyani, V., Kumar Awasthi, M., Wang, Q., Kumar, J., Ren, X., Zhao, J., Chen, H., Wang, M., Bhaskar, T., Zhang, Z., 2018. Effect of composting on the thermal decomposition behavior and kinetic parameters of pig manure-derived solid waste. Bioresour. Technol. 252, 59–65.
Dhyani, V., Kumar, J., Bhaskar, T., 2017. Thermal decomposition kinetics of sorghum straw via thermogravimetric analysis. Bioresour. Technol. 245, 1122–1129.
Dorez, G., Ferry, L., Sonnier, R., Taguet, A., Lopez-Cuesta, J.M., 2014. Effect of cellulose, hemicellulose and lignin contents on pyrolysis and combustion of naturalfibers. J. Anal. Appl. Pyrolysis 107, 323–331.
Gao, N., Li, A., Quan, C., Du, L., Duan, Y., 2013. TG–FTIR and Py–GC/MS analysis on pyrolysis and combustion of pine sawdust. J. Anal. Appl. Pyrolysis 100, 26–32.
Gil, M.V., Casal, D., Pevida, C., Pis, J.J., Rubiera, F., 2010. Thermal behaviour and ki-netics of coal/biomass blends during co-combustion. Bioresour. Technol. 101 (14), 5601–5608.
Huang, L., Liu, J., He, Y., Sun, S., Chen, J., Sun, J., Chang, K., Kuo, J., Ning, X., 2016. Thermodynamics and kinetics parameters of co-combustion between sewage sludge and water hyacinth in CO2/O2atmosphere as biomass to solid biofuel. Bioresour.
Technol. 218, 631–642.
Jiang, H., Cheng, Z., Zhao, T., Liu, M., Zhang, M., Li, J., Hu, M., Zhang, L., Li, J., 2014. Pyrolysis kinetics of spent lark mushroom substrate and characterization of bio-oil obtained from the substrate. Energy Convers. Manage. 88, 259–266.
Jiang, H., Zhang, M., Chen, J., Li, S., Shao, Y., Yang, J., Li, J., 2017. Characteristics of bio-oil produced by the pyrolysis of mixed bio-oil shale semi-coke and spent mushroom substrate. Fuel 200, 218–224.
Kapu, N.U.S., Manning, M., Hurley, T.B., Voigt, J., Cosgrove, D.J., Romaine, C.P., 2012. Surfactant-assisted pretreatment and enzymatic hydrolysis of spent mushroom com-post for the production of sugars. Bioresour. Technol. 114, 399–405.
Kayahan, U., Özdoğan, S., 2016. Oxygen enriched combustion and co-combustion of lignites and biomass in a 30 kWth circulatingfluidized bed. Energy 116, 317–328.
Li, Z., Zhang, Y., Jing, X., Zhang, Y., Chang, L., 2016. Insight into the intrinsic reaction of brown coal oxidation at low temperature: differential scanning calorimetry study. Fuel Process. Technol. 147, 64–70.
Lin, Y., Liao, Y., Yu, Z., Fang, S., Ma, X., 2017. A study on co-pyrolysis of bagasse and sewage sludge using TG-FTIR and Py-GC/MS. Energy Convers. Manage. 151, 190–198.
Luo, L., Liu, J., Zhang, H., Ma, J., Wang, X., Jiang, X., 2017. TG-MS-FTIR study on pyr-olysis behavior of superfine pulverized coal. J. Anal. Appl. Pyrpyr-olysis 128, 64–74.
Mabuda, A.I., Mamphweli, N.S., Meyer, E.L., 2016. Model free kinetic analysis of bio-mass/sorbent blends for gasification purposes. Renew. Sustain. Energy Rev. 53, 1656–1664.
Magalhães, D., Kazanç, F., Ferreira, A., Rabaçal, M., Costa, M., 2017. Ignition behavior of Turkish biomass and lignite fuels at low and high heating rates. Fuel 207, 154–164.
Maia, A.A.D., de Morais, L.C., 2016. Kinetic parameters of red pepper waste as biomass to solid biofuel. Bioresour. Technol. 204, 157–163.
Meng, A., Zhou, H., Qin, L., Zhang, Y., Li, Q., 2013. Quantitative and kinetic TG-FTIR investigation on three kinds of biomass pyrolysis. J. Anal. Appl. Pyrolysis 104, 28–37.
Meng, L., Li, W., Zhang, S., Wu, C., Lv, L., 2017. Feasibility of co-composting of sewage sludge, spent mushroom substrate and wheat straw. Bioresour. Technol. 226, 39–45.
Meng, L., Zhang, S., Gong, H., Zhang, X., Wu, C., Li, W., 2018a. Improving sewage sludge composting by addition of spent mushroom substrate and sucrose. Bioresour. Technol. 253, 197–203.
Meng, X., Liu, B., Xi, C., Luo, X., Yuan, X., Wang, X., Zhu, W., Wang, H., Cui, Z., 2018b. Effect of pig manure on the chemical composition and microbial diversity during co-composting with spent mushroom substrate and rice husks. Bioresour. Technol. 251, 22–30.
Mishra, R.K., Mohanty, K., 2018. Pyrolysis kinetics and thermal behavior of waste saw-dust biomass using thermogravimetric analysis. Bioresour. Technol. 251, 63–74.
Mladenović, M., Paprika, M., Marinković, A., 2018. Denitrification techniques for biomass combustion. Renew. Sustain. Energy Rev. 82, 3350–3364.
Mureddu, M., Dessì, F., Orsini, A., Ferrara, F., Pettinau, A., 2018. Air- and oxygen-blown characterization of coal and biomass by thermogravimetric analysis. Fuel 212, 626–637.
Müsellim, E., Hussain Tahir, M., Sajjad Ahmad, M., Ceylan, S., 2018. Thermokinetic and TG/DSC-FTIR study of pea waste biomass pyrolysis. Appl. Therm. Eng. 137, 54–61.
Nakatsuka, H., Oda, M., Hayashi, Y., Tamura, K., 2016. Effects of fresh spent mushroom substrate of Pleurotus ostreatus on soil micromorphology in Brazil. Geoderma 269, 54–60.
Sahu, S.G., Sarkar, P., Chakraborty, N., Adak, A.K., 2010. Thermogravimetric assessment of combustion characteristics of blends of a coal with different biomass chars. Fuel Process. Technol. 91 (3), 369–378.
Slezak, R., Krzystek, L., Ledakowicz, S., 2018. Thermogravimetric analysis coupled with mass spectrometry of spent mushroom substrate and its fractions. J. Anal. Appl. Pyrolysis 133, 1–8.
Wang, G., Zhang, J., Shao, J., Liu, Z., Zhang, G., Xu, T., Guo, J., Wang, H., Xu, R., Lin, H., 2016. Thermal behavior and kinetic analysis of co-combustion of waste biomass/low rank coal blends. Energy Convers. Manage. 124, 414–426.
Wang, X., Sheng, L., Yang, X., 2017. Pyrolysis characteristics and pathways of protein, lipid and carbohydrate isolated from microalgae Nannochloropsis sp. Bioresour. Technol. 229, 119–125.
Wang, Z., Hong, C., Xing, Y., Li, Y., Feng, L., Jia, M., 2018. Combustion behaviors and kinetics of sewage sludge blended with pulverized coal: with and without catalysts. Waste Manage. (Oxford) 74, 288–296.
Xie, C., Liu, J., Xie, W., Kuo, J., Lu, X., Zhang, X., He, Y., Sun, J., Chang, K., Xie, W., Liu, C., Sun, S., Buyukada, M., Evrendilek, F., 2018a. Quantifying thermal decomposition regimes of textile dyeing sludge, pomelo peel, and their blends. Renew. Energ. 122, 55–64.
Xie, C., Liu, J., Zhang, X., Xie, W., Sun, J., Chang, K., Kuo, J., Xie, W., Liu, C., Sun, S., Buyukada, M., Evrendilek, F., 2018b. Co-combustion thermal conversion character-istics of textile dyeing sludge and pomelo peel using TGA and artificial neural net-works. Appl. Energy 212, 786–795.
Xie, W., Huang, J., Liu, J., Zhao, Y., Chang, K., Kuo, J., He, Y., Sun, J., Zheng, L., Xie, W., Sun, S., Buyukada, M., Evrendilek, F., 2018c. Assessing thermal behaviors and ki-netics of (co-)combustion of textile dyeing sludge and sugarcane bagasse. Appl. Therm. Eng. 131, 874–883.
Xie, W., Wen, S., Liu, J., Xie, W., Kuo, J., Lu, X., Sun, S., Chang, K., Buyukada, M., Evrendilek, F., 2018d. Comparative thermogravimetric analyses of co-combustion of textile dyeing sludge and sugarcane bagasse in carbon dioxide/oxygen and nitrogen/ oxygen atmospheres: thermal conversion characteristics, kinetics, and thermo-dynamics. Bioresour. Technol. 255, 88–95.
Yang, S., Zhu, X., Wang, J., Jin, X., Liu, Y., Qian, F., Zhang, S., Chen, J., 2015. Combustion of hazardous biological waste derived from the fermentation of antibiotics using TG-FTIR and Py-GC/MS techniques. Bioresour. Technol. 193, 156–163.
Yousaf, B., Liu, G., Abbas, Q., Wang, R., Ubaid Ali, M., Ullah, H., Liu, R., Zhou, C., 2017. Systematic investigation on combustion characteristics and emission-reduction me-chanism of potentially toxic elements in biomass- and biochar-coal co-combustion systems. Appl. Energy 208, 142–157.
Zhang, B., Tan, G., Zhong, Z., Ruan, R., 2017. Microwave-assisted catalytic fast pyrolysis of spent edible mushroom substrate for bio-oil production using surface modified zeolite catalyst. J. Anal. Appl. Pyrolysis 123, 92–98.
Zhou, C., Liu, G., Wang, X., Qi, C., Hu, Y., 2016. Combustion characteristics and arsenic retention during co-combustion of agricultural biomass and bituminous coal. Bioresour. Technol. 214, 218–224.
Zhu, H.J., Liu, J.H., Sun, L.F., Hu, Z.F., Qiao, J.J., 2013. Combined alkali and acid pre-treatment of spent mushroom substrate for reducing sugar and biofertilizer produc-tion. Bioresour. Technol. 136, 257–266.