SECTORAL DETERMINANTS OF THE LOCATION CHOICE OF MNCs
A Master’s Thesis
by
FİTNAT BANU DEMİR
Department of Economics Bilkent University
Ankara May 2007
SECTORAL DETERMINANTS OF THE LOCATION CHOICE OF MNCs
The Institute of Economics and Social Sciences of
Bilkent University
by
FİTNAT BANU DEMİR
In Partial Fulfillment of the Requirements for the Degree of MASTER OF ARTS
in
THE DEPARTMENT OF ECONOMICS BİLKENT UNIVERSITY
ANKARA
I certify that I have read this thesis and have found that it is fully adequate, in scope and in quality, as a thesis for the degree of Master of Arts in Economics.
--- Asst. Prof. Selin Sayek Supervisor
I certify that I have read this thesis and have found that it is fully adequate, in scope and in quality, as a thesis for the degree of Master of Arts in Economics.
--- Assc. Prof. Fatma Taşkın Examining Committee Member
I certify that I have read this thesis and have found that it is fully adequate, in scope and in quality, as a thesis for the degree of Master of Arts in Economics.
--- Asst. Prof. Zeynep Önder Examining Committee Member
Approval of the Institute of Economics and Social Sciences
--- Prof. Erdal Erel
ABSTRACT
SECTORAL DETERMINANTS OF THE LOCATION CHOICE OF MNCs Demir, Fitnat Banu
M.A., Department of Economics Supervisor: Asst. Prof. Selin Sayek
May 2007
This thesis examines the determinants of multinational companies (MNCs)’ location choices estimating conditional or nested logit model using a dataset of more than 17,000 firms invested in 38 developing countries over the period 1980-2004. In addition, this dataset has an exceptional feature – it allows identifying the sectors that these firms invest in. The sectoral analysis is undertaken both at 2-digit ISI-classification and aggregate level where sectors are lumped according to their tradability or technology intensity. The empirical results suggest that the determinants of the probability that a MNC invests in a particular country vary across sectors. Thus, the sectoral composition of FDI is essential for understanding its economic geography.
Keywords: Foreign direct investment, location choice, multinational enterprises, sectors.
ÖZET
ÇOK ULUSLU ŞİRKETLERİN YER SEÇİMİNİN SEKTÖREL BELİRLEYİCİLERİ
Demir, Fitnat Banu Yüksek Lisans, Ekonomi Bölümü Tez Yöneticisi: Yrd. Doç. Dr. Selin Sayek
Mayıs 2007
Bu tez çalışması, 38 tane gelişmekte olan ekonomiye 1980-2004 yılları arasında yatırım yapmış yaklaşık 17,000 firmanın verisi ile koşullu veya yuvalanmış logit modeli tahmin ederek çok uluslu şirketlerin yer seçiminin belirleyicilerini incelemektedir. Bunun yanında, firmaların yatırım yaptıkları sektörleri ayırt etmemize olanak sağlaması, veri setinin istisnai bir özelliğidir. Sektörel inceleme, 2-basamaklı ISI sınıflamasında ve sektörlerin ticarete konu olmalarına veya teknolojik yoğunluklarına göre gruplandırıldığı toplulaştırılmış düzeyde yapılmaktadır. Ampirik analizin sonuçlarına göre belli bir ülkenin, çok uluslu bir şirket tarafından yatırım yeri olarak seçilme ihtimalinin belirleyicileri sektörlere göre farklılık göstermektedir. Bu nedenle, doğrudan yabancı yatırımın sektörel kompozisyonu, ekonomik coğrafyasını anlamada hayati bir öneme sahiptir.
Anahtar Kelimeler: Yabancı Doğrudan Yatırım, Yer Seçimi, Çok Uluslu Şirketler, Sektörler.
ACKNOWLEDGEMENTS
I would like to thank Dr. Selin Sayek, my supervisor, for her guidance and support throughout this work. Moreover, I am deeply indebted to her for the encouragement and support she provided in my academic endeavors.
I am grateful to my examining committee members Dr. Fatma Taşkın and Dr. Zeynep Önder for their valuable comments and contributions.
I would also like to thank Emre Deliveli, Hasan Ersel, and Guven Sak – your detailed comments and insight have been of great value to me.
I am also appreciative of the support of Beyza Polat, Ozan Acar and Barış Esmerok. This stressful and patience-demanding task would have been more difficult to tolerate without your friendship.
TABLE OF CONTENTS
ABSTRACT ... iii
ÖZET ... iv
ACKNOWLEDGMENTS ... v
TABLE OF CONTENTS... vi
LIST OF TABLES ... viii
LIST OF FIGURES ... x
CHAPTER 1: INTRODUCTION ... 1
CHAPTER 2: LITERATURE REVIEW ... 6
2.1 Market-Related Variables ………...7 2.2 Agglomeration Variables ……...…..11 2.3 Labor-Related Variables …...15 2.4 Institutional Variables ……...……..17 2.5 Government-Related Variables …...18 2.6 Infrastructure-Related Variables …...20
CHAPTER 3: METHODOLOGY AND DATA …………...22
3.1 Methodology for Conditional Logit...22
3.2 Methodology for Nested Logit………... 24
3.3 Data………. ... 27
CHAPTER 4: RESULTS ... 33
4.1 Tradable and Non-Tradable Sectors... ... 33
4.2 Technology Intensity………... 39
4.3 Individual Sectors... 45
CHAPTER 5: CONCLUSION ... 53
SELECTED BIBLIOGRAPHY……... 55 APPENDICES
A. EMPIRICAL RESULTS ... 59 B. DATA SOURCES AND DESCRIPTIONS ... 72 C. SUMMARY OF LITERATURE REVIEW ... 77
LIST OF TABLES
1. Sectoral Distribution of FDI Flows (in percent of total) ... 3
2. Sectoral Distribution of M&A in Developing Countries (2004) ...4
3. Distribution of Firms across Countries ………28
4. Distribution of Firms across Regions (in percent) ………...…………29
5. Distribution of Firms across Industries …………..……….……….31
6. Determinants of FDI in Tradable Sectors ………...……….59
7. Determinants of FDI in Non-Tradable Sectors ………...……….60
8. Determinants of FDI in Resource-Based Sectors ………...……….61
9. Determinants of FDI in Low Technology Sectors ……….……….62
10. Determinants of FDI in Medium-High Technology Sectors …………...………63
11. Determinants of FDI in Food, Beverages and Tobacco ………...………64
12. Determinants of FDI in Chemicals ……….……….65
13. Determinants of FDI in Machinery and Equipment ………...……….65
14. Determinants of FDI in Construction ……….……….66
15. Determinants of FDI in Wholesale and Retail Trade ……….…………..67
17. Determinants of FDI in Communication ……….……….69
LIST OF FIGURES
1. Net FDI Inflows (billion USD) ... 1
2. FDI Inflows to the Countries in the Dataset as a Share
of FDI Inflows to the Developing Countries (in percentages) ………29
3. Assessing the Coverage of MNCs, in Comparison with the
CHAPTER 1
INTRODUCTION
The role of multinational firms has become increasingly important in the globalized world since 1980s. The worldwide foreign direct investment (FDI, henceforth) flows reached to 612 billion US Dollars in 20041. Figure 1 presents the increasing amount of total FDI flows, and points to the declining share of developed countries, which was mirrored by a rising share of developing countries.
Figure 1: Net FDI Inflows (billion USD)
1
UNCTAD, FDI Database
0 200 400 600 800 1000 1200 1400 1990 1991 1992 1993 1994 1995 1996 1997 1998 1999 2000 2001 2002 2003 2004
Developed countries Developing economies World Source: UNCTAD, FDI Database.
Similarly, the share of worldwide FDI inflows in gross fixed capital formation has increased since 1980s, the annual average reached 3.9 percent in 1988-1995 from 2.8 percent in 1980-1987. This share further increased to 10.8 percent in 1996-2003.
As the governments started to compete for growing FDI flows in order to benefit from their perceived positive effects, exploring the determinants of FDI has become a popular issue in the literature. Nevertheless, the analyses of FDI have been suffering from data related problems. In particular, aggregate stock and flow variables may not reflect the exact amount of FDI, as MNCs have found diverse and creative ways to hide away their investment from being taxed or subject to various government regulations.2 Moreover, despite extensive literature on the reason of existence of MNCs, understanding the location choices of MNCs and the economic geography of FDI has only recently been re-emphasized.3 The location choice is represented with a binary variable that takes one for the country being invested by the MNC, and zero otherwise. The advantage of using such an approach is that it is not prone to underestimations resulting from using aggregate stock and flow variables.
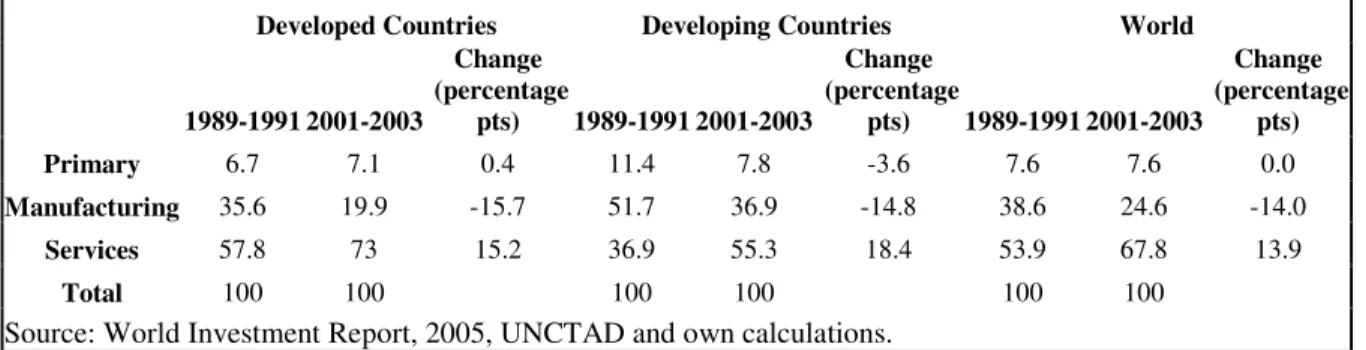
Another important characteristic of FDI flows is the change in their sectoral distribution in recent years. Table 1 shows that the share of services in total FDI inflows considerably increased in the world in 2001-2003 compared to early 1990s. In particular,
2 For example, it is widely known that in many countries MNCs prefer to lend to their foreign subsidiaries
to finance their investment, this alone would heavily underestimate FDI.
3
FDI inflows in services increased by 759% in absolute terms and 50% as a share of total flows in developing countries. One reason of such a trend might have been the privatization efforts in developing countries4.
Table 1: Sectoral Distribution of FDI Flows (in percent of total)
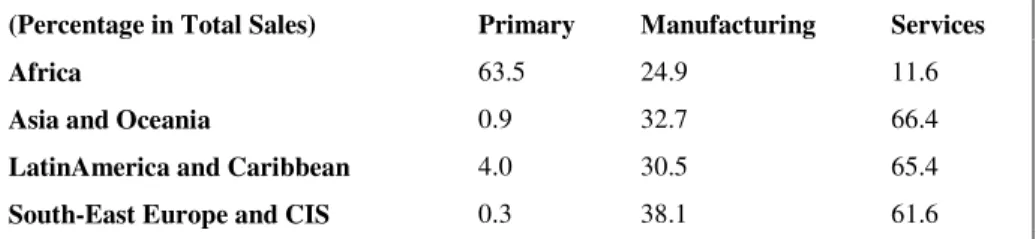
The sectoral composition of FDI inflows differ across regions. For instance, while the primary sectors have the highest share in Africa, they are almost insignificant for the developing countries in South-East Europe and Commonwealth of Independent States (CIS) (see Table 2). This implies that foreign firms in different sectors consider different regional characteristics while deciding on their investment location. Hence, studying the determinants of FDI at the sectoral level is of utmost importance.
4 According to World Investment Report (2005), many large MNCs have emerged in services, especially,
in telecommunications, electricity, water and postal services which were formerly state-owned monopolies.
Developed Countries Developing Countries World
1989-1991 2001-2003 Change (percentage pts) 1989-1991 2001-2003 Change (percentage pts) 1989-1991 2001-2003 Change (percentage pts) Primary 6.7 7.1 0.4 11.4 7.8 -3.6 7.6 7.6 0.0 Manufacturing 35.6 19.9 -15.7 51.7 36.9 -14.8 38.6 24.6 -14.0 Services 57.8 73 15.2 36.9 55.3 18.4 53.9 67.8 13.9 Total 100 100 100 100 100 100
Table 2: Sectoral Distribution of M&A in Developing Countries (2004)
The main contribution of this thesis to the literature is the detailed sectoral analysis that discusses the spatial economic geography of these MNCs across different sectors. From the viewpoint of policymakers, such a sectoral analysis will provide invaluable guidance in the design of appropriate policy to attract the “right” kind of FDI flows in accordance with the country’s own conditions and circumstances. To the best of our knowledge, this is the first study that uses such a large panel of countries and detailed sectoral classification in order to examine the determinants of the location choice of MNCs. In addition, the analysis in this study does not have the deficiencies resulting from the use of aggregate FDI inflows data. We only consider the determinants of the probability that a foreign firm invests in a particular country given that it has already decided to undertake the investment.
There are several studies that look into the economic geography of MNCs within a country. For example, Coughlin, Terza and Arromdee (1991) and Woodward (1992) study foreign firms’ behavior when investing in the USA, while Deichmann, Karidis and Sayek (2003) carries out the same analysis for foreign firms in Turkey, and Guimaraes,
(Percentage in Total Sales) Primary Manufacturing Services
Africa 63.5 24.9 11.6
Asia and Oceania 0.9 32.7 66.4
LatinAmerica and Caribbean 4.0 30.5 65.4
South-East Europe and CIS 0.3 38.1 61.6
Figueiredo, Woodward (2000) for foreign firms in Portugal. Some of these studies analyze the decision-making process of the multinational firms across different sectors. However, since they focus on foreign firms in a single country it is difficult to generalize their findings across countries.
On the other hand, some recent studies have considered the decision choice of foreign firms for a panel of countries. Pusterla and Resmini (2005) and Basile, Castellani and Zanfei (2003) are the two most relevant studies among these. Both papers examine the location choice of MNCs in European countries. Similar to the present study, firm level data are employed in order to find out the determinants of the probability that an MNC invests in a particular region. This present study differs from these two papers in two aspects. The first one is about the coverage of study. Those studies consider the countries in a particular region while the present paper examines foreign firms investing in many developing countries belonging to different regions in the world. The second one is that our analysis is based on a more detailed sectoral classification.
The thesis is organized as follows: In the next chapter, the relevant literature is surveyed in detail. In chapter 3, data and econometric methodology are discussed. Chapter 4 discusses the estimation results in detail. Chapter 5 concludes.
CHAPTER 2
LITERATURE REVIEW
There is now a huge and expanding literature that looks at the determinants of FDI, at a theoretical as well as empirical level. The investor may consider to invest oversees either producing a similar good in different locations (horizontal FDI) or producing different stages of a good at different locations (vertical FDI). The final investment decision is based on a cost-benefit analysis since each motivation has its own costs and benefits. There are many studies that try to model this investment decision theoretically. For instance, Markusen and Venables (1998, 2000) construct models that incorporate the features of the new trade theory. These models allow for imperfect market structures, and show the ranges of parameters where multinational firms operate. The results suggest that measures of market size, in this case defined as the differences in country size and in relative endowments by the authors, and the level of trade- transportation- and investment-related costs are the major determinants of the extent of MNC activities.
On the other hand, Helpman (1984) introduces vertical FDI into a Heckscher-Ohlin trade model where the overseas operations of the MNC is modeled as a separate stage of production, and allows creation of a third tradable good and an additional trading opportunity. This theoretical framework points to the complementarity of trade and FDI, suggesting that MNCs that carry out vertical FDI are driven by cost differences, where the costs include both factor costs, and trade and transportation costs. These theoretical findings provide a basis for the empirical discussion of the determinants of FDI flows.
The empirical papers differ in their methodology, coverage (countries, sectors) and choice of dependent and independent variables. Commonly considered determinants of FDI in the literature can be classified into six groups: market-related, agglomeration, labor-related, institutional, infrastructural, and government policies. This section provides a selective literature survey that highlights common aspects as well as differences in the papers for each group of variables.
2.1 Market-Related Variables
In the empirical literature, two different variables are used to take the market conditions into account. The regional income measures the size of the market while per capita income signifies the purchasing power. Both variables are expected to have positive effect on attracting FDI into a region.
The studies at country level use GDP per capita as a proxy for purchasing power. For instance, Kolstad and Villanger (2004) try to explain the determinants of FDI in services as a whole and for four sub-sectors (finance, business activities, transport and trade) using data from 57 countries for the period 1989-2000. They use sectoral FDI per capita as the dependent variable. According to the estimation results, there is no robust variable that can explain FDI in business activities while GDP per capita is a significant determinant in the case of transport services. Finally, GDP per capita is found to be a robust determinant of FDI in trade related services.
Secondly, Nunnenkamp (2002) tries to determine whether the traditional determinants of FDI have lost importance while the non-traditional ones gained importance after the rise of globalization. In traditional sense, market and resource seeking were the basic motives of FDI in host countries. On the other hand, efficiency seeking FDI has become dominant in recent years. Thus, in order to test the hypothesis, it is necessary to distinguish between traditional and non-traditional driving forces of FDI. The author defines traditional determinants of FDI as population , GDP per capita, GDP growth, administrative bottlenecks, entry restrictions and risk factors of host country. Non-traditional factors are complementary factors of production, average years of schooling , cost factors, restrictions of foreign trade and change in trade shares. Two other factors, namely post-entry restrictions and technology-related regulations cannot be classified in either one. Using simple correlations instead of multiple regression analysis5, he concludes that there has been no significant change in the determinants of
5 Due to degrees of freedom problem resulting from small sample size and large number of independent
FDI (stock, flow or per capita flow) after the rise of globalization. Market-related determinants are still important to attract FDI.
Thirdly, Castellani et al (2003) examines the determinants of the location choice of MNCs in Europe using the nested logit framework. In particular, the authors are mainly interested in the impact of national boundaries and EU policy on FDI into European regions. In order to consider these effects, they use many control variables such as market size, agglomeration economies, labor market variables and national policies. The results show that European integration has eliminated the national boundaries for foreign firms and thus regions in different countries have started to compete for attracting new MNCs. Among the market related variables, market size (measured by the value added in the region) appears to be a positive and significant determinant while the effect of market potential (measured by the sum of value added of all regions weighted by the inverse distance) is indeterminate.
Resmini (1999) tries to explain whether FDI into different sectors respond to the same host country characteristics in different ways by looking at foreign direct investment flows of the European Union countries into Central and Eastern Europe. Using FDI flows to manufacturing and sectors classified according to their factor intensities, it is found that different sectors react to host country characteristics in
different ways. However, GDP per capitaturns out to be an important factor to explain
On the other hand, Woodward (1992) uses a different variable for market conditions. This paper examines the location choice of Japanese firms into the United States manufacturing sector for the period 1980-89 using the conditional logit framework. Since the study is at state level, the author uses distance weighted personal income6. The results show that this variable is a significant factor for location decisions of Japanese firms in United States. Similarly, Mollick, Duran and Ochoa (2004) examine the effect of investment in infrastructure on FDI in Mexican states. The authors use state per capita GDP as a control variable and get a positively significant coefficient on it. Finally, Coughlin et al (1991) analyze the pattern of foreign direct investment into United States for the period 1981-83 using the conditional logit framework. It is found that state per capita income has a significant and positive impact on the probability of selecting a specific location. On the other hand, Kim et al (2003) find that having a large market significantly deters FDI in their analysis of FDI in new manufacturing plants located in U.S. states for the period 1987-1994.
The third group of studies suggests that the impact of market size on FDI is uncertain. For instance, Hogenbirk and Narula (2004) explain the determinants of the location choice of foreign enterprises within Netherlands. In particular, the study deals with the impact of region characteristics, agglomeration economies and home country differences using the conditional logit framework. Gross national product of the region is used as a proxy for the market size and its impact is found to be uncertain although its coefficient is significant. Finally, Mariotti and Piscitello (1995) investigate the effect of
6 This is the “gravity adjusted” market size variable, defined as the amount of personal income in a state
information costs on the location decision of foreign companies using data on acquisitions and greenfield investments into Italy for the period 1986-91. The dependent variable is the difference between the actual and the expected number of foreign plants weighted by the scale of investment opportunities offered in each province7. The independent variables used in the study can be classified into five groups: variables related to information costs, traditional factors, infrastructure-services-intangible assets, environmental and social context and government policy. One of the variables belonging to the second set of factors is the market demand. Proxies used for this variable are the per capita and growth rate of consumption. The results indicate that market related variables do not significantly contribute to attracting more FDI.
In summary, the above reviewed literature suggest that the market size (real GDP), and market potential (GDP per capita) measures should be included in the following study.
2.2 Agglomeration Variables
In the literature, effect of agglomeration economies on FDI is measured using different proxies. For instance, Carlton (1983) uses employment in a specific industry as a proxy
7 The expected number of plants in a province is calculated as the sum of foreign plants in each sector (in
manufacturing) weighted by the share of production units in the selected province with respect to the national average.
for agglomeration economies, where the model is used to explain the location and employment choices of new branch plants across standard metropolitan statistical areas (SMSAs). The paper considers three industries (fabricated plastic products, communication transmitting equipment and electronic components) and shows that the two decisions are interrelated. The results of the empirical analysis show that presence of agglomeration economies is a positive and significant determinant of FDI in these industries.
Secondly, Luger and Shetty (1985) examine the effect of state promotional activities, agglomeration economies, labor market conditions and urbanization economies on location choice of foreign enterprises in USA for the period 1979-1983. The paper considers three industries, namely drug manufacturing, industrial machinery and motor vehicle production. The methodology employed in the paper is conditional multinomial logit. The proxy for the agglomeration economies is the total man hours in that specific industry (the authors also use the relative man hours to determine whether the result obtained for the agglomeration economies is robust), which is found to be a positive and significant determinant of location choice of foreign enterprises.
Pusterla and Resmini (2005) estimate the determinants of the location choice of foreign firms in Central and Eastern European countries. Using firm level data, it is found that EU membership is an important determinant of the location choice while national borders do not matter for these countries. In the case of agglomeration
economies, Hoover’s localization index8 is computed seperately for domestic and foreign firms. Positive and significant coefficients of these variables show that the probability that a foreign firm invests in a region increases with higher industrial concentration of domestic/foreign firms in the selected country.
On the other hand, Guimaraes et al (2000) use four different variables for agglomeration economies: total manufacturing employment per square km, share of manufacturing employment in a specific industry (representing industry specific localization economies), share of total employment in the tertiary sector (representing concentration of business activities), share of employment in foreign plants (to examine foreign specific agglomeration) in analyzing the location choice of foreign-owned enterprises in Portugal. Besides many regional determinants, the impact of agglomeration on the location decision of firms is considered in a conditional logit model that uses sectoral manufacturing data. The results show that agglomeration economies, especially urban service agglomeration economies are positive and significant for the location choice of foreign firms.
Campos and Kinoshita (2003) examine the role of institutions and agglomeration in comparison with initial conditions and factor endowments as determinants of FDI for the transition economies in Central Europe and former Soviet Union. The paper uses data from 25 transition economies for the period 1990-1998. The dependent variable is per capita FDI stock deflated by the GDP deflator. In the study, lagged FDI stock is used
8 Hoover’s localization index measures industrial concentration in a specific region relative to aggregate
to account for the effect of agglomeration economies. The results show that the presence of agglomeration economies is a positive and decisive factor of FDI for the transition economies in Central Europe and Former Soviet Union.
Other studies such as Choe (2000) and Kim, Pickton and Gerking (2003) use number of establishments in the region and find similar results regarding the impact of agglomeration economies. On the other hand, some studies differentiate the impact of local and foreign agglomeration on FDI. For instance, Hogenbirk and Narula (2004) assert that agglomeration effect is as expected if we consider the presence of foreign firms in the region while the presence of local firms turns out to be a deterrent for FDI. Similarly, Castellani et al (2003) uses number of establishments and cumulative number of foreign-owned firms as proxies of overall and foreign-firm agglomeration, respectively. The results show that agglomeration is an important driving force for foreign firms in Europe
In summary, the above reviewed literature suggest that the foreign-firm agglomeration (FDI stock and FDI stock per GDP), domestic agglomeration (gross fixed capital formation as a share of GDP), and overall agglomeration (population density) measures should be included in the following study. In addition, sectoral agglomeration (share of sectoral value added in GDP) measure, which is not commonly used in the literature will be included as an independent variable depending on the data availability.
2.3 Labor-Related Variables
The literature considers labor cost as an important cost-related variable. However, there is no consensus on the impact of this variable on FDI. In particular, some studies such as Carlton (1983), Campos and Kinoshita (2003), Kim et al (2003), Pusterla and Resmini (2005), Coughlin et al (1991) and Luger and Shetty (1985) find that low wage rate is an important factor to attract FDI in a region. On the other hand, Choe (2000) suggests that its effect is positively significant on FDI. One of the explanations offered is that foreign firms are ready to pay higher wages in order to hire more highly skilled workers.
Furthermore, some studies such as Resmini (1999), propose that different sectors react to wage differentials in different ways. In the referred study, the results show that wage differential is a key factor in traditional sectors while it has a minor effect in science and capital intensive sectors.
Finally, Mollick et al (2004) find that wage differential does not explain the differences in the amount of FDI into the Mexican states. Similarly, Mariotti and Piscitello (1995) finds no significant impact of labor cost on the location choice of foreign firms in Italy. Hence, there is no consistent result regarding the relationship between labor cost and FDI.
Another prominent labor market related variable is the quality of the labor force. In particular, availability of skilled and educated labor force is expected to have a
positive influence on FDI. Unfortunately, measuring labor quality is not an easy task. Studies use different proxies in order to take this factor into account. For instance, Woodward (1992) uses the median year of school completed and finds that presence of educated labor force is a significant factor to explain FDI at county level. On the other hand, Mariotti and Piscitello (1995) uses incidence of managers and office staff compared to total employees in manufacturing and level of schooling (ratio of students enrolled in secondary schools to the total resident population) as proxies for labor quality. Both variables are found to have minor effects on attracting FDI into Italian provinces.
Pusterla and Resmini (2005) use the number of third level students over total population in order to measure labor skills. The results show that foreign firms are not concerned about the level of labor skills in Central and Eastern European countries. However, the sign of its coefficient is negative in almost all specifications for low-technology intensive manufacturing sectors while it appears positive in the case of high-technology intensive sectors.
Finally, some studies examine the relationship between the unemployment rate and FDI. This variable may be influential on FDI for two reasons. As suggested by Carlton (1983), high unemployment rates may be an indicator of low local demand and deter FDI into a region. On the other hand, it is asserted that unemployment may be beneficial for firms since it decreases the cost of recruiting and maintaining a work force. Carlton’s (1983) results suggest that unemployment (proxied by ratio of unemployment rate to the normal level of unemployment) turns out to be positively significant in the
fabricated plastic products industry but has a significantly negative impact for electronic components. On the other hand, this variable has no considerable explanatory power in communication transmitting equipment industry. Finally, Coughlin et al (1991) suggests that high unemployment attracts more FDI into a region.
In summary, the above reviewed literature suggest that labor cost (hourly wage) and quality of labor (average years of secondary schooling in total population) measures should be included in the following study.
2.4 Institutional Variables
The institutional structure of a country is considered to be an important determinant of FDI in the literature. Existence of well-operating institutions creates better business climate for foreign as well as local firms. In order to take this effect into account, a variety of proxies are used in the literature. For instance, Campos and Kinoshita (2003) uses indices of “rule of law” and “quality of bureaucracy” in their study. A higher value of the first index is a sign of stronger and more impartial legal system. On the other hand, the second one reflects a more autonomous bureaucratic system from political pressure and easier regulations for the business operations. The results indicate that countries with better institutions attract more FDI inflows.
Kolstad and Villanger (2004) use a wider range of institution related variables (composite indices for macroeconomic stability, political risk rating, institutional quality and democratic accountability) and find varying results for the effects of these variables on FDI. However, the results regarding these variables are not robust to different specifications, sample or methodology.
In summary, the above reviewed literature suggest that overall risk of the country (for the construction of the variable, see Appendix A) and alternative economic stability (annual percentage change in the exchange rate of the national currency against the US dollar) measures should be included in the following study.
2.5 Government-Related Variables
Another debate in the literature is with respect to the impact of tax rates on FDI. Some studies, such as Kim et al (2003) maintain that tax rates have a positively significant effect on FDI. This is explanined by the fact that some foreign firms receive tax credits at home against tax payments in host country and this policy reduces tax aversion.
On the other hand, Luger and Shetty (1985) find that the effect of taxes on FDI varies across industries. They use a weighted average of state corporate and personal tax rates, and show that higher tax rates have a statistically negative impact on FDI in the
drug manufacturing industry, a positive impact for motor vehicle production, and insignificant in the industrial machinery sector. These results are suggestive of differential tax effects across sectors, further motivating the analysis in this thesis.
In another study, Carlton (1983) notes that taxes do not exert any considerable influence on FDI. The study explains this finding as being a result of the fact that the effect of tax differentials is offset by the differences in remuneration of immobile factors of production. Alternatively, the variable used in the study may not reflect the actual tax paid by the foreign firms.
Another government related variable used in the literature is the promotional expenditures. Especially at the state level, state expenditures to attract more FDI inflows is considered to be an important determinant. Regarding this effect, Carlton (1983) constructs an index reflecting the number of state incentives given to business. The empirical results show that state incentives have no considerable influence on the location choice of foreign firms. On the other hand, Coughlin et al (1991) suggest that state spending to attract more foreign investment has a positive and statistically significant impact on FDI.
Finally, Castellani et al (2003) examine the effect of EU regional policies and national policies on location choice of foreign firms in Europe. In the case of national policies, the stock of public infrastructure and corporate tax rate are considered. The estimation results show that EU policies make these regions more attractive for foreign
firms although the incentives are generic rather than being targeted to FDI. On the other hand, in the case of national policies corporate tax rate appears to be positive and significant while the stock of public infrastructure does not have a robust impact.
In summary, the above reviewed literature suggest that the tax measure (corporate tax rate) should be included in the following study.
2.6 Infrastructure-Related Variables
In the literature, good infrastructure is believed to attract more foreign investment into a region. To illustrate, Gholami, Lee and Heshmati (2003) examine the simultaneous causal relationship between investment in information and telecommunication technology (ICT) and FDI. The study relies on VAR models using data from a sample of 23 countries for the period 1976-1999. The results show that there is a causal relationship between FDI and ICT investment, which is used as a proxy for investment in telecommunications. In particular, the direction of the causality is from ICT investment to FDI in developed countries, while it is from FDI to ICT investment in developing countries.
Another study, Coughlin et al (1991) suggests that transportation infrastructure of a region significantly affects FDI. Finally, Mollick et al (2004) use the extent of
residential and non-residential telephone connections per thousand of state inhabitants and find it as a significant variable.
In summary, the above reviewed literature suggest that transportation (paved roads as a percentage of total roads) and communication facilities (telephone mainlines and internet users) should be included in the following study.
In addition to the variables discussed above under different groups, the real exchange rate will be included as an independent variable in the empirical analysis. This variable can be considered as a cost-related variable. Clearly, exchange rate movements will be significant for the firms having cost and revenues denominated in different currencies, which is dependent on the trade-orientation of the firm. Since a foreign firm is assumed to invest in a region where its profit is maximized, this variable is expected to play an important role in the location choice of foreign firms. For instance, Blonigen (1997) uses foreign acquisitions information at detailed sectoral level to analyze the determinants of acquisitions of US firms by Japanese investors. The results show that real dollar depreciations increase the probability that Japanese firms will acquire US firms, especially the firms that have more firm-specific assets.
CHAPTER 3
METHODOLOGY and DATA
In this section, the methodologies and data used in the thesis will be discussed. The study depends on two econometric methodologies, namely conditional and nested logit frameworks.
3.1 Methodology for Conditional Logit
The most preferred econometric method that is used to specify the location choice of firms is the conditional logit model proposed by McFadden (1974, 1984). This framework assumes that the firms invest in a region where the expected profits are expected to be highest. The profits of the firms are affected by some observable and unobservable location specific characters. The former constitutes the deterministic part while the latter is called the random part.
Suppose that the profit of ith firm investing in the jth region is represented in the
following way:
ij ij ij
π =βz +ε
where zij denotes the vector of location specific characteristics and εij follows a Weibull distribution which is identical and independent across different alternatives. Alternatively, the profit of the ith firm investing in region k (
k≠ j) will be
ik ik ik
π =βz +ε
Assuming that the firm has L mutually exclusive location choices, it will choose to invest in region j if πij >πik,∀ ≠j k and k=1,…,L. Thus, the probability that the ith firm chooses the jth
region is given by 1 exp( ) Pr( ) , , 1,..., exp( ) ij ij ij ik L ik k z P k j k L z β π π β = = > = ∀ ≠ =
∑
This equation can be estimated by maximum likelihood, which assumes a binary dependent variable di j such that
th th
1, if i firm chooses j region 0, otherwise
ij
d =
In this study, the determinants of the country choice of foreign firms will be analyzed considering country as well as sector level characteristics.
3.2 Methodology for Nested Logit
As discussed above, the most appropriate econometric technique to specify the location determinants of foreign firms is the conditional logit model. This model necessitates independence of irrelevant alternatives (IIA), which implies that the choice between two alternatives should be independent of the attributes of all other alternatives. Unfortunately, this assumption rarely holds in the empirical work. Hence, new techniques have been introduced in order to relax this assumption. The most widely used one is the multinomial nested logit (NL) model developed by McFadden (1978). This framework relaxes the IIA assumption by introducing dissimilarity coefficients. The alternatives are organized into groups according to their similarity so that the IIA assumption holds across nests. However, the choice between two alternatives may depend on the attributes of other alternatives in the same nest.
Following a similar notation in Börsch-Supan (1990), suppose that there are L alternatives that can be organized into K nests, with J(l) denoting the first alternative in the lth group and I(l) representing the number of alternatives in the lth group. Then, the
profit of the ith firm investing in the jthregion can be represented as follows:
πji =vji+εji (5)
where vji and ε denote the deterministic component of the profit and the random ji disturbance, respectively. The firms are assumed to maximize their stochastic profits. The model assumes that the disturbances are independently and identically distributed
and drawn from a generalized extreme value distribution. Then, the probability that the
ith firm invests in the jthregion is given by
Pji =Pj k j/ ( )Qk j( ) (6)
where Pj k j/ ( )denotes the conditional probability that jth alternative is selected given that
the nest k(j) is selected. It can be computed in the following way:
Pj k j/ ( ) =exp( /vj θk j( )) / [ ( )]E k j (7) where ( ) ( ) 1 ( ) [ ] exp( / ) J l I l n l n J l E l v θ + − = =
∑
and 1 ( ) ( ) l l l K l E l Q E l θ θ = =∑
is the marginal probability that theselected alternative belongs to lth group. Moreover, θl is called the “inclusive value
(dissimilarity) parameter” and denotes the average profit that a foreign firm expects to get from the alternatives in nest l.
McFadden (1981) clarifies the conditions under which the choice probabilities are consistent with the stochastic profit maximization. These conditions are as follows:
1. P vj( ) 0> , 1 ( ) 1 I j j P v = =
∑
, P vj( )=P vj( +α), ∀ ∈α R where v=( ,..., )v1 vI 2. ∂P vj( ) /∂vm= ∂P vm( ) /∂vj3. Pj must have non-negative even and non-positive odd mixed partial derivatives
with respect to components of v other than vj.
It is not difficult to show that the NL model satisfies the first two conditions. On the other hand, for the last condition to be satisfied globally, the inclusive value
parameters must lie within the unit interval ( 0<θl ≤ ). Unfortunately, this condition 1 rarely holds in empirical work.
In order to relax this assumption, Börsch-Supan (1990) states that the third condition can be modified so that it applies to a subset of l
R (∀ ∈v Rl) in which the relevant deterministic components lie. Hence, consistency with stochastic profit maximization holds only locally. Under such a condition, the inclusive value parameters need not lie within unit interval but must satisfy the following conditions9:
1 1 ( ) 1 ( ) l l l U v Q v θ ≤ = −
[
]
[
][
]
2 4 ( ) 3 1 ( ) 1 7 ( ) 1 ( ) l l l l l U v Q v Q v Q v θ ≤ = − + + − ; l=1,…, KKling and Herriges (1995) discuss three approaches for testing local consistency in NL models. In this paper, the first testing method will be applied if necessary.10 This method tests the consistency condition for all observations in the sample such that
1 ( ) j U j v θ ≤ 2 ( ) j U j v θ ≤ 9
The first condition is both necessary and sufficient for nests with only two alternatives, while the latter is required for the nests with three or more alternatives. Practically, even if a nest has many alternatives, it will be sufficient to check the first and second-order conditions mentioned above (Kling and Herriges, (1995)).
10 As it will be discussed later, at least two equations satisfy global consistency for each sector. Hence,
3.3 Data
The firm level data on FDI is obtained from Business Monitor International (BMI)11. BMI has been a leading online publisher of business information on global markets since it was established in 1984. FDI database of BMI includes comprehensive information on company characteristics such as number of employees, sales volume, industry and business activity as well as details of investment (e.g. year, industry, local competitors) undertaken in the host country. Data covers major FDI of multinational companies on global scope.
In this study, the sample consists of 17775 companies and 38 host countries that those companies have invested in during the period 1980-2004. Unfortunately, firm characteristics are not completely given for each firm. The year of investment or the industry is not stated for some firms. Hence, 17775 firms are covered in this thesis.
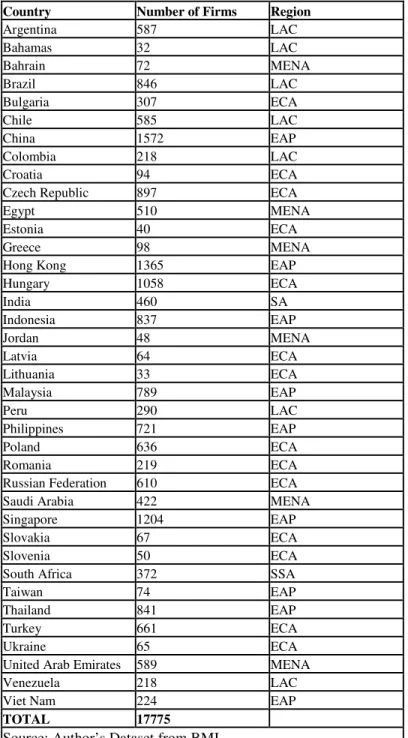
The distribution of companies across countries is presented in Table 3. China, Hong Kong and Singapore have the highest number of multinational firms while Bahamas, Lithuania and Estonia have the lowest in our dataset. Almost 43 percent of the firms in our dataset have invested in countries from the East Asia and Pacific region. The second most popular region for multinational firms seems to be East Europe and Central Asia. On the other hand, Sub Sahara Africa has the lowest share of FDI inflows in our
11http://www.businessmonitor.com
dataset. The detailed information about the regional distribution of 38 countries is presented in Table 4.
Table 3: Distribution of Firms across Countries
Country Number of Firms Region
Argentina 587 LAC Bahamas 32 LAC Bahrain 72 MENA Brazil 846 LAC Bulgaria 307 ECA Chile 585 LAC China 1572 EAP Colombia 218 LAC Croatia 94 ECA
Czech Republic 897 ECA
Egypt 510 MENA
Estonia 40 ECA
Greece 98 MENA
Hong Kong 1365 EAP
Hungary 1058 ECA India 460 SA Indonesia 837 EAP Jordan 48 MENA Latvia 64 ECA Lithuania 33 ECA Malaysia 789 EAP Peru 290 LAC Philippines 721 EAP Poland 636 ECA Romania 219 ECA
Russian Federation 610 ECA
Saudi Arabia 422 MENA
Singapore 1204 EAP
Slovakia 67 ECA
Slovenia 50 ECA
South Africa 372 SSA
Taiwan 74 EAP
Thailand 841 EAP
Turkey 661 ECA
Ukraine 65 ECA
United Arab Emirates 589 MENA
Venezuela 218 LAC
Viet Nam 224 EAP
TOTAL 17775
Source: Author’s Dataset from BMI
Table 4: Distribution of Firms across Regions (in percent)
East Asia and Pacific (EAP) 42.9 East Europe and Central Asia
(ECA) 27.0
Middle East and North Africa
(MENA) 9.8
South Asia (SA) 2.6
Sub Sahara Africa (SSA) 2.1 Latin America and Caribbean
(LAC) 15.6
Source: Author’s Dataset from BMI
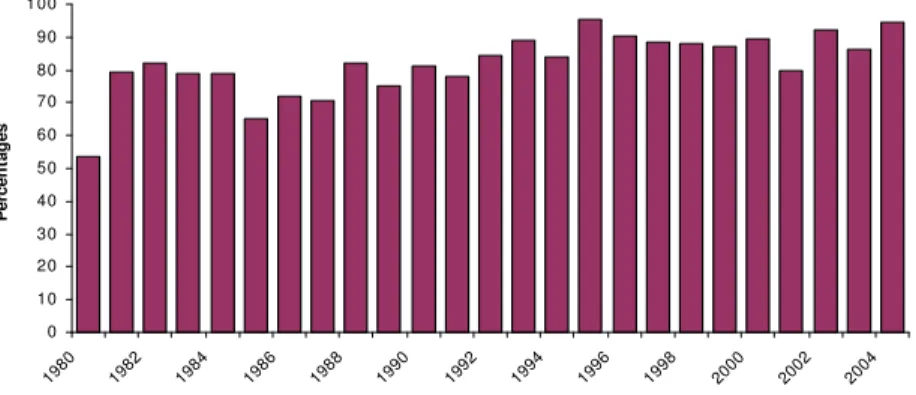
One disadvantage of using BMI dataset may be its coverage. The dataset provides FDI information of MNCs to only developing countries. However, as long as MNCs are deciding to invest in a developing country in a nested fashion, lack of developed country data does not bias our results. Fortunately, FDI flows to 38 countries included in this analysis cover a high portion of the total FDI flows to developing countries as Figure 2 shows. In particular, FDI flows to these 38 countries encompass more than 90% of all FDI flows to developing countries in 2004.
Figure 2: FDI Inflows to the Countries in the Dataset as a Share of FDI Inflows to the Developing Countries (in percentages)
Source: World Bank (2005), World Development Indicators.
0 10 20 30 40 50 60 70 80 90 1 00 1980 1982 1984 1986 1988 1990 1992 1994 1996 1998 2000 2002 2004 P e rc e n ta g e s
Another concern about BMI database is the degree that it reflects the population characteristics. One way of considering this issue may be to compare the distribution of FDI flows across main economic sectors in BMI dataset with the aggregate flows. Figure 3 suggests that coverage of the firms in the manufacturing and services sectors are very close to their sectoral distribution patterns reported by UNCTAD (2005) World Investment Report. In particular, the sectoral composition of the foreign firms in the BMI and UNCTAD datasets are correlated 95% for the Latin American and Caribbean economies, 97% for the West Asian countries, 99% for the South, East, and South-East Asian economies, and 98% for the South-East Europe and CIS countries. Thus, the BMI dataset seems to be a good representative of the MNCs in the countries in the dataset.
Figure 3: Assessing the Coverage of MNCs, in Comparison with the UNCTAD Database 0 10 20 30 40 50 60 70 80 Primary Manufacturing Services Primary Manufacturing Services Primary Manufacturing Services Primary Manufacturing Services L at in A m er ic a an d C ar ib b ea n W es t A si a S o u th , E as t an d S o u th -E as t A si a S o u th -E as t E u ro p e an d C IS
Share in Total (in percentages)
Author's Dataset from BMI World Investment Report (WIR)
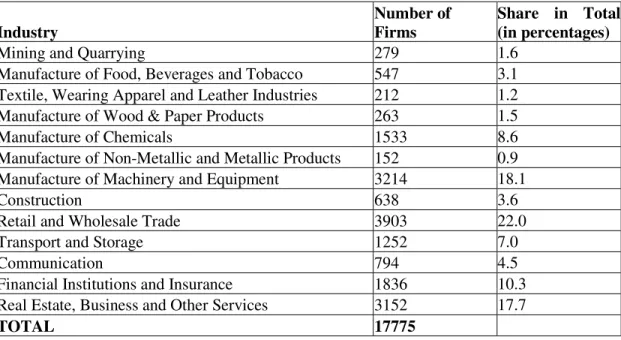
The distribution of firms in the dataset across sectors is reported in Table 5. Although the analysis is mainly based on industries classified according to 2-digit ISIC Rev2, the location choice of foreign firms will also be considered at more aggregated levels. Specifically, aggregation is conducted according to the tradability of the final products and the technology-intensity of the industries. In the former classification, the sectors are simply identified as tradables or non-tradables. For the latter classification, the UNIDO classification system is applied, grouping the sectors as resource-based, low technology intensive and medium and high-technology intensive sectors.12 The detailed information on the distribution of firms according to more aggregated classification is also reported in Table 5. The list and definitions of, as well as the sources of, the independent variables used in the analysis are provided in Appendix B.
Table 5: Distribution of Firms across Industries
Industry
Number of Firms
Share in Total (in percentages)
Mining and Quarrying 279 1.6
Manufacture of Food, Beverages and Tobacco 547 3.1 Textile, Wearing Apparel and Leather Industries 212 1.2 Manufacture of Wood & Paper Products 263 1.5
Manufacture of Chemicals 1533 8.6
Manufacture of Non-Metallic and Metallic Products 152 0.9 Manufacture of Machinery and Equipment 3214 18.1
Construction 638 3.6
Retail and Wholesale Trade 3903 22.0
Transport and Storage 1252 7.0
Communication 794 4.5
Financial Institutions and Insurance 1836 10.3 Real Estate, Business and Other Services 3152 17.7
TOTAL 17775
12
Table 5 (cont’ed) OF WHICH Tradables 5921 33.3 Non-Tradables 11284 63.5 Resource-Based Sectors 810 4.6 Low-Technology Sectors 364 2.0
Medium & High Technology Sectors 6793 38.2
Source: Author’s Dataset from BMI.
CHAPTER 4
RESULTS
In this section, the estimation results will be discussed. The econometric methodology is the conditional logit model whenever the IIA assumption holds. Nested logit framework will be used otherwise.
4.1 Tradable and Non-Tradable Sectors
The Hausman specification test results show that IIA assumption does not hold for tradable and non-tradable sectors. Hence, nested logit framework should be used in these aggregated sectors.
literature, there is no specific way to identify the appropriate nests for a model. Hence, one needs to use alternative nests and check the global consistency as described in the previous chapter. If global consistency does not hold in any specification, local consistency will be considered based on the methodology suggested by Kling and Herriges (1995).
The most obvious nest structure for the location decision of foreign firms is based on the geographic location of the individual countries. The countries in our dataset can be classified into three groups according to the geographic region they are located in. These groups are Eastern and Central Asia (ECA), East Asia and Pacific (EAP) and Latin America and Caribbean (LAC/Middle East) and North Africa (MENA).13 The second nest structure is based on the income levels of the countries. The classification is in line with the World Bank grouping: upper income (UI)/upper middle income (UMI) and lower income (LI)/lower middle income (LMI) countries. Such an aggregation is needed since the number of countries in UI and LI groups is low in the dataset. Finally, the countries are classified into two groups according to their FDI potential based on UNCTAD methodology. The descriptions of these groups are as follows: (i) front-runners (FR): countries with high FDI potential and performance; (ii) above potential (AP): countries with low FDI potential but strong FDI performance; (iii) below potential (BP): countries with high FDI potential but low FDI performance; and (iv) under-performers (UP): countries with both low FDI potential and performance. In the analysis, BP and FR countries are combined with UP and AP countries, respectively.
13 LAC and MENA regions are aggregated into one category due to the small number of observations in
The nested logit results for tradable sectors are presented in Table 6. The proper nest structure is determined by the FDI potential of the countries – the only structure that satisfies global consistency. A priori, the location choice of foreign firms is not expected to depend on the market size. However, the results show that the probability of choosing a specific region increases as the market size gets larger. This scale effect signifies that foreign investors prefer to invest in a large market although their final product is tradable. Moreover, this result may be indicative of the tariff-jumping motive of FDI. Foreign firms may choose to produce and sell directly in the host economy rather than exporting the product in order to avoid paying high import taxes. On the other hand, the demand potential of the country, measured by real GDP per capita, is not a significant factor for location decision of foreign firms, which could somehow refute the tariff-jumping explanation provided above.
As discussed in Chapter 2, agglomeration related variables are considered to be major determinants of FDI. Hence, three different measures are included as proxies for agglomeration economies. The impact of the first proxy, domestic investment, is indeterminate in the literature. In our analysis, it has a positive and significant coefficient – implying that domestic investment crowds in foreign investment. Similarly, higher FDI stock attracts more foreign firms in a country. This result is not surprising since presence of foreign firms may imply considerable supplier network and infrastructural facilities in that country signifying positive externalities. The positive and significant relationship between investment in a region and FDI flows is consistent with the findings of Guimaraes et al (2000) and Mariotti and Piscitello (1995). On the other hand, population
density is not a significant determinant for location choice of foreign firms as also suggested by Mariotti and Piscitelo (1995). However, this variable can also be considered as a labor related variable. In this regard, higher population density may be a sign of a large pool of labor available in the economy. Alternatively, firms may consider high population as a sign of poverty in the region. The negative coefficient of this variable may be suggestive that foreign firms view population density as a sign of the latter economic indicator.
Another set of explanatory variables consist of the real exchange rate and corporate tax rate. Surprisingly, probability of choosing a specific country significantly increases with the corporate tax rate. This result may be due to omitted variables rather than a structural characteristic of tradables sector. Moreover, higher tax rate may signify higher productivity and hence attract foreign firms into the country. On the other hand, this result may result from the incentives (e.g. tax credits) granted to foreign firms by their own governments as suggested by Kim et al (2003). Another cost related item, exchange rate seems to be a significant determinant of FDI decision. In particular, real depreciation of the local currency against the US$ is found to increase the probability of firms in tradable sector investing in that region. This is suggestive of wealth effects of the real exchange rate on the foreign firms as depicted in Blonigen (1997) and Froot and Stein (1991). This could either be on account of the wealth effect of the real exchange rate changes through its differential impact on the revenue and costs of the firms (see Blonigen, 1997) or external and internal financing terms (see Froot and Stein, 1991) leading to increased foreign investment probability in the region. This finding could also
be interpreted as an indication of the extent of vertical FDI outweighing the extent of horizontal FDI, where the cost and revenues of the firm are mostly denominated in different currencies. This interpretation holds for the firms in both the nontradables and the tradables sectors.
Openness enters the equations with a positive sign although its significance does not remain robust across different specifications. Openness measures the trade performance of the country and it is calculated as the ratio of sum of exports and imports to GDP. It is not surprising that this variable has a positive impact on the probability of choosing a specific country by foreign firms operating in tradable goods sector. The foreign firms seem to choose countries that are more open to international trade, which could be indicative of search for an export-base instead of tariff-jumping motive for FDI.
Human capital, which is a labor-related variable, is also included in the estimations. In the literature, many proxies are used to account for the quality of labor. As explained in the literature review, these variables are found to be insignificant determinants of FDI (Campos and Kinoshita, 2003; Mariotti and Piscitello, 1995; Choe, 2000). However, human capital appears to be a significant determinant of the location choice of MNCs in tradables sectors. This implies that foreign firms investing in this sector prefer countries that have a qualified labor force.
Overall, the estimation results for the tradables sector suggest that the main determinants of the location decision of foreign firms are agglomeration economies.
Unfortunately, no sectoral variable is included in the analysis. The reason is that missing observations for each variable should be completed in the dataset in order to obtain nested logit estimates. Since the sectoral variables have very large number of missing values, they are not included in the estimations.
The nested logit estimation results for non-tradables sector are reported in Table 7. Similar to the tradables sector, the proper nest structure is determined by the FDI potential of the countries. The market size and demand potential of the countries appear to be significant factors to explain the location choice of foreign firms. This result is not surprising since foreign firms invest in these countries in order to produce for the domestic market. In the case of agglomeration economies, domestic investment and FDI stock significantly increase the probability that a foreign firm invests in a country. However, population density does not seem to be a significant factor of FDI in the regression where global consistency holds. Its negative sign may reflect the belief that high population density is an indication of poverty in a region.
In non-tradables sector, both real exchange rate and corporate tax rate have positive and significant coefficients. The implications of these results were discussed above and apply to the non-tradables sectors as well. Finally, openness appears to have a negative impact on the location choice of foreign firms in non-tradables sector. This could be interpreted as the firms in non-tradables sectors viewing international trade as increased competition and would prefer protected business environments.
To summarize, the results regarding the location choice of firms in the tradables and nontradables sectors support our hypothesis that the factors that govern the economic geography of MNCs differs across sectors, even considering very aggregated classifications. We find that, regardless of the tradability characteristic of the final product the firm produces, MNCs prefer investing in regions that are larger in economic size, whose real exchange is depreciating, that have higher statutory corporate tax rates, are well-endowed with human capital and where agglomeration economies exist. On the other hand, the location choice of firms in the tradables and nontradables sector are affected from the domestic demand potential, population density, and openness to trade in opposite directions. In particular, while firms producing tradable goods do not consider either the local purchasing power or the population density to be important in choosing the location, firms producing nontradables consider both to be important factors. We interpret this finding as suggestive of more vertical FDI among the tradables firms, who seem to invest for cost- or efficiency-seeking purposes rather than market-seeking purposes. Finally, the openness of the host country to trade is found to positively affect firms in the tradables sectors, while affecting the firms in the nontradables sectors negatively.
4.2 Technology Intensity
The driving forces of FDI may vary across sectors that have different technology intensities. UNIDO classifies industries into four groups according to their technology
intensity. These are resource-based industries, industries that are low technology intensive, medium technology intensive and high technology intensive14.
According to the Hausmann specification test results, IIA assumption holds for the resource based and low-technology intensive sectors, so that these can be estimated using the conditional logit framework. On the other hand, the medium and high-technology intensive sectors have to be included in a nested logit framework.
In the case of resource-based sectors, IIA assumption is satisfied for all specifications, thus conditional logit estimation results are reported in Table 8. Although it is hard to say much about the factor intensity of production in these sectors, these are known to be labor intensive, but they may also be capital, scale or skill intensive15. The comparative advantage in such sectors mostly stems from the favorable natural resources of a country. In resource-based sectors, market size appears to be a significant factor in all specifications. Although market size matters, demand potential of the country measured by GDP per capita is not a significant factor in these sectors. This may be due to the fact that GDP per capita is a measure of many characteristics of a country such as productivity. The foreign firms operating in resource-based sectors may not be taking the level of productivity into account when deciding the location of their investment. Another market related variable is the value added share of the sector in the GDP of the country. The results suggest that increasing share of these sectors in the economy deters
14 In this study medium and high technology intensive industries are aggregated into one group due to small
number of firms in high-technology intensive sectors.
15 The descriptions of the sectors that are classified according to their technology intensity are based on
foreign investment. This may reflect that high value added share is sometimes considered as an indication of saturated market and/or higher competition for the goods produced in these sectors. This suggests that foreign firms prefer to invest in untapped markets in resource-based sectors. Since the firms are assumed to maximize their profits in this model, they are discouraged to invest in these countries regarding their revenues. Alternatively, higher value added share may initially attract new comers but the effect may be reversed after a critical point. However, this non-linearity hypothesis needs to be tested.
The second main factor for the location choice of foreign firms in these sectors is the real exchange rate. A country with a depreciating currency seems to attract more foreign investment in resource-based sectors. This result is suggestive that for firms in the based sectors either the intermediate products in producing the resource-based products are mostly traded goods, or that the relative attractiveness of the internal and external financing of these firms are influenced by exchange rates. One could argue that the imperfections in the capital and/or goods markets seem to mostly affect the firms in the resource-based sectors, rather than those producing low, medium, or high-technology intensive products. However, the aggregation across sectors could be hiding differential effects of the real exchange rate across different low, medium or high-technology intensive sub-sectors at the 2-digit ISI-classification level, which will be further detailed in the following section.